HAL Id: hal-02897829
https://hal.archives-ouvertes.fr/hal-02897829
Submitted on 13 Jul 2020
HAL is a multi-disciplinary open access
archive for the deposit and dissemination of
sci-entific research documents, whether they are
pub-lished or not. The documents may come from
teaching and research institutions in France or
abroad, or from public or private research centers.
L’archive ouverte pluridisciplinaire HAL, est
destinée au dépôt et à la diffusion de documents
scientifiques de niveau recherche, publiés ou non,
émanant des établissements d’enseignement et de
recherche français ou étrangers, des laboratoires
publics ou privés.
Distributed under a Creative Commons Attribution| 4.0 International License
from eight cattle breeds
Irene van den Berg, Ruidong Xiang, Janez Jenko, Hubert Pausch, Mekki
Boussaha, Chris Schrooten, Thierry Tribout, Arne B. Gjuvsland, Didier
Boichard, Øyvind Nordbø, et al.
To cite this version:
Irene van den Berg, Ruidong Xiang, Janez Jenko, Hubert Pausch, Mekki Boussaha, et al..
Meta-analysis for milk fat and protein percentage using imputed sequence variant genotypes in 94,321
cattle from eight cattle breeds. Genetics Selection Evolution, BioMed Central, 2020, 52 (1), pp.37.
�10.1186/s12711-020-00556-4�. �hal-02897829�
RESEARCH ARTICLE
Meta-analysis for milk fat and protein
percentage using imputed sequence variant
genotypes in 94,321 cattle from eight cattle
breeds
Irene van den Berg
1*, Ruidong Xiang
1,2, Janez Jenko
3, Hubert Pausch
4, Mekki Boussaha
5, Chris Schrooten
6,
Thierry Tribout
5, Arne B. Gjuvsland
3, Didier Boichard
5, Øyvind Nordbø
3, Marie‑Pierre Sanchez
5and Mike E. Goddard
1,2Abstract
Background: Sequence‑based genome‑wide association studies (GWAS) provide high statistical power to identify candidate causal mutations when a large number of individuals with both sequence variant genotypes and phe‑ notypes is available. A meta‑analysis combines summary statistics from multiple GWAS and increases the power to detect trait‑associated variants without requiring access to data at the individual level of the GWAS mapping cohorts. Because linkage disequilibrium between adjacent markers is conserved only over short distances across breeds, a multi‑breed meta‑analysis can improve mapping precision.
Results: To maximise the power to identify quantitative trait loci (QTL), we combined the results of nine within‑popu‑ lation GWAS that used imputed sequence variant genotypes of 94,321 cattle from eight breeds, to perform a large‑ scale meta‑analysis for fat and protein percentage in cattle. The meta‑analysis detected (p ≤ 10−8) 138 QTL for fat per‑
centage and 176 QTL for protein percentage. This was more than the number of QTL detected in all within‑population GWAS together (124 QTL for fat percentage and 104 QTL for protein percentage). Among all the lead variants, 100 QTL for fat percentage and 114 QTL for protein percentage had the same direction of effect in all within‑population GWAS. This indicates either persistence of the linkage phase between the causal variant and the lead variant across breeds or that some of the lead variants might indeed be causal or tightly linked with causal variants. The percentage of intergenic variants was substantially lower for significant variants than for non‑significant variants, and significant variants had mostly moderate to high minor allele frequencies. Significant variants were also clustered in genes that are known to be relevant for fat and protein percentages in milk.
Conclusions: Our study identified a large number of QTL associated with fat and protein percentage in dairy cattle. We demonstrated that large‑scale multi‑breed meta‑analysis reveals more QTL at the nucleotide resolution than within‑population GWAS. Significant variants were more often located in genic regions than non‑significant variants and a large part of them was located in potentially regulatory regions.
© The Author(s) 2020. This article is licensed under a Creative Commons Attribution 4.0 International License, which permits use, sharing, adaptation, distribution and reproduction in any medium or format, as long as you give appropriate credit to the original author(s) and the source, provide a link to the Creative Commons licence, and indicate if changes were made. The images or other third party material in this article are included in the article’s Creative Commons licence, unless indicated otherwise in a credit line to the material. If material is not included in the article’s Creative Commons licence and your intended use is not permitted by statutory regulation or exceeds the permitted use, you will need to obtain permission directly from the copyright holder. To view a copy of this licence, visit http://creat iveco mmons .org/licen ses/by/4.0/. The Creative Commons Public Domain Dedication waiver (http://creat iveco mmons .org/publi cdoma in/ zero/1.0/) applies to the data made available in this article, unless otherwise stated in a credit line to the data.
Background
The identification of causal mutations is important to take full advantage of sequence data to improve the accuracy of genomic prediction [1, 2]. Furthermore, it contributes to a better understanding of the biological
Open Access
*Correspondence: irene.vandenberg@agriculture.vic.gov.au
1 Agriculture Victoria Research, AgriBio, 5 Ring Road, Bundoora, VIC 3083,
Australia
mechanisms that underlie variation in quantitative traits and diseases. Since an increasing amount of sequence data is becoming available, it is possible to perform sequence-based genome-wide association studies (GWAS) to identify candidate causal mutations or mark-ers in high linkage disequilibrium (LD) with them. How-ever, due to the stringent thresholds that are necessary to avoid false positive associations, very large cohorts with both sequence variant genotypes and phenotypes are required to identify quantitative trait loci (QTL) with small to moderate effects.
Increasing the statistical power to identify candidate causal variants is possible by combining multiple data-sets. However, in practice, the sharing of data at the individual level is not always possible, and prevents the compilation of large mapping cohorts. An alternative approach to compiling large mapping cohorts without exchanging data at the individual level is to perform a meta-analysis that uses GWAS summary statistics to approximate a GWAS using the full, combined dataset [3,
4]. For stature, an international collaboration has shown that a large-scale, across-population meta-analysis pro-vides high power to detect trait-associated variants [5]. Recently, several other meta-analyses have been carried out in cattle for multiple traits including fat and protein percentages in milk [6–9]. To date, the largest meta-analysis for fat and protein percentage included the sin-gle nucleotide polymorphism (SNP) chip genotypes of 78,772 cows from three dairy cattle breeds in France [9]. Performing a meta-analysis of summary statistics gen-erated from multiple breeds across multiple countries also facilitates the combination of data from mapping cohorts that do not contain the same set of variants or that were prepared using different imputation or associa-tion methods.
In addition to achieving sufficient power to identify trait-associated variants, high precision is important in GWAS in order to prioritize a small number of variants as candidate causal mutations. Because of the long-range LD that is present in most cattle breeds [10], many vari-ants in high LD tag the same QTL, which makes the iden-tification of causal variants a difficult task. Because LD is conserved over shorter distances across breeds than within a breed, a multi-breed GWAS or across-breed meta-analysis can improve mapping precision [6].
Although direct selection on milk composition in dairy cattle has been more limited than selection on milk yield, a correlated response would be expected due to the genetic correlation between milk yield and composi-tion. While all dairy breeds have been selected for milk yield and hence composition, slight differences in selec-tion pressures may have occurred in different breeds. Pausch et al. [7] reported higher FST values for QTL than
non-QTL, suggesting differences in selection pressures in the breeds used in their study.
To maximise both power and precision of a GWAS for fat and protein percentages in milk, we carried out meta-analyses of the summary statistics of nine within-population GWAS that used imputed sequence variant genotypes of 94,321 individuals representing eight cattle breeds. Besides identifying QTL for each trait, significant and non-significant variants were compared in terms of minor allele frequency (MAF), functional annotations and FST.
Methods
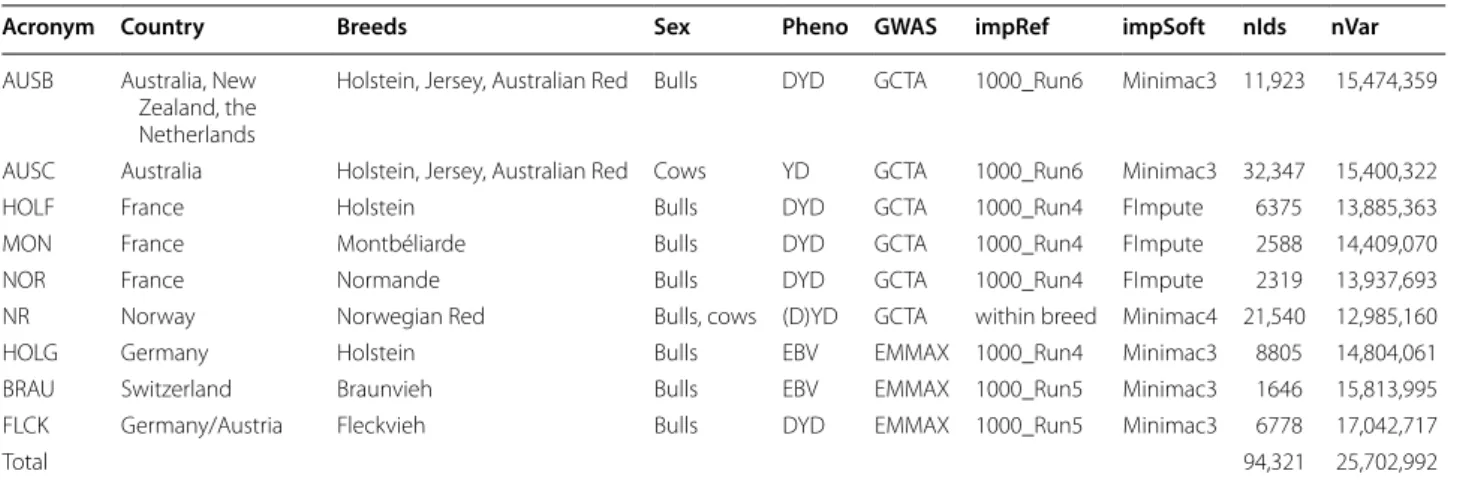
As input for the meta-analyses, summary statistics of nine within-population GWAS were used. In total, the GWAS included imputed sequence variant genotypes of 94,321 individuals. The within-population GWAS are summarized in Table 1.
Phenotypes used for within‑population GWAS
Phenotypes were either yield deviations (YD) of cows, i.e. own mean performances adjusted for environmen-tal effects, or daughter yield deviations (DYD) of bulls, i.e. average daughter performance adjusted for environ-mental effects and for breeding value of the mates, or a combination of those. Two studies simply used estimated breeding values (EBV) of bulls, which were not der-egressed. However, considering the high relatability of the traits (0.89 in BSW and 0.95 in HOL [7]), the contri-bution of information from relatives to the EBV is very small and should not have any major consequences on the GWAS [11].
The GWAS for the Australian dataset were performed across breeds, but separately for bulls (AUSB) and cows (AUSC). The Australian animals and the GWAS model are described in a previous report [12]. Briefly, the AUSB dataset contained 9739 Holstein, 2059 Jersey and 125 Australian Red bulls, and the AUSC dataset consisted of 22,899 Holstein, 6174 Jersey, 424 Australian Red and 2850 crossbred cows. Phenotype data included 6569 CRV bulls (https ://www.crv4a ll-inter natio nal.com/) with phe-notypes derived from their Interbull MACE breeding values (https ://inter bull.org/ib/inter bulla ctivi ties), dere-gressed to the Australian scale, and converted to the scale of the daughter trait deviation. The remaining 5354 bulls and all 32,347 cows were from DataGene (https ://datag ene.com.au/). The GWAS for the Norwegian population (Norwegian Red cattle, NR) was performed using data on 21,540 and 21,550 bulls and cows, for fat and protein per-centage, respectively. All other GWAS were performed within breed and sex. More details on the HOLG, BRAU and FLCK GWAS can be found in [7].
Genotypes used for within‑population GWAS
Only variants with a MAF lower than 0.002 or a minor allele count (MAC) higher than 4 and, if available, an imputation r2 (as provided by the imputation
pro-gram) ≥ 0.4 was considered for the within-population GWAS. In total, 25,702,992 (25,702,995) distinct vari-ants were analysed for fat (protein) percentage, with the number of variants per within-population GWAS rang-ing from 12,985,160 to 17,042,717. In total, 7,520,048 (7,520,050) variants were common to all GWAS for fat (protein) percentage.
Most GWAS populations were imputed using multi breed reference populations that comprised 1147, 1557 or 2333 individuals from Run 4, 5 or 6 of the 1000 bulls genomes project, respectively [13], except for the Nor-wegian Red population, that was imputed using a within-breed reference population of 378 Norwegian Red bulls. Imputation was done using Minimac3 [14], Minimac4 [14] and FImpute [15].
Within‑population GWAS
GWAS were carried out by single SNP regressions using best-guess genotypes and the mixed linear model asso-ciation (MLMA) analysis as implemented in the GCTA software [16], or using imputed allele dosages and the MLMA approach as implemented in the EMMAX soft-ware [17].
Meta‑analysis
All 25,702,992 variants that were present in at least one of the within-population GWAS were included in the meta-analysis. The meta-analysis was based on the weighted Z-scores model as implemented in the METAL software
[18] that considers the p-value, direction of effect and number of individuals included in each within-population GWAS. Because the scaling of the phenotypes used for the within-population GWAS differed between the popula-tions, we used the weighted Z-scores model that uses the significance and direction of marker effects as input, rather than alternative models that use allele substitution effects and corresponding standard errors. Van den Berg et al. [6] found that, when combining GWAS with summary statis-tics from multiple GWAS with difference in scaling of the phenotypes, the weighted Z-scores model yielded results that were very similar to those obtained by a full analysis combining all data used for the GWAS. For each variant and each within-population GWAS, Z-scores were com-puted as:
where Zk is the Z-score for GWAS k , pk the p-value
esti-mated in GWAS k , k the direction of effect in GWAS
k , and Φ and Φ−1 are the standard normal cumulative
distribution function and its inverse, respectively. Subse-quently, overall Z-scores were computed as:
where wk is the square root of the number of individuals
used in GWAS k . An overall p-value was then computed as: Zk=Φ−1 1 −pk 2 ×�k, Z = kzkwk kw 2 k , p = 2Φ(−|Z|). Table 1 Description of GWAS used in the meta-analysis
Pheno: phenotypes used i.e. daughter yield deviations (DYD, bulls), yield deviations (YD, cows), estimated breeding values (EBV), GWAS: software used for GWAS, impRef: imputation reference, impSoft: imputation software; nIds: number of individuals; nVar: number of variants; nIds and nVar were the same except in Norwegian Red (21,550 individuals and 12,985,177 variants for protein content)
Acronym Country Breeds Sex Pheno GWAS impRef impSoft nIds nVar
AUSB Australia, New Zealand, the Netherlands
Holstein, Jersey, Australian Red Bulls DYD GCTA 1000_Run6 Minimac3 11,923 15,474,359 AUSC Australia Holstein, Jersey, Australian Red Cows YD GCTA 1000_Run6 Minimac3 32,347 15,400,322 HOLF France Holstein Bulls DYD GCTA 1000_Run4 FImpute 6375 13,885,363 MON France Montbéliarde Bulls DYD GCTA 1000_Run4 FImpute 2588 14,409,070 NOR France Normande Bulls DYD GCTA 1000_Run4 FImpute 2319 13,937,693 NR Norway Norwegian Red Bulls, cows (D)YD GCTA within breed Minimac4 21,540 12,985,160 HOLG Germany Holstein Bulls EBV EMMAX 1000_Run4 Minimac3 8805 14,804,061 BRAU Switzerland Braunvieh Bulls EBV EMMAX 1000_Run5 Minimac3 1646 15,813,995 FLCK Germany/Austria Fleckvieh Bulls DYD EMMAX 1000_Run5 Minimac3 6778 17,042,717
QTL detection
All variants with a p-value lower than 10−8 were
declared significant. To account for multiple testing, the false discovery rate (FDR) was calculated for each within-population GWAS and the meta-analysis as FDR = nVariants × 10−8 /nSign , where nVariants is
the number of variants included in the GWAS and nSign is the number of variants with a p-value lower than 10−8.
QTL were selected by first ordering the significant vari-ants based on their p-values, and subsequently select-ing the most significant variants first, with at least 1 Mb between adjacent QTL. Variants within 1 Mb of a more significant variant were assumed to be part of the more significant QTL and not selected as additional QTL. COJO
Because LD may be conserved along longer distances than 1 Mb, we performed a conditional and joint analy-sis (COJO) as implemented in GCTA [19] to test how many of the QTL detected in the meta-analysis appeared to be independent. As a reference sample to estimate the LD structure, we used sequence data of 53 Fleckvieh, 451 Holstein, 90 Jersey, 55 Montbéliarde, 45 Normande and 25 Norwegian Red individuals that were included in Run 6 of the 1000 Bulls genome project [13]. We only included the top variants selected as QTL in the COJO analysis and set the window size to 100 Mb.
Validation meta‑analysis
To validate the QTL detected in the meta-analysis, we performed a second meta-analysis using data on 34,860 cows not included in the original meta-analysis. These cows originated from two countries, Australia and France, and four breeds, Holstein, Jersey, Mont-béliarde and Normande. The French populations used in the validation study are described in more detail by Sanchez et al. [20]. Table 2 summarizes the four within-population GWAS that were used as input for the vali-dation meta-analysis. The valivali-dation meta-analysis was performed only for the QTL that were detected in the first meta-analysis and that segregated in at least one of the four validation populations. These within-population
GWAS and the validation meta-analysis were performed in the same manner as described above for the original analysis. To validate QTL, we compared the direction of the Z-score and p-value in the meta-analyses. Our previ-ous study showed that the comparison of the direction of the effect of variants across different GWAS results can be more powerful in detecting consistent signals than the sole comparison of p-values between different GWAS [12].
Minor allele frequencies
To compare the MAF of significant variants with the MAF of all variants, we estimated the allele frequencies of the total population used for the meta-analyses. First, the allele counts at each position were computed using the allele frequency in each population. Then, the allele counts were combined and used to estimate the MAF of each variant in the whole population used for the meta-analyses.
Functional annotations
Functional annotations were compared between signifi-cant and all other variants in order to determine if certain functional categories were enriched for trait-associated variants. Genomic coordinates and functional annota-tions were obtained according to the UMD3.1 assembly of the bovine genome and Ensembl’s Variant Effect Pre-dictor [21, 22]. We used LiftOver (https ://genom e.ucsc. edu/cgi-bin/hgLif tOver ) to convert the positions of the detected QTL from UMD3.1 to their positions on the new ARS-UCD1.2 genome.
eQTL analysis
Results of the meta-analyses were compared with those of a previous eQTL study [23, 24] to identify potential overlap between QTL and eQTL. The eQTL study con-tained data of 105 Holstein and 26 Jersey cows. In total, 9,191,239 and 8,587,100 variants were included in both the eQTL study using white blood cells and cells col-lected from milk samples, respectively, and the meta-analysis. The cells collected from milk samples included immune cells and mammary gland epithelial cells. The
Table 2 Description of the GWAS used in the validation meta-analysis
Pheno: phenotypes used were yield deviations (YD, cows); GWAS: software used for GWAS; impRef: imputation reference; impSoft: imputation software; nIds: number of individuals
Acronym Country Breeds Sex Pheno GWAS impRef impSoft nIds
VAUSC Australia Holstein, Jersey Cows YD GCTA 1000_Run6 Minimac3 26,953
VHOLF France Holstein Cows YD GCTA 1000_Run4 FImpute 2216
VMON France Montbéliarde Cows YD GCTA 1000_Run4 FImpute 3032
VNOR France Normande Cows YD GCTA 1000_Run4 FImpute 2659
transcriptome of cells collected from milk samples shared a high similarity with that of the mammary gland tissue. A detailed description of the RNA sequence data generation for each tissue is reported in [25]. The associ-ation between the variants and gene expression was esti-mated using a linear model. A variant was declared as an eQTL if its genotype was significantly associated with the expression of a gene located within 1 Mb of the variant with a p-value ≤ 10−6.
FST
To investigate whether significant SNPs are associated with higher FST values and investigate the potential
pres-ence of different selection pressures between breeds, we calculated FST values for 16,626,224 sequence SNPs using
allele frequencies in 53 Fleckvieh, 451 Holstein, 90 Jersey, 55 Montbéliarde, 45 Normande and 25 Norwegian Red individuals that were included in Run 6 of the 1000 Bulls genome project [13]. FST values were computed for all
breeds combined according to Weir and Cockerham [26], as implemented in GCTA [16], to measure the divergence between the breeds in the meta-analysis.
DAVID analysis
We used the Database for Annotation, Visualization and Integrated Discovery (DAVID) functional annotation
tool [27, 28] to investigate if gene ontology terms were enriched for genes located within the QTL. Genes with variants that were significant in the meta-analysis and located in or near the gene, according to previously described annotation, were used as input for DAVID. In the DAVID analysis, we included the following terms: COG_ONTOLOGY, UP_KEYWORDS, UP_SEQ_FEA-TURE, GOTERM_BP_DIRECT, GOTRM_CC_DIRECT, GOTERM_MF_DIRECT, KEGG_PATHWAY and UP_TISSUE.
Results
Number of QTL detected
Figures 1 and 2 show Manhattan plots of the meta-analysis for fat and protein percentage, respectively. Manhattan plots of the within-population GWAS are in Additional file 1: Figure S1. Table 3 compares the number of significant variants and QTL in the within-population GWAS and the meta-analysis. The number of signifi-cant variants detected in the within-population GWAS ranged from 2117 for protein percentage in BRAU to 13,955 for fat percentage in AUSB. For protein percent-age, the meta-analysis detected more variants than all the GWAS combined together, while for fat percentage, all the GWAS combined together detected more significant variants than the meta-analysis.
Fig. 1 Manhattan plot of the meta‑analysis for fat percentage. Red line indicates p = 10−8
For both fat and protein percentage, more QTL were detected in the meta-analysis than with the within-popu-lation GWAS. The lists of the QTL detected in the meta-analysis are in Additional file 2: Tables S1 and Additional file 3: Table S2.
Several of the QTL detected in the meta-analysis were not significant in any of the within-population GWAS. For example, the meta-analysis detected a QTL for pro-tein percentage located at 7,924,949 bp on chromosome 3, that had a p-value of 9.4 × 10⁻¹⁴ in the meta-analysis.
In the within-population GWAS, the highest significance for this variant was for the NR breed with a p-value of 8.4 × 10⁻⁴.
Multiple variants were significant in the within-pop-ulation GWAS, but not in the meta-analysis. Most of these variants had inconsistencies in direction of effect between populations in the within-population GWAS. For example, a QTL for protein percentage was detected in the NR breed (p-value of 2.7 × 10⁻¹⁰) at 35,509,237 bp
on chromosome 25 (see Additional file 4: Figure S2). The alternate allele of the lead variant had a positive effect in the AUSB, AUSC, HOLF, MON, NOR, and FLCK breeds, but a negative effect in the NR, HOLG and BRAU breeds, and was not significant in any GWAS except in the GWAS for NR. The meta-analysis revealed a QTL nearby at 36,527,270 bp that was only included in the GWAS for NR and had a p-value of 3.7 × 10⁻²⁵. Visual inspection of
this region on chromosome 25 indicated that a possible peak visible in the GWAS for NR and the meta-analysis, that encompasses both the QTL at 35.5 Mb and 36.5 Mb, with fewer significant variants associated with the peak in the meta-analysis than the GWAS (see Additional file 4: Figure S2)
COJO
Out of the 138 and 176 QTL detected for fat and pro-tein percentage, 132 and 159 were present in the data-set that was used to estimate the LD structure for COJO. The COJO analyses retained 74 QTL for fat percentage and 84 QTL for protein percentage with a p-value ≤ 10−8. In most cases, the discarded variant
was close to another variant that was retained. This implies that the two variants mark only a single QTL and not two independent QTL. Nevertheless, four vari-ants were retained between the start of chromosome 14 and 5 Mb, which implies that there are at least three other QTL for fat percentage in this region as well as DGAT1. For each QTL, Additional file 2: Tables S1 and Additional file 3: Table S2 indicate whether QTL were retained by COJO or not, and the p-value in the COJO analysis.
Validation meta‑analysis
Of the 138 QTL detected for fat percentage, 123 were present in the validation analysis, of which 107 (87%) had the same direction of Z-score in the original meta-analysis and the validation meta-analysis. Fifteen of these QTL (12.2%) were significant (p ≤ 10−8) in the validation
anal-ysis. For protein percentage, 158 of the 176 QTL detected in the meta-analysis were present in the validation analy-sis. One hundred % of the QTL had the same direction of Z-score and 28 (17.7%) were significant in both analyses. Additional file 2: Table S1 and Additional file 3: Table S2 show for each QTL if they were present in the validation analysis, if they had the same direction of Z-score, and the p-value in the validation analysis.
Table 3 Number of variants and QTL detected in the GWAS and meta-analysis for fat and protein percentage
fat %: fat percentage; prot %: protein percentage; nS: number of significant variants; FDR: false discovery rate; nQ: number of QTL; nS/nQ: number of significant variants per QTL; AUSB: Australian bull dataset; AUSC: Australian cow dataset; HOLF: French Holstein; MON: Montbéliarde; NOR: Normande; NR: Norwegian Red; HOLG: German Holstein; BRAU: Braunvieh; FLCK: Fleckvieh; GWAS: non-overlapping significant variants select in any of the 9 GWAS; META: meta-analysis
Analysis Fat % prot %
nS FDR nQ nS/nQ nS FDR nQ nS/nQ AUSB 8871 1.7 × 10⁻⁵ 56 158 13,955 1.1 × 10⁻⁵ 52 268 AUSC 9502 1.6 × 10⁻⁵ 74 128 13,475 1.1 × 10⁻⁵ 49 275 HOLF 10,124 1.4 × 10⁻⁵ 22 460 11,033 1.3 × 10⁻⁵ 35 315 MON 3971 3.6 × 10⁻⁵ 13 305 5383 2.7 × 10⁻⁵ 19 283 NOR 2981 4.7 × 10⁻⁵ 11 271 3379 4.1 × 10⁻⁵ 16 211 NR 4304 3.0 × 10⁻⁵ 30 143 6231 2.1 × 10⁻⁵ 37 168 HOLG 9244 1.6 × 10⁻⁵ 20 462 10,102 1.5 × 10⁻⁵ 38 266 BRAU 2483 6.4 × 10⁻⁵ 13 191 2117 7.5 × 10⁻⁵ 9 235 FLCK 9492 1.8 × 10⁻⁵ 20 475 5654 3.0 × 10⁻⁵ 33 171 GWAS 31,559 – 124 255 42,518 – 104 409 META 27,820 9.2 × 10⁻⁶ 138 202 44,095 5.8 × 10⁻⁶ 176 251
Minor allele frequency
The sequence variants were enriched for low-fre-quency MAF classes. However, variants that were significant in the meta-analyses were only slightly enriched for low MAF classes (Fig. 3). For example, 46% of all variants had a MAF between 0.1 and 0.5, whereas this was the case for 72% of the significant variants detected for fat percentage, and 75% of the significant variants detected for protein percentage. A similar pattern was found when comparing the allele frequencies of significant and all variants within a population (see Additional file 5: Figure S3 and Addi-tional file 6: Figure S4). Especially in the Holstein pop-ulations, most of the significant QTL had moderate to large MAF.
Functional annotations
Significant variants in the meta-analysis were more often located in or near genes than all variants (Table 4). Nearly two-thirds (65.85%) of all variants tested were intergenic. For the significant variants, the percentage of intergenic variants was substantially lower, i.e. ~ 50%. All other annotation classes were more frequent for significant than for all variants. For example, the percentage of splice variants was more than twice as high for significant than for all variants (0.14 vs. 0.06%).
eQTL
Table 5 shows the overlap between eQTL and signifi-cant variants in the meta-analysis. When blood cells were used in the eQTL analysis, 0.61% of all variants present in both the meta-analysis and eQTL study were eQTL. There were relatively more eQTL detected in the
Fig. 3 Distribution of minor allele frequencies (MAF) of all variants and significant variants. Significant variants had a p‑value ≤ 10−8 in the meta‑analysis
within-population GWAS, with 2.30% of QTL detected for fat percentage, and 3.89% of QTL detected for pro-tein percentage. The percentage of significant variants that were eQTL was higher for the meta-analysis than the GWAS, with 3.38% of variants with a p-value lower than 10−8 in the meta-analysis for fat percentage, and 4.60%
for protein percentage. The number of eQTL detected using cells collected from milk samples was much lower than that obtained by using blood cells, and only a few (between 0.01% and 0.04%) were among the variants detected in either the GWAS or meta-analysis. All over-laps between eQTL and significant variants were larger than expected by chance. For example, there were 22,152 variants with a p-value ≤ 10−8 in the meta-analysis for fat
yield, of which nine were eQTL detected from cells col-lected from milk samples. By chance, the expected num-ber would be only 22,152 × 10−6 = 0.02 eQTL.
Correlations between within‑population GWAS
When all variants were used, the effects estimated in the within-populations GWAS were only weakly correlated between populations (see Additional file 7: Tables S3 and
S4). Correlations were stronger between GWAS of the same breed. For example, the correlation for effects esti-mated for protein percentage was 0.15 between HOLF and HOLG, and 0.25 between AUSB and AUSC. Between different breeds, correlations were close to zero. Much higher correlations were observed for significant variants. For example, for fat percentage, the correlation between MON and NOR was 0.03 for all variants, whereas the effects of significant variants had a correlation of 0.72. Direction of effect
For both fat and protein percentage, significant variants had the same direction of effect in more GWAS than all variants (Fig. 4). For fat percentage, 14, 19, 41 and 26% of significant variants had the same direction of effect in less than four GWAS, four or five GWAS, six or seven GWAS or eight or nine GWAS, respectively, substantially more than the 37, 38, 22 and 2% of all variants. A similar pattern was observed for protein percentage.
The majority of QTL had the same direction of effect in all within-population GWAS that detected them. Of the 138 and 176 lead variants for the QTL detected for fat Table 4 Percentage of variants in functional classes of annotation
p_fat % ≤ 10−8 and p_prot % ≤ 10−8 = variants with a p-value ≤ 10−8 in the meta-analysis for fat and protein percentage, respectively
Annotation All variants p_fat % ≤ 10−8 p_prot % ≤ 10−8
Intergenic 65.85 51.45 50.07 Intron 26.54 35.12 35.84 Upstream_gene 3.49 5.91 5.89 Downstream_gene 3.04 4.24 4.83 Synonymous 0.36 0.99 0.91 Missense 0.32 0.54 0.54 3_prime_UTR 0.22 0.32 0.44 Splice_region 0.06 0.14 0.14 5_prime_UTR 0.05 0.12 0.11 Non_coding_transcript_exon 0.03 0.15 0.12 Other 0.02 0.01 0.02 Not annotated 0.02 1.01 1.09
Table 5 Overlap between eQTL and significant variants
All: all variants present in both meta-analysis and eQTL study; pgwas_fat % ≤ 10−8, pgwas_prot % ≤ 10−8, pmeta_fat % ≤ 10−8 and pmeta_prot % ≤ 10−8: variants with a p-value ≤ 10−8 in at least one of the within population GWAS and meta-analysis for fat and protein percentage, respectively; total: total number of variants in a set of variants, eQTL: number of variants in a set that were eQTL, %: eQTL total*100%
Set Cells collected from milk samples Blood cells
Total eQTL % Total eQTL %
All 9,191,239 6678 0.07 8,587,100 52,802 0.61
pgwas_fat % ≤ 10−8 22,152 9 0.04 20,702 476 2.30
pmeta_fat % ≤ 10−8 20,087 3 0.01 18,735 633 3.38
pgwas_prot % ≤ 10−8 28,967 5 0.02 27,781 1081 3.89
and protein percentage, respectively 100 and 114 had the same direction of effect in all GWAS in which they were included. Only two variants had significant effects in opposite directions in two populations. Inconsistencies in direction of effect between within-population GWAS that contained Holstein individuals (AUSB, AUSC, HOLF and HOLG) were only observed for four QTL that were detected for fat percentage and two for protein percent-age. One of these QTL was a highly significant QTL for both traits, and located at 93,945,991 bp on chromosome 5, in the MGST1 gene. This QTL had a positive effect on both traits in all GWAS except that for HOLF.
FST
While significant common variants (MAF 0.10–0.50) had slightly larger FST values than all common
vari-ants (Figs. 5 and 6), the opposite was observed for rare variants (MAF 0.002–0.01). Significant rare variants had lower FST values compared to all rare variants. For
vari-ants with a MAF between 0.01 and 0.05, no clear dif-ference in FST values was observed between significant
variants and all variants. DAVID analysis
The DAVID functional annotation tool clustered 80 of 391 genes associated with fat percentage in the meta-analysis and present in the databases used by DAVID in 28 clusters. The enrichment scores of the annotation
clusters ranged from 1.98 for the top cluster, to 0.03 for the bottom cluster. Figure 7 shows the fold enrichment and significance (p-value after Benjamini–Hochberg cor-rection for multiple testing [29]) of the keywords in the top three clusters. More details on the clusters are in Additional file 8: Table S5 and Additional file 9: Table S6. The only significant (p ≤ 0.05) keyword associated with fat percentage was the UP_KEYWORD “lipid biosynthe-sis” in annotation cluster 2, with a p-value of 0.02. The genes associated with this keyword were MECR, FDPS, PMVK, ST8SIA1, PTDSS1, HSD17B12, PCYT2, FASN, SCD and GPAT4.
Of the 761 genes associated with protein percentage and present in the database used by DAVID, 118 were clustered in 38 clusters with enrichment scores rang-ing from 5.18 to 0. The first cluster includes several sol-ute carrier (SLC) genes, significantly (p-value ≤ 0.05 after Benjamini–Hochberg correction for multiple test-ing [29]) associated with GOTERM “inorganic anion exchanger activity”. The second cluster contained several genes that are significantly associated with GOTERM_ MF_DIRECT “glucuronosyltransferase activity”, GOTERM_BP_DIRECT “flavonoid biosynthetic process” and “flavonoid glucuronidation” and KEGG_PATHWAYs “pentose and glucuronate interconversions” and “ascor-bate and aldarate metabolism”. The third cluster con-tained several genes that encode milk proteins, including LALBA on chromosome 5, and CSN2, CSN1S2, CSN1S1
Fig. 4 Distribution of the proportion of GWAS with the same direction of effect. From left to right: all variants (all variants), variants with p ≤ 10−8 in the meta‑analysis (p ≤ 10−8), variants included in all GWAS (variants in all GWAS), and variants included in all GWAS and p ≤ 10−8 in the meta‑analysis (p ≤ 10−8 & in all GWAS). Top = fat percentage (fat %), bottom = protein percentage (prot %)
and CSN3 on chromosome 6, and are significantly asso-ciated with GOTERM_BP_DIRECT “response to oestra-diol”, “response to 11-deoxycorticosterone” and “response to “dehydroepiandrosterone” and UP_KEYWORD “milk protein”.
Discussion
Our meta-analyses detected more QTL with fewer sig-nificant variants per QTL and at lower FDR than the within-population GWAS, which suggests that across-population meta-analysis of summary statistics both increases power and mapping precision compared to within-population GWAS. A multi breed meta-analysis can increase both power and precision because on the one hand, the sample size and thus power increase, and on the other hand, including data from multiple breeds breaks down LD, which can reduce the number of vari-ants associated with a QTL and thereby increase mapping
precision [6]. The number of QTL detected in our meta-analysis was substantially larger than that detected by Pausch et al. [7], while similar detection criteria were used, which indicates that the more than five-fold larger sample in our study enabled us to detect more QTL.
By setting a distance of at least 1 Mb between adjacent QTL, our aim was to reduce the number of detected QTL that were associated with the same true QTL. However, LD may be conserved over more than 1 Mb, and conse-quently, very significant QTL such as DGAT1 on chro-mosome 14 can have variants that are associated with them over a longer distance. Therefore, we performed a COJO analysis to test how many of the detected QTL were independent of each other. Because we were not able to combine the original datasets used for the meta-analysis, we used an alternative dataset that contained sequences representing most of the populations included in the meta-analysis to estimate the LD structure in the
Fig. 5 FST of all sequence variants and significant variants for fat percentage. Empirical cumulative distribution (ECDF) of FST values of all variants (black) and significant variants (red), for variants with a minor allele frequency between 0.002 and 0.01 (top left), 0.01 and 0.05 (top right), 0.05 and 0.10 (bottom left), and 0.10 and 0.50 (bottom right)
COJO analysis. While the small size of this dataset may have reduced the accuracy of the COJO analysis, this dataset was more representative of the LD structure across the populations used in the meta-analysis than a larger within-population dataset. The COJO analysis reduced the number of QTL, which indicates that the numbers of QTL reported are inflated. The number of independent QTL retained by COJO (74 for fat percent-age and 84 for protein percentpercent-age) remained more than double the number of QTL detected by Pausch et al. [7].
Not all of the QTL detected in the within-population GWAS were detected in the meta-analysis. Because of the smaller data size of the within-population GWAS, the number of false positives detected by the within-popula-tion GWAS may be larger than in the meta-analysis, and some of the QTL detected within-population but not in the meta-analysis may be false positives. However, there can be several reasons why a true QTL is significant in a
within-population GWAS but not significant in a meta-analysis. One reason could be that a SNP is significantly associated with a trait in one population because it is in LD with the causal variant in that population. However, the LD between this SNP and the causal variant might differ in other populations and thus results in a weakened association between SNP and trait. Ideally, the causal var-iant would be detected as the most significant local vari-ant, but this does not always occur due to sampling error and, in some cases, the causal variant is not included in the data, at least not for all populations. Furthermore, a variant in high LD with the causal variant could be more significant than the causal variant if it has a higher impu-tation accuracy than the causal variant. Another rea-son why a QTL may be detected in a within-population GWAS but not in the meta-analysis could be that mul-tiple causal variants with opposing effects are present in the same region. Different breeds may have different
Fig. 6 FST of all sequence variants and significant variants for protein percentage. Empirical cumulative distribution (ECDF) of FST values of all variants (black) and significant variants (red), for variants with a minor allele frequency between 0.002 and 0.01 (top left), 0.01 and 0.05 (top right), 0.05 and 0.10 (bottom left), and 0.10 and 0.50 (bottom right)
causal mutations segregating in the same region, which can reduce significance in the meta-analysis. Epistasis may be another factor why a within-breed QTL is not detected in the meta-analysis, since it can cause some QTL to have opposing effects in different breeds [30]. We suggest that this reversal of effect of causal variants is rare because we only observed two variants with an effect that was significant in two populations but opposite in sign.
To validate the QTL that were detected in the meta-analysis, we performed a validation meta-analysis. All QTL detected for protein percentage and 87% of the QTL detected for fat percentage had the same direction of effect in the validation as in the original meta-analy-sis, whereas by chance alone, only 50% would have the same direction. Most QTL were not significant in the validation meta-analysis, which is not surprising, given the much smaller size of the validation dataset and the fact that it included only cows, which have a less accu-rate “phenotype” than bulls. This is also consistent with our previous observation, i.e. that the comparison of the directions of variant effects across GWAS results is more powerful than the comparison of p-values across GWAS
[12]. As previously stated, different LD structures in dif-ferent GWAS populations can lead to difdif-ferent selections of top variants using the same p-value threshold. Nev-ertheless, we still found that more than 12% of the QTL detected for fat and protein percentage from the discov-ery analysis were significant in the validation analysis. This amount of overlap is more than that expected by chance.
Comparison with known QTL and causal mutations
We detected QTL that encompass genes that are well known for their effect on production traits in dairy cat-tle, such as MGST1 on chromosome 5 [31], ABCG2 on chromosome 6 [32], PAEP on chromosome 11 [33], DGAT1 on chromosome 14 [34], and GHR on chromo-some 20 [35]. For a few of these QTL, the underlying causal mutations are known. While we detected QTL near the causal variants, the most significant variant in our study was not always the causal variant. For example, the causal variant for DGAT1 [34] is located at 1,802,265-1,802,266 bp on chromosome 14. In the meta-analysis, the variant at 1,802,266 bp was highly significant with a p-value of 1.3 × 10−996 for fat percentage. However, it
was not the most significant variant in the meta-analysis, most likely because it was filtered out from the HOLG data because of low imputation accuracy. Similarly, for the QTL located near ABCG2 on chromosome 6, the most significant variant with a p-value of 3.4 × 10−106
for protein percentage was located at 38,031,954 bp and was more significant than the causal variant [32] at 38,027,010 bp (p = 5.6 × 10−92) because the causal variant
was not included in the AUSB dataset. These examples demonstrate that the most significant variant in GWAS or meta-analysis is not necessarily the known causal vari-ant. In contrast, the causal variant for GHR [35] was the most significant variant in the meta-analysis for both fat and protein percentage. While the absence of the causal variant in some GWAS may explain why another variant is more significant in the meta-analysis than the causal variant, it is also possible that there are multiple causal variants present in the same region. However, LD of a segregating variant with multiple causal variants can result in the highest significance.
Jiang et al. [36] reported a GWAS on USA Holstein cattle based on sequence variants in or near genes. Our meta-analysis detected a QTL within 1 Mb of the can-didate variants reported for the 12 QTL detected for fat percentage and 23 QTL detected for protein percentage in US Holstein bulls by Jiang et al. [36]. The lead variant was the same for eight of these QTL (for fat percentage: 93,945,738 bp on chromosome 5 and 38,027,010 bp on chromosome 6, and for protein percentage: 31,349,638 bp on chromosome 5, 38,027,010 bp and 87,154,594 bp 0 1 2 3 4 5 6 0 1 2 3 4 5 -log10(p ) logFE protein percentage cluster 1, significant cluster 2, significant cluster 2, not significant cluster 3, significant cluster 3, not significant
inorganic anion exchanger activity
glucuronosyltransferase activity response to estradiol 0 0.5 1 1.5 2 0 2 4 6 -log10(p) logFE fat percentage cluster 1, non-significant cluster 2, significant cluster 2, non significant cluster 3, non significant
lipid biosynthesis
Fig. 7 Fold enrichment and significance of keywords in DAVID
clusters for fat and protein percentage. Log fold enrichment (logFE) and −log10 p‑value after Benjamini–Hochberg correction for multiple testing (−log10(p)) for keywords in the top three clustered detected in DAVID analysis. For cluster, the keyword the top significant variant is annotated on the graph
on chromosome 6, 1,801,116 on chromosome 14 and 9,563,396 on chromosome 29). Almost all the candidate variants listed by Jiang et al. [36] were significant in the meta-analysis. Exceptions were one QTL for fat percent-age located at 74,829,183 bp on chromosome 15, that had a p-value of 1.5 × 10⁻⁵ in the meta-analysis, and three
QTL for protein percentage located on chromosome 1, 14 and 21 that had p-values of 6.6 × 10⁻⁸, 3.8 × 10⁻⁷ and
2.7 × 10⁻⁸, respectively, in the meta-analysis. Because
Jiang et al. [36] preselected sequence variants and, in that process, excluded intronic and intergenic variants, the majority of the QTL detected in the meta-analysis were not included in their study. Their GWAS did con-tain multiple variants within 1 Mb of each of our QTL, and there was at least one variant with a p-value ≤ 10−8 in
the GWAS by Jiang et al. [36] for 27 of the QTL detected in the meta-analysis for fat percentage and 59 for protein percentage. For 21 of the QTL detected for fat percentage and 50 of the QTL for protein percentage, the top variant in the meta-analysis was included in the GWAS of Jiang et al. [36]. Among these, eight QTL for fat percentage and 10 QTL for protein percentage were significant in their study. In the GWAS of Jiang et al. [36], the lack of signifi-cance of most of the QTL detected in the meta-analysis may be attributed to the larger sample size and inclu-sion of multiple breeds in our analysis. In another study, Marete et al. [9] reported QTL detected for fat and pro-tein percentage in a large meta-analysis using data from French Holstein, Montbéliarde and Normande cattle. The overlap with QTL detected by Marete et al. [9] and our meta-analysis was smaller than that with Jiang et al. [36], with only 20 of 48 and 6 of 29 QTL detected by for fat yield and percentage and protein yield and percentage, respectively. While the SNP genotypes used by Marete et al. [9] contained several candidate causal mutations, it was not a sequence-based GWAS, which may explain the small overlap between their results and this study. The dataset used in the meta-analysis by Pausch et al. [7] was used in our analyses, and all QTL detected by Pausch et al. [7] were confirmed in our analyses, except one QTL detected for protein percentage at 56,528,040 bp on chromosome 4, that had a p-value of 2.3 × 10⁻⁷ in our
meta-analysis. Minor allele frequency
While, in agreement with previous studies in cattle [37], sequence variants were enriched for low-frequency MAF classes, the majority of QTL that we detected had mod-erate to high MAF. This is in line with Pausch et al. [7], who detected only few QTL with a MAF lower than 0.05. The lack of rare QTL does not mean that most QTL in dairy cattle are common variants, but more likely it indi-cates that, in spite of the large sample size, our study had
a relatively low statistical power to detect QTL with low MAF and a lower imputation accuracy for low MAF QTL than for more common QTL.
If the effect of a QTL is independent of the MAF (p), then the power to detect the QTL is proportional to p(1−p). However, the number of variants with MAF = p is proportional to 1/[p(1−p)]. Thus, one might expect the number of significant variants to be independent of MAF. Alternatively, if the variance explained by a QTL is independent of MAF, the number of significant variants should increase sharply at low MAF just as the number of all variants does. In fact, our results are in between these two alternatives, which suggests that the size of the effect of QTL increases as MAF declines but not sufficiently to prevent the explained variance (and the power to detect) from decreasing. This is the same conclusion as Zeng et al. [38].
The meta-analysis appeared to favour variants with a high MAF in Holstein (see Additional file 5: Figure S3 and Additional file 6: Figure S4), which was the breed ori-gin of most of the animals included in the meta-analysis. Using the same MAF threshold in the meta-analysis and the within-population GWAS may have influenced the number of QTL detected in each analysis. The applied MAF filter corresponds with a minor allele count (MAC) of 377 for the meta-analysis, but to a much lower MAC within-population (between 6.5 and 129). This has likely contributed to the smaller number of QTL detected in the within-population GWAS and illustrates the advan-tage of a meta-analysis over within-population GWAS. FST
We observed slightly higher FST values for significant
common variants compared to all variants, but lower FST
values for significant rare variants. Pausch et al. [7] also observed higher FST values for QTL than for non-QTL.
The slightly higher FST values for significant variants
compared to all variants may indicate different selection pressures in different breeds. For instance, mutations that increase fat percentage by decreasing milk volume might be selected for in some breeds, but selected against in other breeds. While selection on milk composition has been much more limited than on milk yield, a correlated response is still expected due to the correlation between milk yield and composition. In our study, high FST values
at some variants may indicate differences in selection pressure between the breeds. Kemper et al. [39] found no convincing evidence of selection for several major QTL detected for production traits in dairy cattle, and Xiang et al. [40] showed only a small contribution of variants under selection to various quantitative traits in dairy cat-tle. Further research is required to identify potential links between FST value, allele frequency and significance.
Functional annotations
The proportion of genic variants, located in a gene or in the upstream or downstream region of a gene, was higher among the significant variants of the meta-analysis than among all variants. This is in agreement with the deple-tion of intergenic effects and enrichment of genic classes for variants associated with various traits in dairy cattle reported in other studies [41, 42]. Interestingly, a large part of the variants with significant effects was located in non-coding regions that may have a regulatory function, such as intronic, upstream and downstream regions.
The DAVID analysis identified several clusters enriched for certain functional annotations. Some of the clusters could be described as milk protein genes (e.g. LALBA), or anion exchanges and solute carrier genes (e.g. SLC). Whereas some of the genes in these classes, LALBA [43] on chromosome 5 and the casein genes on chromosome 6 [44] are genes known to be associated with major QTL in dairy cattle, other genes were not and these clusters may provide novel candidate genes for milk and fat per-centage. For example, the second cluster for fat percent-age contained 10 genes associated with lipid biosynthesis: MECR on chromosome 2, FDPS and PMVK on chromo-some 3, ST8SIA1 on chromochromo-some 5, PTDSS1 on chro-mosome 14, HSD17B12 on chrochro-mosome 15, PCYT2 and FASN on chromosome 19, SCD on chromosome 26 and GPAT4 on chromosome 27. Some of these genes, includ-ing MECR [45], FASN [46], SCD [47] and GPAT4 [48], have previously been identified as candidate genes for milk traits in dairy cattle.
Our data and analysis were based on the previous UMD3.1 bovine reference genome because the more recent ARS-UCD1.2 reference was not available at the time the within-population GWAS were performed. The same meta-analysis, carried out using the ARS-UCD1.2 reference, may lead to a better targeting of causative mutations [49]. Except for one top variant associated with a QTL detected for protein percentage, all top QTL variants were present on the ARS-UCD1.2 reference. Overlap between significant variants and eQTL
The depletion or enrichment of significant variants for eQTL was not consistent across tissues. While signifi-cant variants were enriched for eQTL when blood cells were used to detect eQTL, using cells collected from milk samples resulted in significant variants being depleted for eQTL. This is in line with the eQTL study, in which the power to detect significant variants was higher using blood cells than using cells collected from milk sam-ples [23]. Interestingly, whereas the original eQTL study found only little overlap between eQTL and QTL, even with blood cells, we found some enrichment of QTL for blood eQTL, which is potentially due to the higher
power of the meta-analysis compared to the data used in the original study [21]. Other studies have shown some evidence of overlap between QTL and eQTL. Littlejohn et al. [31] used mammary tissue to detect an eQTL at the MGST1 gene that is also a well-known QTL for milk traits in dairy cattle, and Xiang et al. [25] showed overlap between eQTL and QTL for several traits in dairy cattle in milk and blood cells.
Conclusions
Our study identified a large number of QTL that are associated with fat and protein percentage in dairy cattle. We confirmed the efficiency of a large-scale multi-breed meta-analysis and studied the properties of significant variants compared to all variants. Significant variants are more often common variants, which indicates that either most QTL have a high MAF, or that even with the large sample size used in our study, we still have insufficient power to identify and fine map rare QTL. The percent-age of intergenic variants was substantially lower for significant variants than for non-significant variants. A large part of the significant variants was located in non-coding, potentially regulatory regions. In some cases, the genes near the QTL shared a common function such as genes involved in lipid synthesis affecting fat percentage. Except for rare variants, significant variants tend to have higher FST than all variants.
Supplementary information
Supplementary information accompanies this paper at https ://doi. org/10.1186/s1271 1‑020‑00556 ‑4.
Additional file 1: Figure S1. Manhattan plots of within‑population GWAS
for fat and protein percentage. The red line indicates p = 10−8.
Additional file 2: Table S1. QTL detected for fat percentage in the
meta‑analysis. chr = chromosome, pos = position in base pair on UMD3.1 assembly, ARS‑UCD2.1 = position in base pair on ASR‑UCD2.1 assembly, p = p‑value in the meta‑analysis, dir = direction of effect in each of the GWAS (from left to right: Braunvieh, Fleckvieh, German Holstein, Norwe‑ gian Red, Australian bull dataset, Australian cow dataset, Montbéliarde, Normande, French Holstein), start = pos – 250 kb, end = pos + 250 kb, nSig = number of variants with a p‑value ≤ 10−8 in the interval,
nGenic = nSig associated with a gene, genes = genes in the interval with significant variants, cojo = p‑value in COJO analysis for retained variants, or discarded/not present to indicate variants that were discarded or not included in COJO analysis), sameDirVal = indicates whether a variant had the same direction of Z‑score in the meta‑analysis and the validation analysis (‑ = not included in validation analysis, 0 = opposite direction, 1 = same direction), pVal = p‑value in the validation analysis.
Additional file 3: Table S2. QTL detected for protein percentage in the
meta‑analysis. chr = chromosome, pos = position in base pair on UMD3.1 assembly, ARS‑UCD2.1 = position in base pair on ASR‑UCD2.1 assembly, p = p‑value in the meta‑analysis, dir = direction of effect in each of the GWAS (from left to right: Braunvieh, Fleckvieh, German Holstein, Norwe‑ gian Red, Australian bull dataset, Australian cow dataset, Montbéliarde, Normande, French Holstein), start = pos – 250 Kb, end = pos + 250 Kb, nSig = number of variants with a p‑value ≤ 10−8 in the interval,
nGenic = nSig associated with a gene, genes = genes in the interval with significant variants, cojo = p‑value in COJO analysis for retained variants,
or discarded/not present to indicate variants that were discarded or not included in COJO analysis), sameDirVal = indicates whether a variant had the same direction of Z‑score in the meta‑analysis and the validation analysis (‑ = not included in validation analysis, 0 = opposite direction, 1 = same direction), pVal = p‑value in the validation analysis.
Additional file 4: Figure S2. QTL detected on chromosome 25. Associa‑
tion of variants around 36 Mb on chromosome 25 with protein percent‑ age in the meta‑analysis (top) and GWAS for Norwegian Red (bottom).
Additional file 5: Figure S3. Distribution of within‑population minor
allele frequencies (MAF) of all variants and significant variants. Significant variants had a p‑value ≤ 10−8 in the meta‑analysis.
Additional file 6: Figure S4. Distribution of minor allele frequencies
within‑population (MAF) of all variants and significant variants. Significant variants had a p‑value ≤ 10−8 in the meta‑analysis.
Additional file 7: Table S3 and Table S4. Correlations between effects
estimated in within population GWAS. Tables S3 and S4 show the results for fat percentage and protein percentage, respectively; above the diagonal = all variants, below the diagonal = significant variants (p ≤ 10−8). AUSB = Australian bull dataset, AUSC = Australian cow dataset,
HOLF = French Holstein, MON = Montbéliarde, NOR = Normande, NR = Norwegian Red, HOLG = German Holstein, BRAU = Braunvieh, FLCK = Fleckvieh.
Additional file 8: Table S5. DAVID analysis for fat percentage. Three clus‑
ters with the highest enrichment scores according to DAVID functional annotation clustering for genes associated with significant variants in the meta‑analysis for fat percentage.
Additional file 9: Table S6. DAVID analysis for protein percentage. Three
clusters with the highest enrichment scores according to DAVID func‑ tional annotation clustering for genes associated with significant variants in the meta‑analysis for protein percentage.
Acknowledgements
IB was supported by DairyBio, which is a co‑investment of Dairy Australia, Gardiner and Agriculture Victoria. Australian Research Council’s Discovery Pro‑ jects (DP160101056) supported RX and MEG. Dairy Futures CRC and DairyBio supported the generation of the transcriptome data of blood cells and cells collected from milk samples. DataGene (https ://datag ene.com.au/) and CRV (www.crv4a ll‑inter natio nal.com/) provided access to the Australian data used in this study, and we thank Gert Nieuwhof, Kon Konstantinov and Timothy P. Hancock (DataGene) for preparation and provision of the data, Dr. Mekonnen Haile‑Mariam for deriving the deregressed phenotypes from international MACE and Dr. Sunduimijid Bolormaa for sequence variant data imputation. HP acknowledges the Arbeitsgemeinschaft Süddeutscher Rinderzüchter und Besamungsorganisationen e.V. (ASR), Arbeitsgemeinschaft österreichischer Fleckviehzüchter (AGÖF), Förderverein Bioökonomieforschung e.V. (FBF), Ger‑ man Holstein Association (DHV), Confederación de Asociaciones de Frisona Española (CONAFE), ZuchtData EDV Dienstleistungen GmbH, Vereinigte Informationssysteme Tierhaltung (vit) w.V. Verden, Braunvieh Schweiz and QualitasAG for providing genotype and phenotype data. DB acknowledges the French National Data Base (CTIG) for providing phenotype data and APIS‑GENE, National Research Agency (ANR‑05‑GENANIMAL‑007 grant), and Valogene for genotype data. The French validation datasets originated from the PhénoFinlait project funded by ANR (ANR‑08‑GANI‑034) and APIS‑GENE. Sequencing of Norwegian Red bulls was supported by the Research Council of Norway through the project “From whole genome sequence to preci‑ sion breeding” (NFR no. 255297/E50). We thank partners from the 1000 bulls genomes project for the data access. We acknowledge Dr Paul Stothard and the team at the University of Alberta for collating annotation information of sequence variants used in this study.
Authors’ contributions
IB carried out the meta‑analysis, wrote the manuscript and participated in the design of the study. RX, JJ, HP, MPS, TT, ABG, DB, ØN, and MB carried out the GWAS. CS prepared CRV bull genotypes. MEG designed the study. All authors read and approved the final manuscript.
Funding
Not applicable.
Availability of data
The data used for this research is not publicly available.
Ethics approval and consent to participate
No ethics approval was obtained for this study because no new animals were handled in this experiment.
Consent for publication
Not applicable.
Competing interests
The authors declare that they have no competing interests.
Author details
1 Agriculture Victoria Research, AgriBio, 5 Ring Road, Bundoora, VIC 3083, Aus‑
tralia. 2 Faculty of Veterinary & Agricultural Science, University of Melbourne,
Parkville, VIC 3010, Australia. 3 GENO SA, Storhamargata 44, 2317 Hamar,
Norway. 4 Animal Genomics, ETH Zurich, Zurich, Switzerland. 5 Université Paris‑
Saclay, INRAE, AgroParisTech, GABI, 78350 Jouy‑en‑Josas, France. 6 CRV, PO
Box 454, 6800 AL Arnhem, The Netherlands. Received: 1 December 2019 Accepted: 26 June 2020
References
1. van den Berg I, Boichard D, Guldbrandtsen B, Lund MS. Using sequence variants in linkage disequilibrium with causative mutations to improve across‑breed prediction in dairy cattle: a simulation study. G3 (Bethesda). 2016;6:2553–61.
2. van den Berg I, Boichard D, Lund MS. Sequence variants selected from a multi‑breed GWAS can improve the reliability of genomic predictions in dairy cattle. Genet Sel Evol. 2016;48:83.
3. Begum F, Ghosh D, Tseng GC, Feingold E. Comprehensive literature review and statistical considerations for GWAS meta‑analysis. Nucleic Acids Res. 2012;40:3777–84.
4. Evangelou E, Ioannidis JP. Meta‑analysis methods for genome‑wide association studies and beyond. Nat Rev Genet. 2013;14:379–89. 5. Bouwman AC, Daetwyler HD, Chamberlain AJ, Ponce CH, Sargolzaei M,
Schenkel FS, et al. Meta‑analysis of genome‑wide association studies for cattle stature identifies common genes that regulate body size in mam‑ mals. Nat Genet. 2018;50:362–7.
6. van den Berg I, Boichard D, Lund MS. Comparing power and precision of within‑breed and multibreed genome‑wide association studies of production traits using whole‑genome sequence data for 5 French and Danish dairy cattle breeds. J Dairy Sci. 2016;99:8932–45.
7. Pausch H, Emmerling R, Gredler‑Grandl B, Fries R, Daetwyler HD, Goddard ME. Meta‑analysis of sequence‑based association studies across three cattle breeds reveals 25 QTL for fat and protein percentages in milk at nucleotide resolution. BMC Genomics. 2017;18:853.
8. Teissier M, Sanchez MP, Boussaha M, Barbat A, Hoze C, Robert‑Granie C, et al. Use of meta‑analyses and joint analyses to select variants in whole genome sequences for genomic evaluation: an application in milk pro‑ duction of French dairy cattle breeds. J Dairy Sci. 2018;101:3126–39. 9. Marete AG, Guldbrandtsen B, Lund MS, Fritz S, Sahana G, Boichard D.
A meta‑analysis including pre‑selected sequence variants associated with seven traits in three French dairy cattle populations. Front Genet. 2018;9:522.
10. de Roos APW, Hayes BJ, Spelman RJ, Goddard ME. Linkage disequilibrium and persistence of phase in Holstein‑Friesian. Jersey and Angus cattle. Genetics. 2008;179:1503–12.
11. Ekine CC, Rowe SJ, Bishop SC, de Koning D‑J. Why breeding values estimated using familial data should not be used for genome‑wide association studies. G3. 2014;4:341–7.
12. Xiang R, van den Berg I, MacLeod IM, Daetwyler HD, Goddard ME. Effect direction meta‑analysis of GWAS identifies extreme, prevalent and shared pleiotropy in a large mammal. Commun Biol. 2020;3:88.