How much can bulk stores help reduce carbon
footprint by limiting plastic food packaging?
Bachelor Project submitted for the degree of
Bachelor of Science HES in International Business Management by
Anaïs JAREL RODRIGUEZ
Bachelor Project Mentor:
Emmanuel MILET
Geneva, 3rd of June 2020
Haute école de gestion de Genève (HEG-GE) International Business Management
Disclaimer
This report is submitted as part of the final examination requirements of the Haute école de gestion de Genève, for the Bachelor of Science HES-SO in International Business Management. The use of any conclusions or recommendations made in or based upon this report, with no prejudice to their value, engages the responsibility neither of the author, nor the author’s mentor, nor the jury members nor the HEG or any of its employees.
Acknowledgements
I would like to thank my advisor, Dr. Emmanuel Milet, lecturer at the Institute of Economics and Econometrics of the University of Geneva for his guidance and availability. His sound and constructive advice strongly contributed to the reflection of this document.
Special thanks should also be given to:
Mrs. Huong Biedermann for transmitting essential information to the development of this thesis.
Mrs. Megan Bonfils for answering my questions about the practices of Zero waste and bulk stores, as well as sharing her personal experience.
Mrs. Caroline Roxana Rohrbach and Mr. Alexandre Simon Perdrizat for having reviewed and corrected my dissertation. Their editorial advice was invaluable and their help in the data collection was much appreciated.
The realization of this subject could not have been accomplished without the contribution of all the participants who answered the surveys and to whom I would like to express my gratefulness.
Finally, I wish to thank my dear family and closest relatives for their support and constant encouragements during my studies.
Executive Summary
This report focuses on the quantity of food packaging waste consumed by an average single individual, residing in Switzerland. It is based on the household budget survey published by the Federal Statistical Office (FSO). This budget survey mentions the food quantities monthly consumed by a single individual and thus, the packaging waste could be computed accordingly. The objective is to compare the packaging waste of an individual grocery shopping in supermarkets with a person going to bulk stores. It aims to show the quantity of packaging reduction by bulk-buying, hence the monthly waste reduction.
The main materials used for food packaging are plastic, glass, metal and cardboard. Due to its durability and popularity, this study also measured the carbon footprint emitted by plastic packaging for a single individual.
Three analyses have been made. The first estimates that an average individual consumed 2.7 kg of packaging monthly, of which more than a half is plastic. This quantity of plastic yearly emits 105 kg of CO2 emissions. The plastic packaging carbon footprint can be reduced by almost 60% by purchasing in bulk stores.
Even if purchasing in bulk stores decrease the amount of CO2 emissions, it implies changing customers habits. Hence, the second analysis compares the buying patterns of supermarkets’ customers and bulk stores’ clients. It reveals that most of the bulk stores customers are small households, while supermarkets customers are larger ones. In addition, there are costs for customers arising from changes, referred to as switching costs.
The third analysis estimates the two main switching costs to adopt more environmentally friendly approaches when grocery shopping. Firstly, the monetary costs show that supermarkets are 30% less expensive than bulk stores and offer wider products selection. Secondly, the time-based switching costs indicate that bulk stores’ customers spend weekly 50% more time in grocery shopping. In addition, bulk stores are present in only a few municipalities.
The final part of this report brings recommendations to decrease the customers’ switching costs. Several options are possible such as increasing the visibility and products’ variety of bulk stores.
Contents
How much can bulk stores reduce their environmental impact by cutting plastic
food packaging? ... 1
Disclaimer... i
Acknowledgements ... ii
Executive Summary ... iii
Contents ... iv List of Tables ... vi List of Figures ... vi 1. Introduction ... 1 2. Literature review ... 3 3. Methodology ... 5
3.1 Data collection and analysis ... 5
4. Findings ... 7
4.1 First analysis quantity of food packaging ... 7
4.1.1 In food stores... 8
4.1.2 In bulk-food stores ... 10
4.1.3 Comparison ... 10
4.1.4 Conclusion ... 12
4.2 Second analysis customers habits ... 12
4.2.1 Demographic ... 12
4.2.2 Purchasing habits ... 14
4.2.3 Knowledge of labels for sustainable food products ... 16
4.2.4 Knowledge of bulk stores... 18
4.2.5 Conclusion ... 19
4.3 Third analysis switching costs ... 20
4.3.1 Price differences ... 21 4.3.2 Time-based ... 23 4.3.3 Conclusion ... 25 5. Discussion ... 26 5.1 Challenges encountered ... 30 6. Conclusion ... 31 6.1 Recommendations ... 32 7. Bibliography ... 33 Appendix 1: Surveys... 37 1.1 Questions of survey 1 ... 37 1.2 Questions of survey 2 ... 39
Appendix 2: Food labels evaluation ... 41
3.1 Quantities of packaging, single individuals average ... 43
3.2 Quantities of packaging, ratio single individuals and couples with a child ... 45
3.3 Quantities of packaging, by single individuals supermarkets compared to bulk stores ... 46
Appendix 4: Food labels evaluation criteria ... 48
Appendix 5: Price comparison ... 49
Appendix 5.1: Price comparison organic vs organic ... 49
Appendix 5.2: Price comparison standard vs organic ... 52
Appendix 6: Variety products range ... 53
List of Tables
Table 1 - Packaging types ... 7
Table 2 - Packaging consumption for an average single individual ... 8
Table 3 - Beverages packaging consumption for an average single person ... 9
Table 4 - Packaging comparison Supermarkets vs Bulk stores ... 11
Table 5 - Number of meals cooked weekly per single person ... 14
Table 6 - Frequencies of food products purchase by specific customers ... 16
Table 7 - Price comparison Supermarkets vs Bulk stores ... 21
Table 8 - Number of food stores from the city centre ... 25
List of Figures
Figure 1 – Location of surveys participants ... 13
Figure 2 - Plastic packaging advantages from general customers... 15
Figure 3 - Level of labels' attentiveness ... 17
Figure 4 - Reasons for not going to bulk stores by general customers ... 18
Figure 5 - Average time spend in food stores... 23
1. Introduction
The mass production of plastics in the mid-20th century shaped the ‘Seventh continent’, which represents several areas where debris are accumulated in the oceans. Nowadays,
the Great Pacific Garbage Patch1, represents the largest accumulation of plastic in the
world. It is estimated to measure three times the size of France2 and is constituted of
over 1.8 billion plastic fragments (Cleanup, 2020). There are many different types of marine debris. Nevertheless, plastic is the most common due to its durability, abundance and does not biodegrade (National Geographic Society, 2020).
Every year nearly 8 million tons of plastic are released into the oceans, which according to the UNEP3, represent a garbage truck emptied in the ocean every minute (UNEP,
2018). Plastic debris have a severe impact on the environment notably due to the colorants and chemical products leach out from plastic particles. It threats marine wildlife, ecosystems, and consequently, human health. For this reason, this Bachelor thesis has an ecological focus.
The food industry has a strong environmental impact as it often combines challenges for the environment like deforestation, land use, air pollution, excess of water and energy consumption but also fertilizer (Benz, 2009). Carbon emission associated with farming, shipping, food processing and storage greatly contribute to the climate change (Benz, 2009). This document will focus its analysis on the packaging used when the finished food product is shipped to grocery stores. The packaging involves lots of materials and notably plastics which is an important source of carbon emissions (Benz, 2009).
The objective of this bachelor thesis is to measure the quantity of packaging waste consumed by an average person purchasing in supermarkets compared to bulk-buying. It aims to show the impact in terms of not buying over-packaged food items.
The analysis shows that bulk stores reduce by 72% the packaging waste consumed by an average single individual. However, it implies changing customers habits meaning costs of changes.
1 It is located between California and Hawaii 2 Or approximately 1.6 million km2
For this reason, this report also compares the buying patterns of retail stores’ customers with the clientele of bulk stores. Then, it estimates the switching costs for supermarkets’ customers to go grocery shopping in bulk stores.
In this document, the Literature review addresses the role of packaging into society and introduce bulk stores principles. Then, the Methodology describes the Data Collection and Analysis process. Data collection is the research and surveys that have been mandatory to perform to collect the information needed. Data Analysis is the extraction of the data collection to identify trends, average and make comparisons.
The Findings part is three analyses. Firstly, some products packaging from supermarkets have been weighted to obtain a ratio related to the food quantity versus the packaging used. The aim is to compare the food packaging waste production within supermarkets compared to bulk stores. The second analysis is two surveys used to collect consumer’s purchasing habits and to measure their level of awareness regarding sustainable purchasing. One survey has been communicated to customers who mostly do their grocery shopping in supermarkets while the other one has been sent to consumers of a bulk store in Geneva. Thanks to this information, a comparison between both types of customers have been made. The third analysis is the switching costs. Switching costs refer to costs incur by a consumer from substituting brands or products. It can be defined as the cost of changing consumers’ habits. The switching costs which are going to be considered are the following:
1. The monetary costs for customers to purchase in bulk stores compared to supermarkets. It relates to the price of identical food items found in both places. Also, it indicates the difference in products’ range.
2. The time-based switching costs focus on the average time to get to and spent within a bulk store or supermarket. Through mapping, the concentration of the different types of food stores in Geneva is illustrated.
In the Discussion section, the report compares the results of the findings related to the quantity of packaging waste consumed by an average individual. The objective is to understand the main barriers for customers to adopt more sustainable practices and to suggest recommendations.
The concluding part synthetizes the main points of this report. It summarizes the observations and recommendations based on the results previously obtained.
2. Literature review
In the coming years, the total quantity of packaging is expected to increase as in most European countries, the population is growing (Geijer, 2019). The primary role of food packaging is to contain foods as cost-effectively as possible to satisfy the industry requirements, consumers’ needs and ensure foods safety. It also provides nutritional information, cooking instruction, labelling and traceability. Packaging may serve other functions, such as extending the shelf-life of foods and transportation convenience. Finally, packaging plays a major role in marketing. It can boost sales by enhancing the product image (Marsh & Bugusu, 2007).
In the comparison of other packaging materials, plastic has a shorter useful life as it is generally disposed after one use (Geijer, 2019). In addition, plastic comes from fossil sources. In fact, the petrochemical industry, which ultimately makes plastic with the crude oil, accounts for 12% of global oil demand of which two thirds is used for plastic (Rühl, 2019).
In Europe, 8.2 million tons of plastic is used yearly for food and drink packaging. It represents the weight of more than 8 million cars (Geijer, 2019). The popular use of plastic, its limited recycling capacity, the fact that it comes from fossil raw material and does not biodegrade, contributes to this quantity of plastic consumed yearly.
In Switzerland, approximately 706 kg from municipal waste1 is generated per inhabitant
yearly with a recycling rate2 of 52% (Meyer-Vacherand, 2019). The quantity of municipal
waste per individual in the European Union is estimated at 487 kg of which 47% is recycled or composted, 28% incinerated and 24% landfilled (Eurostat, 2019). Thus, Switzerland produces 45% more municipal waste than the average European countries and recycles 5% more. Nevertheless, none of the municipal waste goes to the landfills, and all waste is either recycled or incinerated to produce energy. Recycling rules are specific to local municipalities and managed by the respective municipality departments (Simon, 2019).
However, a team of scientists from the University of Geneva has shown that a dangerous quantity of plastic waste with high toxin level was found in the Lake of Geneva. They estimated that around 50 tons of plastic end up in the Lake of Geneva yearly, of which 10 tons are from rubbish and packaging, representing the second main source of plastic
1 Municipal waste is the typical waste of a household, also called household waste. 2 The recycling rate is the proportional value of the waste recovery into reusable products
trash1 (SWI, 2018). The plastic deposited on the lake coasts is likely to pose the same
problems to wildlife as marine plastics (Turner, 2018).
The town of Carouge in Geneva has set itself the objective of reducing incinerated waste by 30% in 3 years (Carouge Zero Dechet, 2019). Carouge wants to become the first Swiss city with Zero Waste and supports the project of the Zero Waste Switzerland Association (ZeroWaste Switzerland, 2019). According to this association, 37% of all food sold in EU comes wrapped in plastic which makes it the most commonly used material for packaging. However, there are no statistics available regarding this matter in Switzerland (Sandmeier, 2018).
Several initiatives have already been agreed to tackle plastic pollution. For example, the EU Parliament approved a new law banning the single-use plastic items by 2021 and set new recycling targets for producers (Chatain, 2019). In Switzerland, the food store Migros decided to remove disposable plastic from its assortment by the end of 2020. In 2018, Migros announced that thanks to bulk-buying, the company saved 270 tonnes of plastic packaging, hence reducing its environmental footprint (Migros, 2020). Coop, another main retail store in Switzerland, is also committed to the reduction of plastic for their organic product through alternatives, by favoring cellulose packaging, stickers or elastic bands (Coop, 2020).
Another alternative is bulk stores. By selling in bulk, they eliminate the packaging that usually comes with the product purchases in retail stores. The principle of bulk stores is to bring containers and fill in the quantity of food required. For the products packed in glass, a deposit system is usually put in place. Thus, materials are used several times, to indefinitely and do not immediately go to the incineration or recycling process.
3. Methodology
3.1 Data collection and analysis
The first analysis quantifies the food packaging consumed by a single individual according to its monthly food consumption. Regarding the quantity of food consumption, the consumption basket of the Federal Statistical Office (FSO) has been taken as the indicator. This approach was necessary to carefully measure the quantity of packaging waste monthly consume by an individual living in Switzerland. The packaging of several products found in supermarkets were weighed. The quantities of packaging per food product have been computed per 100 grams (gr) or 100 milliliters (ml). Then, they were transferred into the consumption basket of the FSO to obtain the monthly packaging waste of an average individual.
Regarding the second analysis, two surveys were created (Appendices 1.1 and 1.2). The first one involves a broad spectrum of customers (“general customers”) in Geneva. The data have been gathered via a quantitative data collection method, broadly shared in social media. The second survey was dedicated to bulk store customers (“specific customers”) in Geneva and was communicated to them by email thanks to a cooperative’s management.
The purpose was to collect information regarding the current consumers’ purchasing habits and measure their switching costs. The reason why two slightly different surveys have been created was to differentiate and compare “general ” and “specific” customers. Both were mainly closed-ended questions which give respondents predefined options to opt for. This type of questions has been favored to obtain direct answers.
For the second analysis, a sample of 161 answers was taken into consideration for the first survey while the second collected 95 responses. All participants had to meet a single criterion which is living in Geneva.
For the third analysis, three maps have been created to locate the different type of food stores in Geneva. The first map locates retail stores, such as Migros, Coop, Aligro and Manor Food. The second traces Lidl, Aldi and Denner which are discount stores while the last one indicates bulk stores. Regarding the supermarkets, the information was directly taken from their respective official website while for bulk stores, the data came
from the Romande Federation of customers1 (frc). Their locations were necessary in
order to know the ease of access for customers.
Finally, the switching costs are based on both surveys and the information on food stores’ official website. The monetary costs compared the price of seemingly identical food products, the customer budget, and the products’ range between retail and bulk stores. The time-based switching cost measured the distance travelled by the customer, the time spent on-site and the food stores' location. For the price and the product range, differentiation has been made between standard and organic food items. In fact, bulk stores usually sell organic products and the food labels available in supermarkets are not all considered organic. The Cambridge Dictionary defines Organic as not using artificial chemicals in growing of plants and animals for food and other products. For this reason, only some food labels have been considered as organic in this study. Please refer to Appendix 2 for more details.
1 Fédération Romande des consommateurs
4. Findings
4.1 First analysis quantity of food packaging
This section measures the monthly quantity of packaging consumed by a single individual in Switzerland depending on where a customer goes grocery shopping. The result contributes to estimate the CO2 emissions of plastic food packaging per capita in Switzerland.
The choice of packaging materials depends on their functions. The table below illustrates the advantages and disadvantages of the ones measured in this study.
Table 1 - Packaging types
Types Advantages Disadvantages
Glass packaging
Reusable
Widely recyclable
Hygienic material (pure and safe)
Heavier
Fragile (food is unrecoverable due to glass fragments)
High cost of
production/manufacturing
Metal
packaging Light Resistant
Recyclable
Expensive material
In food packaging: Steel does corrode and Aluminum damage taste
Cardboard
packaging Economical Widely recyclable
Light
Environment-friendly material
Often waxed (for food), recycling is more complex
Little resistant (not water resistant) Not applicable to all products
Plastic
packaging Resistant Light
Economical (also in terms of transportation)
Potential migration of chemical additives on food
High environmental impact, non-biodegradable and petroleum-based products
Some packaging materials are recyclable and thus, lead to fewer carbon emissions than extracting the resources. However, the recycling process still contributes to environmental degradation with transportation, shredding, several cleaning, melting and reshape processes. These activities contribute to pollution and have very intense water and energy consumption. In addition, plastic packaging remains the more damaging to the environment due to its chemical compound. For this reason, the CO2 emissions will be estimated only for the plastic packaging. Recycling materials are better for the environment but reducing the overall packaging waste remains the most environmentally friendly option.
4.1.1 In food stores
Table 2 shows the generation of packaging waste by an average single individual purchasing in supermarkets. This sub-section also estimates the carbon footprint of plastic packaging by an average individual.
The monthly food products consumption is based on the latest version of The Household Budget conducted by the FSO from 2015 to 2017, published in November 2019. More details about the quantities of packaging waste per food items are in Appendix 3.1.
Table 2 - Packaging consumption for an average single individual
Single individuals Average
Food categories
Monthly consumption for a single persons in kg
Quantity packaging in grams
Glass Metal Cardboard Plastic
Bread and cereal products 6.13 - - 67.5 359.4 Meat and fish 3.33 - 44.2 32.7 431.7 Milk, cheese, and eggs 9.54 - 12.3 266.8 219.3
Fats and oils 7.59 - - 0.8 77.5
Fruits 7.32 - 23.9 8.9 160.6
Vegetables 7.56 - 130.8 3.5 88.7
Sugar, jams, honey, chocolate
and confectionery 1.67 181.1 9.3 25.2 38.6 Sauces, salt & spices, soups
and other 1.74 394.1 16.0 53.8 81.5 Total per packaging material in g 575.2 236.5 459.1 1457.3
TOTAL of packaging in kg 2.73
In the table above, the food products were only selected in supermarkets. Within the bread and cereals section, the rice and pasta are considered only wrapped in plastic1.
Also, the figures about meat and fish are related to plastic trays. This material ensures food safety, hygiene and moisture stability as they are sensitive to temperature change. There are two plastic packaging methods, the “plastic tray” and the “skin packaging”2.
According to Sealpac UK, a company supporting food manufacturers by supplying tray sealers, their vacuum skin innovation can reduce the packaging weight by up to 75%3
(SealpacUK, 2020).
1These products can also be packed with cardboard. By computing these products in cardboard
packaging instead of plastic, the total cardboard packaging would be 108.9 grams, thus 61.3% more, and 354.1 grams for plastic thus, 1.5% less than mentioned in the table.
2 It refers to the plastic packaging tightly wrapped around the product.
3 By decreasing the quantity of packaging by 75%, the monthly plastic waste for meat and fish
According to the figures presented in table 2, an average single individual, residing in Switzerland, consumes 2.7 kg of packaging waste each month of which 53% is plastic. Every year, the plastic packaging waste consumed by an single individual is emitting 105 kg of CO2 emission. Indeed, 6 kg1 of CO2 per kg of plastic are released during its
production and incineration process (Rohrer, 2009).
Plastic recycling saves about 2.5 kg of CO2 per kg of plastic than the original processing (Rohrer, 2009). Hence, recycled plastic saves 44 kg of plastic packaging’s carbon footprint per individual on a yearly basis.
The same estimation has also been done using consumption data for households composed of two adults and a child. Couples with one child will have a higher overall packaging waste consumption compared to an average single individual. However, the ratio packaging to foodstuffs is almost identical (see Appendix 3.2).
Since coffee, tea and cocoa are easily found in bulk, they have been taken into consideration for this study as beverages.
An average individual will monthly consume 7 grams of plastic packaging waste by drinking soluble cocoa. For the accuracy of this analysis, the coffee and tea have been divided into subcategories. This analysis assumes that an individual will purchase these beverages on supermarkets depending on its home equipment.
Table 3 - Beverages packaging consumption for an average single person
Monthly consumption (g)
Single persons average Cardboard2
(g)
Plastic (g)
667.4 Total Total (coffee ground, tea sachet & cocoa) 28.9 25.5 Total (coffee beans, tea sachet & cocoa 28.9 17.8 Total (with capsules & cocoa) 236.5 319.2
564.9
Coffee Coffee ground 18.5
Coffee beans 10.7 Coffee capsules 214.0 282.4 59.5
Tea Tea capsules Tea sachets 28.9 22.6 29.8
43.0 Cocoa Cocoa 7.0
1 1 kg of plastic requires 2 kg of oil for energy and raw material, and burning creates 3 kg of
carbon dioxide.
Table 3 shows that the elements using the most packaging are the capsules. The total weight of the capsule consists of 60% of the coffee inside and the remaining 40% is the plastic packaging. On average, a capsule is made of 3 grams of plastic for 5 grams of coffee. Some capsules use aluminium, which can be recyclable. However, the most common recycling technique (known as pyrolyze) requires a lot of energy. In addition, international transports are involved as the schema for capsules recycling in Europe cross four countries: The Netherlands for cleaning, Italy for melting in ingots, Germany to change ingots into aluminium sheets and finally, Switzerland to transform the metal into capsules (Damge, 2018).
In this analysis, the capsules are in plastic. The supermarket’s brands usually use plastic instead of aluminium as it is less expensive. Accordingly, they can provide similar capsules than major coffee’s brands to a lower price.
4.1.2 In bulk-food stores
The principle of bulk-food stores is to bring containers from home and fill with the product from the bulk department. In most cases, the types of packaging used by customers are cloth or cotton bags, jars, glass bottles and containers. An important point is that packaging is used, filled and reused several times to indefinitely by customers. The packaging does not go immediately to the recycling or burning process.
Bulk stores also use plastic packaging for meat and fish products. These need to be wrapped in a thermal or plastic packaging, which keeps the product sterile. Nevertheless, the customer can come with its containers and ask to be filled in. In addition, some dairy products such as cheeses are also wrapped in plastic. This is similar to the counter‘s services in supermarkets.
4.1.3 Comparison
This sub-section compares the packaging waste consume by an individual for the same food basket depending on its place of consumption. It also measures the CO2 emissions of plastic packaging by bulk stores and supermarkets for the purchase of identical food items.
In bulk stores, customers come mostly with cotton bags and containers. For this reason, some food products packaging waste is close to zero. In addition, some bulk stores have a deposit system for glass bottles and jars. In table 4, it is assumed that there is a deposit system for glass material within bulk stores.
The quantities of supermarkets’ packaging waste differ from table 2 on page 8 as only similar products in both food stores have been taken into consideration. To obtain more details on the packaging waste quantities per food category, please refer to Appendix 3.3.
Many bulk stores use plastic to wrap cheeses while meat and fish are wrapped in thermal or plastic packaging. Thus, the study assumes no difference between bulk and retail stores regarding the quantity of packaging waste for these products.
Table 4 - Packaging comparison Supermarkets vs Bulk stores
Food categories
Quantities packaging in grams
Supermarkets Quantities of packaging in grams Bulk stores
Glass Metal Cardboard Plastic Glass Metal Cardboard Plastic Bread and cereal
products 67.5 120.4 0 0
Meat and fish 31.7 431.7 31.7 431.7 Milk, cheese, and
eggs 12.3 266.8 219.3 12.3 44.0 54.4
Fats and oils 0.8 77.5 0 4.31
Fruits 8.3 160.6 0 0 Vegetables 76.1 0 0 Sugar, jams, honey, chocolate and confectionery 181.1 9.3 25.2 19.4 0 0 21.5 0 Sauces, salt and
spices 394.1 16.0 21.5 33.0 0 0 1.8 0 Estimated packaging waste monthly 575.2 37.6 421.8 1137.9 0 12.3 99.0 490.5 Total packaging waste in kg monthly 2.17 0.60
By taking the same food basket, bulk-buying decrease packaging waste by 72%. In terms of plastic CO2 emissions, the supermarkets will monthly emit about 7 kg of plastic CO2 emissions, while the bulks store will only release 3 kg. Yearly, bulk-buying represents a saving of about 48 kg of plastic CO2 emissions by a single individual.
Regarding the beverages, the packaging waste consumption in bulk stores is at zero as coffee, tea and cocoa are filled with the customers’ containers.
1 The study estimates that for 100 grams of butter, 1.2 grams of thermic paper is needed for
wrapping. Only this type of packaging have been computed for the bulk stores while for supermarkets the packaging used for butter is computed with tray plastic packaging.
4.1.4 Conclusion
In conclusion, a single individual residing in Switzerland will consume 2.7 kg of packaging waste each month, hence more than 30 kg yearly. In terms of CO2 emissions, an individual will emit 105 kg of plastic carbon emissions every year. For beverages, the coffee and tea can be consumed in bulk, sachet, ground or capsule. The beverages’ packaging waste thus, depends on the customers’ consumption style. However, the capsules are the elements using the most packaging. Finally, the packaging waste of an identical food basket has been compared between supermarkets and bulk stores. It shows that, for a single individual, bulk-buying reduces overall packaging waste by 72% and saves about 47 kg of plastic CO2 emissions yearly.
4.2 Second analysis customers habits
The second analysis is related to both surveys. Clients of supermarkets are referred to as general customers and customers from bulk stores as specific. For the first survey, the study sample 161 general customers and 95 specifics for the second survey. Only customers living in the Canton of Geneva were taken into consideration.
This analysis is divided into 4 sub-sections, Demographics, Purchasing habits, Knowledge of food labels and Knowledge of bulk stores. They aim is to highlight and understand the differences or similarities between these customer’s types regarding their consumption habits.
4.2.1 Demographic
The Demographic shows the participants’ characteristic like the gender, age, annual income, location and household structure. The objective is to compare the socio-elements of a general customers to the ones purchasing in bulk stores.
In terms of gender ratio, three quarter of consumers are women in both surveys. The general customers are slightly younger as more than a half1 is between 18 and 24 years
old while only 39% of specific customers are between this age range. This may be due to the higher number of students in the general customers’ survey2.
The average age is between 25 and 34 years old for general customers while for the specific customers is from 35 to 44 years old.
1 50.9%.
2 In the survey 1 (general customers) 20% are students/trainees while in the survey 2 (specific
Due to the professional situation of the participants, there is substantial variation regarding the gross annual income among them. For this reason, only the income of full-time employees is taken into consideration. In both surveys, the average annual income is between 78’000 CHF and 100’000 CHF. Thus, there is no difference regarding the income between general and specific customers with full-time employment. However, the household’s structure differs. Although the households are mostly couples without children in both surveys1, specific customers are more numerous to live alone2. In
addition, there are half more large households3 in the general customers’ survey.
All the participants are mainly living in the municipality of Geneva. The maps below show that the general customers are more geographically dispersed.
Figure 1 – Location of surveys participants
1 In the survey 1 (general customers) 32% are couples and 59% are living without children, while
in the survey 2 (specific customers) 39% are couples and 75% are living without children.
2 18% of general customers are living alone while specific customers are 30%. 3 Here, large households are considered to be 4 people and more.
4.2.2 Purchasing habits
This section refers to the weekly buying patterns of general and specific customers. It aims to understand the perception of general customers regarding plastic packaging in supermarkets. In addition, it shows which food items are the most frequently purchased in bulk store by specific customers.
Firstly, the frequency for grocery shopping shall be determined and compared between specific and general customers.
On average, the general customers go twice a week grocery shopping in supermarkets1
while specific customers go more often. A specific customer goes on average 3 times a week grocery shopping as it usually includes several stores like in bulk2, markets3 and
supermarkets4.
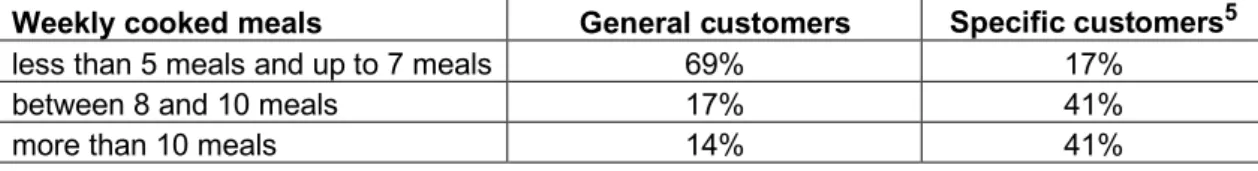
The frequency for grocery shopping is influenced by the number of meals an individual cooks during the week. An individual cooking its own meals every day needs to go more often to food shops than a person who eats regularly outside, such as in restaurants. However, the demographic section shows that the specific customers’ survey was more single individuals while general customers’ survey was larger households. The cooking activity may thus be divided among the people living under the same roof. For this reason, table 5 shows the number of meals cooked weekly by single individuals in both surveys. The single specific customers cook about 3 times more than a single general customers.
Table 5 - Number of meals cooked weekly per single person
Weekly cooked meals General customers Specific customers5
less than 5 meals and up to 7 meals 69% 17%
between 8 and 10 meals 17% 41%
more than 10 meals 14% 41%
1 50% of the participants go grocery shopping in large retail stores such as Coop, Migros and
Manor, 20% in discount stores, 18% neighboring France and 12% in bulk, organic stores, markets or regional farmers.
2 80% go weekly grocery shopping in bulk stores. 3 51% go weekly grocery shopping in markets. 4 62% go weekly grocery shopping in supermarkets.
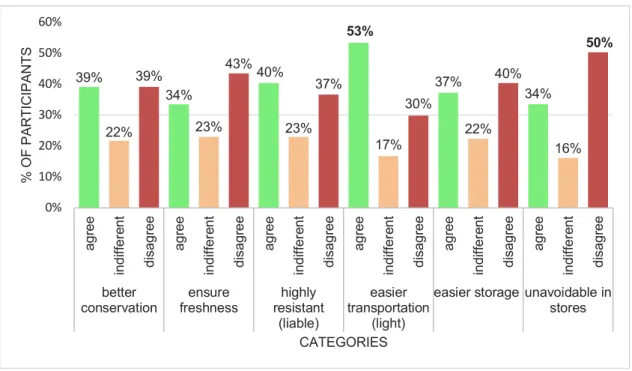
The second element considered in the purchasing habits section is the perception of plastic packaging in supermarkets by general customers. The purpose is to understand what are the main advantages of plastic packaging for general customers when grocery shopping.
Figure 2 - Plastic packaging advantages from general customers
The graph above shows that there are divergent opinions concerning the advantages of plastic packaging. Indeed, in most categories, agree and disagree obtained similar percentages1. However, the ease of transportation seems to be the major advantage of
plastic packaging for general customers. The second highest percentage is related to the unavoidability of plastic packaging in food stores. Half of the participants consider that plastic packaging can be avoided when grocery shopping. This result is surprising as the general customers mostly go grocery shopping in supermarkets where the over-packaging of food is customary.
In bulk stores, the plastic packaging is limited to specific food products, such as meat, fish, butter and cheeses. Plastic can still be avoidable by bringing containers though. For this reason, this section took into consideration the frequency with which specific customers purchase certain food items.
1 Due to rounding of figures, the percentage related to the easier storage do not sum up to exactly
100%. 39% 22% 39% 34% 23% 43%40% 23% 37% 53% 17% 30% 37% 22% 40% 34% 16% 50% 0% 10% 20% 30% 40% 50% 60% agr ee in dif fe re nt di sa gr ee agr ee in dif fe re nt di sa gr ee agr ee in dif fe re nt di sa gr ee agr ee in dif fe re nt di sa gr ee agr ee in dif fe re nt di sa gr ee agr ee in dif fe re nt di sa gr ee better
conservation freshnessensure resistanthighly (liable)
easier transportation
(light)
easier storage unavoidable in stores % O F P A R T IC IP A N T S CATEGORIES
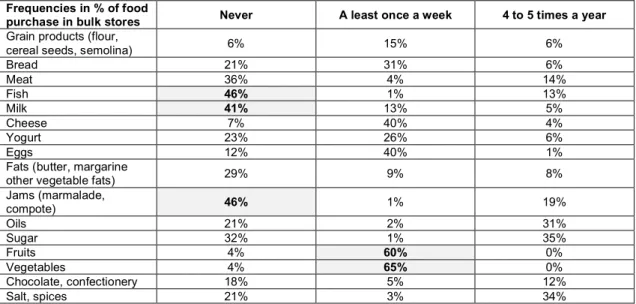
Table 6 - Frequencies of food products purchase by specific customers
Frequencies in % of foodpurchase in bulk stores Never A least once a week 4 to 5 times a year
Grain products (flour,
cereal seeds, semolina) 6% 15% 6%
Bread 21% 31% 6% Meat 36% 4% 14% Fish 46% 1% 13% Milk 41% 13% 5% Cheese 7% 40% 4% Yogurt 23% 26% 6% Eggs 12% 40% 1%
Fats (butter, margarine
other vegetable fats) 29% 9% 8%
Jams (marmalade, compote) 46% 1% 19% Oils 21% 2% 31% Sugar 32% 1% 35% Fruits 4% 60% 0% Vegetables 4% 65% 0% Chocolate, confectionery 18% 5% 12% Salt, spices 21% 3% 34%
Table 6 shows that the highest frequencies are related to purchasing vegetables at least once a week (65%), closely followed by fruits (60%). These elements are heavily packed in plastic in supermarkets. Fish and Jams are the elements which acquired the highest percentage in the never frequency, closely followed by milk. One reason is that these products cannot be easily found in every bulk stores. The disparity between the other food items may be explained by their lower consumption and/or their long-life storage. For example, the sugar is for 32% never purchase in bulk while 35% buy it 4 to 5 times a year. It shows that more than two thirds of the participants do not purchase a lot of sugar in bulk within a year.
4.2.3 Knowledge of labels for sustainable food products
This section relates to the extent of knowledge by customers regarding labels for sustainable food products. Swiss legislation provides a minimum framework to prevent abuse for all foodstuffs. Food labels go beyond this framework and guarantee more sustainable food products from land to the plate (Frc, 2015).
Food labels bring additional value to consumers since the product complies with additional regulations (Frc, 2015). They are primarily assessed on the respect of the environment and on the farming conditions but are not evaluated on the type of packaging used. However, bulk stores provide organic food products with sustainability labelling.
The participants of both surveys mainly agree on which criteria food labels should be evaluated on (Appendix 4). Regarding the type of packaging used, the vast majority1
think that it is important in the evaluation of label for sustainable products’ evaluation. For this reason, their level of attentiveness and knowledge regarding food labels have been compared.
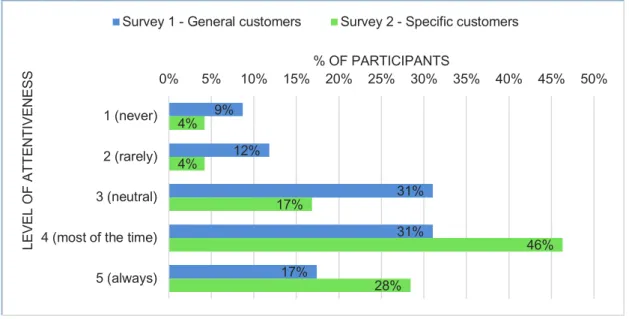
All customers were required to scale their level of attentiveness regarding food labels from one, never, to five, always. Figure 32 shows that the average level is three for
general customers and four for specific ones. It means that specific customers most of the time look at food labels while general customers are neutral.
Figure 3 - Level of labels' attentiveness
To test the trustworthiness of their response, the participants had the possibility to select several food labels, including two fake named Biosol and Ecodéfi. 12 general customers chose at least one of the two fakes labels while 3 specific customers did. After having removed the results of fake labels, the general customer recognized on average 43 labels
and the specific customer 54.
1 88% of general customers (survey 1) and 98% of specific customers (survey 2) consider the
type of packaging used important. The remaining percentage is in the middle-importance.
2 Due to rounding of figures, the % of survey 2 do not sum up to exactly 100%.
3 585 right answers divided by 161, number of the participants in survey 1 is equal to 3.6. 4 494 right answers divided by 95, number of participants in survey 2 is equal to 5.2.
9% 12% 31% 31% 17% 4% 4% 17% 46% 28% 0% 5% 10% 15% 20% 25% 30% 35% 40% 45% 50% 1 (never) 2 (rarely) 3 (neutral)
4 (most of the time)
5 (always) % OF PARTICIPANTS LE V E L O F A T T E N T IV E N E S S
In summary, both customers consider that the type of packaging used should be part of the labels for sustainable food products’ criteria. In addition, the specific customers have a higher level of knowledge and attentiveness regarding food labels.
4.2.4 Knowledge of bulk stores
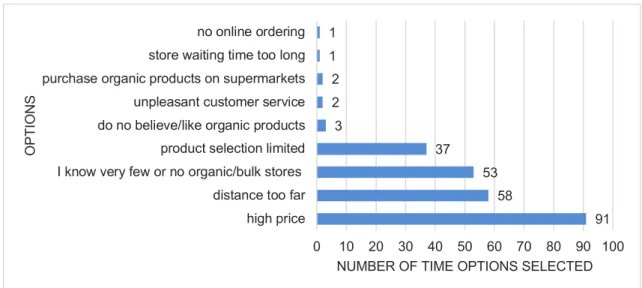
The last sub-section of this second analysis aims to measure the extend on which general customers know about bulk stores. The objective is to underline the elements which prevent general customers from going grocery shopping there.
More than half1 of general customers never go shopping in bulk stores. The reasons that
keep them from not going more often are numerous and are illustrated in the figure below.
Figure 4 - Reasons for not going to bulk stores by general customers
The principal reasons are illustrated in figure 4. It reveals that general customers may think that bulk stores are expensive considering that more than half of them never go grocery shopping there. Thus, general customers may have heard this information without having been to bulk stores.
The second reason is the distance to travel closely followed by the little knowledge of where to find these stores. On average, the general customers know 2 bulk stores with the majority knowing none of them.
1 54% of the general customers never go grocery shopping in bulk stores while 18% go less than
once a month. 91 58 53 37 3 2 2 1 1 0 10 20 30 40 50 60 70 80 90 100 high price
distance too far I know very few or no organic/bulk stores
product selection limited do no believe/like organic products unpleasant customer service purchase organic products on supermarkets store waiting time too long no online ordering
NUMBER OF TIME OPTIONS SELECTED
OP
T
ION
In comparison, the specific customers know twice more food stores where customers can purchase in bulk than general customers. This result is not surprising as specific customers are frequently bulk-buying.
In summary, the locations of bulk stores are not common knowledge. The consumers’ relatives play an important role as 41% of the specific customers discovered bulk stores thanks to friends, family and word-of-mouth1.
If the reasons that prevent general customers from going grocery shopping in bulk stores are numerous, the specific customers believe that there are some advantages to that. Almost all specific customers (98%) consider the support of local producers as the primary reasons for going to bulk stores. Indeed, they are usually in contact with regional producers who provide bulk stores with fresh products. The second main benefit is the limits of production waste. As demonstrates previously, bulk-buying decrease packaging waste by 72%. The third reason for specific customers to go grocery shopping in bulk store is to be part of the zero-waste community.
4.2.5 Conclusion
In conclusion, bulk-buying customers are usually small household, one or two people, living in the city center. In addition, specific customers go more often grocery shopping as they usually cook more. They also purchase food in different places like in bulk stores, markets and supermarkets. An interesting finding is that vegetables and fruits are the products the most frequently purchased in bulk stores.
According to 53% of general customers, plastic packaging facilitates transportation while the other reasons create more disparity. In addition, half of them believe that plastic packaging can be avoided in food stores.
Despite not being assessed on the packaging material used, both customers’ types agreed that the labels for sustainable food items should, however, be evaluated on it. Specific customers pay nevertheless more attention and have a higher knowledge on food labels.
Most of the general customers never purchase food in bulk stores because they think that they are more expensive. In addition, they only know a few numbers of bulk stores.
1 For the remaining percentage, 21% discovered bulk stores in social media or website, 21% in
brochures or flyers and 17% by personal interest and discover by chance (e.g. close from work place, festival, walked past…).
Despite the barriers of general customers to go more often in bulk stores, specific customers unanimously consider that the main advantage of bulk stores is bringing support to local producers. The second benefit is reducing waste while finally, it is being part of a community.
4.3 Third analysis switching costs
The third and last analysis of this report measures the switching costs for general customers to change their purchasing habits. It refers to costs incurred by a consumer from changing its place of consumption, hence favoring bulk stores. On the previous analysis, the general customers mentioned the high price, the distance and the lack of products’ variety as barriers from going in bulk stores. For this reason, two switching costs will be measured.
Firstly, monetary switching costs are estimated. The objective is to determine the difference in price for seemingly similar food products in bulks and retail stores. The range of food items will also be taken into consideration to know by which extent supermarkets offer larger choice.
Secondly, the time-based switching costs refer to the time spent within food stores by general and specific customers. The location of retail food stores and bulk stores are displayed on maps.
4.3.1 Price differences
To measure the monetary switching costs, the first element to take into consideration is the difference in price between supermarkets and bulk stores. Then, the product range has been estimated. The objective is to determine whether bulk stores are more expensive than supermarkets and if the food products range is wider or not. In this sub-section, only similar organic foodstuffs which can be found in both places have been compared. In this report, the food items considered as being organic in the supermarkets are the ones with some labels for sustainable food products (see Appendix 2).
As price and variety are usually impacted by seasonality effect, the data collection has been performed between the end of April and beginning of May. The impact has been minimized by taking into account the average price for each food product.
The products’ price is an important element for general customers as two thirds agree that the competitive price is one of the main reasons why they go to supermarkets. In addition, 56% admit that what prevents them from going to bulk stores is due to the higher prices.
Table 7 - Price comparison Supermarkets vs Bulk stores
Prices comparison
ORGANIC vs ORGANIC Supermarkets1 Average Bulk storesAverage % Variation Grain products CHF 0.80 CHF 1.13 -29%
Fresh bread & flour CHF 0.62 CHF 1.18 -47%
Sugar CHF 0.30 CHF 0.54 -45%
Dairy products CHF 1.17 CHF 1.53 -24%
Fats & oils CHF 1.67 CHF 2.48 -33%
Fruits CHF 0.76 CHF 1.07 -29%
Sauces, salt & spices CHF 1.80 CHF 2.58 -30%
Dried fruits & mushrooms CHF 8.02 CHF 8.97 -11%
Vegetables & aromatic herbs CHF 1.88 CHF 2.35 -20%
Nuts CHF 2.40 CHF 3.31 -27%
Confectioneries CHF 2.23 CHF 4.23 -47%
Meat, fish & substitute2 CHF 3.60 CHF 4.08 -12%
Result -30%
Table 7 shows that supermarkets are estimated to be 30% less expensive than bulk stores. It only compared similar organic food items in supermarkets and bulk stores.
1 Two supermarkets have been taken into consideration for the average, Coop and Migros. 2 Here, the substitute is tofu which have been incorporate as a meat in the calculation.
In terms of beverages1, supermarkets are estimated to be 36% less expensive than bulk
stores. The details of the products’ selection and the ratios are in Appendix 5.1.
On average, general customers’ weekly grocery budget is between 100 and 200 CHF. For specific customers, their average budget is 168 CHF which is split between bulk stores (46%), supermarkets (38%) and markets (16%). Hence, there is almost no difference in the allocated budget for food. However, the demographic section indicated that the household structure was different. It means that general customers have a lower budget per person as they usually are larger household compared with specific customers.
Simultaneously, another calculation has been performed including the same selection of product but non-organic. It shows that the non-organic products in the supermarket are approximately 40% less expensive than the organic product in bulk stores. For non-organic beverages, supermarkets are estimated to be 55% less expensive. More information is in Appendix 5.2.
The vast majority of the general customers (91%) consider the wide range of product as the reason they choose to go grocery shopping in some retail stores. Moreover, 23% of the general customers are not usually going to bulk store due to the lack of product variety. The study estimates that supermarkets provide at least 30% more organic products than bulk stores2. However, this analysis only refers to the food items publicly
available on shops’ websites. Some bulk stores are specialized in some food products which thus, may not correspond to the average estimated in Appendix 6. In addition, the size of food stores also plays a role in the variety.
In summary, by comparing similar organic products, it shows that supermarkets are 30% less expensive than bulk stores. In addition, supermarkets provide on average 30% more products’ variety.
1 Beverages in this study refer to coffee, tea and cocoa.
2 The comparison is made exclusively within the bulk and retails stores selected by the study for
4.3.2 Time-based
This section measures the average time spent by customers for grocery shopping. It aims to evaluate which customers spend the most time on site and who travelled the longest distance for grocery shopping. In addition, it also illustrates through maps, the regional presence of the different food stores.
Firstly, the time spent on the site is identical between both customers. On average, general and specific customers spend between 30 and 45 minutes in food stores. However, the previous analysis indicates that specific customers go more often grocery shopping. They usually go 3 times a week compared to twice a week for general customers. It is thus estimated that specific customers spend one-and-a-half more time in food stores than general customers.
Figure 5 - Average time spend in food stores
Secondly, the distance travelled also plays a major role in the customers’ choice. Indeed, 93% of general customers favor grocery stores close to their home. In addition, 23% of them admit that one of the reasons that prevent them from going more often in bulk stores is the distance.
37% 34% 22% 5% 1% 36% 51% 11% 3% 0% 0% 10% 20% 30% 40% 50% 60% less than 30
minutes between 30 and45 minutes minutes and 1between 45 hour
between 1 hour
and 1h30 more than 1h30
% O F P A R T IC IP A N T S TIME SPENT
Figure 6 - Average distance travelled for grocery shopping
Figure 6 shows the distance travelled by both customers, general (blue) and specific (green), to go grocery shopping. On average, general and specific customers make between 1km and 2km. Given the last analysis, specific customers are mostly living in the city center while general customers are more dispersed in Geneva. For this reason, the locations of the different food stores is essential to be known.
In order to understand the allocation of food stores in the Canton of Geneva, three maps have been created for each category of food shops as Supermarkets1, Discount stores2
and Bulk stores (see Appendix 7).
The maps show that large retail stores covered both downtown and further municipalities areas in the canton of Geneva. Supermarkets are heavily present in the city center but also extend beyond a radius of 6km. Distance is calculated according to the city center.
1 Coop, Migros, Manor Food and Aligro. 2 Lidl, Aldi and Denner.
30% 27% 12% 9% 5% 4% 14% 23% 19% 41% 0% 0% 11% 6% 0% 10% 20% 30% 40% 50% 60% less than 500m between 500m and 1km between 1km and 2km between 2km and 3km between 3km and 4km between 4km and 5km more than 5km % OF PARTICIPANTS DI S T A NCE
Table 8 - Number of food stores from the city centre
KILOMETERS SUPERMARKETS DISCOUNT STORES BULK STORES
Beyond 6km 4 stores 2 stores 0 store
Between +4km and 6km 15 stores 6 stores 3 stores
Between +2km and 4km 18 stores 8 stores 5 stores
Between +1km and 2km 21 stores 15 stores 3 stores
Up to 1km 16 stores 5 stores 9 stores
TOTAL 74 stores 36 stores 20 stores
Despite a majority of supermarkets close to the city center, there are also present in 16 municipalities over 45 municipalities of Geneva. Discount stores cover 8 municipalities and the bulk stores only 5. One of the reason is that Bulk stores are almost 4 times less numerous than supermarkets and almost half that discount stores. This lack of visibility from other municipalities may contribute to the 32% of the general customers who do not know any bulk store.
4.3.3 Conclusion
In conclusion, the costs for general customers to go purchasing in bulk stores are monetary and time-based. In term of financial, the weekly budget of general and specific customers is identical. However, the previous analysis indicates that general customers are larger households. For this reason, it is estimated that general customers have a lower weekly budget allocated for grocery shopping.
By comparing organic products that can be purchased in both places, supermarkets are 30% less expensive. In addition, they provide 30% more organic food products variety than bulk stores.
5. Discussion
Plastic packaging is part of the global economy by combining several functionalities and benefits (MacArthur & all, 2016). Its low costs, versatility, durability and high strength-to-weight ratio, makes this material popular across different industries. However, the increasingly used of plastic contributes to environmental issues.
Compared to other packaging materials, plastic has a shorter useful life and comes from fossil raw materials. Moreover, packaging cannot be indefinitely recycled.
Nowadays, recyclable packaging materials became a sales’ strategy. Nevertheless, the recycled process still brings damages to the environment by excessively using resources such as water, but also polluting the air with the transportation, shredding and reshaping process. For these reasons, this study shows the impact of reducing the overall packaging consumption, in particular plastic.
In Switzerland, some retailers started to implement new initiatives to reduce their quantity of food packaging. For example, by implementing the bulk-buying concept in organic products, Migros reduced its annual footprint by 270 tons in 2018. The quantity of plastic packaging saved by this measure is equal to the weight of fifty adult elephants (Migros, 2020). Thus, bulk stores are expected to be the most environmentally friendly alternative for grocery shopping. Indeed, one of their principles is to reduce the quantity of packaging by filling in the customers’ containers.
In Switzerland, an average single individual, purchasing in supermarkets, consumes 2.7 kg of packaging waste each month. Out of this amount, 53% is plastic packaging. By assuming that the plastic is incinerated, 105 kg of CO2 emissions per capita is yearly emitted by plastic food packaging. At a country level, with a population of 8.5 million1, it
yearly represents 892’500 tons of greenhouse gas in the atmosphere.
If the plastic goes to the recycling process, it yearly represents 518’500 tons of CO2 emissions, hence saving 42% of CO2 emissions. However, the recycling process for plastic packaging remains limited.
Regarding beverages, the packaging consumption of an individual depends on its home equipment. For instance, coffee and tea in capsules are the elements using the most plastic packaging. Indeed, the total weight of a single capsule is made of 60% coffee and 40% plastic. Thus, a single individual will monthly consume about 320grams of plastic
by drinking soluble cocoa and hot beverages capsules. The other options like coffee in ground, beans and tea in sachet, decrease beverages’ plastic packaging by up to 95%. The comparison of packaging waste for a similar food basket between bulk stores and supermarkets reveals that bulk stores reduce packaging waste by 72%.
In terms of plastic carbon footprint and for an identical food basket, bulk-buying customers monthly emit 3 kg of plastic CO2 emissions while supermarkets ‘customers release 7 kg. A single individual will yearly save 48 kg of CO2 emissions by bulk-buying. Moreover, the packaging waste for beverages is at zero in bulk stores.
According to the World Bank, the CO2 emissions per capita in Switzerland was at 4300 kg in 2014 (TradingEconomics, 2020). The yearly ecological impact of bulk-buying may thus seem small1 with a saving of 48 kg of CO2 emissions. However, food products and
non-alcoholic beverages only represent about 9% of the Swiss household expenditures (OFS, 2019).
If all Swiss customers went grocery shopping in bulk stores, it would represent a yearly saving of about 408’000 tons of CO2 emissions. It represents a little under 400’000 cars. In addition, it is approximately 1500 times more than the carbon footprint saved by Migros in 2018.
Bulk stores reduce considerably the quantity of packaging waste consumed by a single individual. Nevertheless, supermarkets’ customers (general customers) and bulk stores’ clientele (specific customers) are not the same households.
The household structure of specific customers is smaller. It usually consists of one or two individuals. In addition, they are usually living in the city center where bulk stores are more popular. Thus, they have an ease of access to bulk stores.
In bulk stores, the most frequent food items purchased by customers are the fruits and vegetables. These food items are usually over-packed by plastic in supermarkets. As the principle of buying in bulk is to limit the use of packaging, the advantages of plastic packaging for general customers needed to be understood.
While the other options available create disparity, more than half of the supermarkets’ customers agree that plastic packaging helps with transportation. This element reveals that carrying out its containers for grocery shopping may disturb general customers.
In addition, for 50% of them, plastic packaging is not unavoidable in food stores. In supermarkets, several products are already pre-packed in plastic packaging, leaving customers with fewer alternatives. This element shows that customers are, however, believing that they can reduce their plastic consumption.
Both types of customers agree that the labels for sustainable food items should be evaluated on the packaging type. This is currently not the case as food labels are primarily assessed on the respect of the environment and farming conditions. As bulk stores usually sell organic products, specific customers have a slightly higher level of knowledge and attentiveness regarding food labels. For them, bulk stores have several advantages. Almost unanimously, specific customers consider the support of local producers as the primary reason. Bulk stores are usually working in collaboration with regional farmers to offer fresh and local products. The second benefit according to specific customers is the limit of waste production. Thanks to the previous analysis, bulk stores are estimated to decrease packaging waste by 72%. Finally, they consider the community and the participative element as one of the top three advantages.
Despite these advantages, more than half of general customers never go grocery shopping in bulk stores. The primary reason is the higher prices. The customers from supermarkets may believe or have heard that bulk stores are more expensive probably without having been there. While customers from supermarkets know on average 2 bulk stores, they consider the distance to travel as a barrier to go purchasing there. Also, their lack of knowledge about how to find bulk stores and the limited product offers keep them from going more often.
Bulk stores allow to reduce the quantity of packaging waste. Nevertheless changing customers habits implies costs, known as switching costs. By taking into consideration the customers’ barriers above, the main switching costs are monetary and time-based. The monetary switching costs are related to the price difference and the products’ range of supermarkets compared with bulk stores. These elements are impacted by seasonality effect. For this reason, the prices in this study illustrate the usual price average. The information has been gathered between end of April and beginning of May. Moreover, only the food items that can be found in both places have been selected and compared. Organic products and beverages in supermarkets are estimated to be 30% and 36% less expensive than bulk stores, respectively. The gap increases by comparing the price of non-organic products with bulk stores. In this scenario, supermarkets are cheaper by 40%.
Knowing the prices difference, the budget allocated for food items are slightly different between both types of customers. On average, specific customers have a higher budget allocated for grocery shopping. Indeed, their budget is usually split between different food stores. In addition, they are usually smaller households and cook regularly. They also spent weekly approximately the same budget than supermarkets’ customers which are larger families.
The monetary switching costs for supermarkets’ customers are thus very high. Aside from being more expensive than supermarkets, bulk stores also have more limited selection. Supermarkets are estimated to offer 30% more organic products’ variety than bulk stores. Tea is an exception as bulk stores are estimated to offer twice more tea in bulk than retail stores. In addition, some bulk stores are specialized in the sale of particular food items. The products’ variety also depend on the size of the stores. Then, the time-based switching costs are measured by taking into account the distance and the time spent on the store for grocery shopping. Even if the average time spent is between 30 and 45 minutes for both customers, bulk stores customers go more often grocery shopping. Thus, they usually spend about one-and-a-half more time in food stores.
Regarding the distance travelled by customers to go grocery shopping, both do between one and two kilometers. However, customers from bulk stores are mostly living in the city center where bulk stores are popular. This lack of visibility from other municipalities may contribute to the number of general customers knowing only a few or any bulk stores. The maps show that by being four times more numerous, large retail stores covered more municipalities areas.
In summary, bulk-buying decrease the quantity of packaging by 72%. However, bulk stores are more expensive and offer less variety thus, it implies high monetary switching costs. Notably for larger households with budgeted expenses. In fact, supermarkets are estimated to be 30% less expensive. The grocery budget may thus, be heavily affected by changing the place of the household consumption. In addition, general customers are expected to go close to the city center to have access to bulk stores as there are highly geographically concentrated.
5.1 Challenges encountered
The first challenge encountered during this study was to collect enough answers from the survey of general customers. The majority of respondents were living in other cantons than Geneva. To address this issue, a request to several Social Network pages in the Geneva area was sent requiring their help to share the questionnaire. Some Facebook Pages agreed to share the questionnaire which have significantly contributed to the data collection.
Last but certainly not least, the spread of the virus COVID-19 slowed down the data collection process tremendously. Due to widespread panic, food shelves were emptied by customers who desired as a precautionary measure to stock up hence, affecting the process of this Bachelor thesis. The food stores were not only difficult to access for several weeks, but any contact, discussions and meeting were impossible for health security reasons. In addition, the monetary switching costs needed to be rethink in order to not be heavily affected by the changes of price and products’ variety due to supply’s problems.