HAL Id: hal-01431868
https://hal.sorbonne-universite.fr/hal-01431868
Submitted on 11 Jan 2017
HAL is a multi-disciplinary open access
archive for the deposit and dissemination of sci-entific research documents, whether they are pub-lished or not. The documents may come from teaching and research institutions in France or abroad, or from public or private research centers.
L’archive ouverte pluridisciplinaire HAL, est destinée au dépôt et à la diffusion de documents scientifiques de niveau recherche, publiés ou non, émanant des établissements d’enseignement et de recherche français ou étrangers, des laboratoires publics ou privés.
Retracing the in vivo haematopoietic tree using
single-cell methods
Leïla Perié, Ken R. Duffy
To cite this version:
Leïla Perié, Ken R. Duffy. Retracing the in vivo haematopoietic tree using single-cell methods. FEBS Letters, Wiley, 2016, 590 (22), pp.4068 - 4083. �10.1002/1873-3468.12299�. �hal-01431868�
Re-‐tracing the in vivo hematopoietic tree using single cell methods
Leïla Perié1, 2 and Ken R Duffy3
Affiliations:
1Institut Curie, PSL Research University, CNRS UMR168, 26 rue d’Ulm, 75005, Paris, France.
2Sorbonne Universités, UPMC Univ Paris 06, 4 place Jussieu, 75005, Paris, France.
3Hamilton Institute, Maynooth University, Co Kildare, Ireland.
Contact information:
[email protected] and [email protected]
Abstract
The dynamic process by which self-‐renewing stem cells and their offspring proliferate and differentiate to create the erythroid, myeloid and lymphoid lineages of the blood system has long since been an important topic of study. A range of recent single cell and family-‐tracing methodologies such as massively parallel single-‐cell RNA-‐sequencing, mass cytometry, integration site barcoding, cellular barcoding and transposon barcoding are enabling unprecedented analysis, dissection and re-‐evaluation of the hematopoietic tree. In addition to the substantial experimental advances, these new techniques have required significant theoretical development in order to make biological deductions from their data. Here we review these approaches from both an experimental and inferential point of view, considering their discoveries to date, their capabilities, limitations and opportunities for further development.
Key words: hematopoietic tree, lineage tracing, single cells, RNA sequencing, mass cytometry, barcoding.
Introduction
For decades, a central question in the study of hematopoiesis has been the identification of lineage restricted cellular intermediates downstream of Hematopoietic Stem Cells (HSCs) and the determination of the differentiation pathways that lead through them to the production of mature blood and immune cells. This line of questioning has been driven by the desire to better select and manipulate the cells that are transplanted into patients as a consequence of blood related cancers and immune deficiency disorders. Increasing the understanding of the mechanisms that drive one of the most studied stem cell models has also stimulated the field. Hematopoietic development is a complex process with fascinating properties as HSCs produce a highly diverse diffuse tissue that responds dynamically to inducible perturbations such as infection and inflammation. The comparative ease with respect to other tissues with which such a complex system of differentiating cells can be
studied using in vitro cultures and transplantation systems might explain its popularity among both experimental and theoretical researchers as a stem cell exemplar.
The field of hematology has often progressed in parallel with newly developed technical possibilities and single cell methods have long since been essential tools in this investigation; the quintessential example being the discovery and characterisation of HSCs [1–3] through the occurrence of Fluorescence-‐Activated Cell Sorting (FACS), which enables non-‐destructive cellular phenotyping. The transplantation of single cells into irradiated recipients to assess in vivo reconstitution capability is another example of a fundamental single cell technique that was instrumental in revealing the diverse output of individual HSCs (reviewed in [4]). Over sixty years’ worth of detailed work has led to the canonical hematopoietic tree, Fig 1A, which has HSCs at its root and a branching collection of FACS defined cell types, each believed to have a more restricted lineage potential than its parents (Box 1). In this tree, HSCs self-‐renew and generate multi-‐potent progenitors (MPP) that differentiate and produce all blood cells. These MPPs commit to two separate branches, becoming either Common Lymphoid or Common Myeloid Progenitors (CLPs and CMPs) [5,6]. CLPs give rise to further committed progenitors that produce lymphoid cells, such as T and B lymphocytes, as well as innate lymphoid cells, while CMPs give rise to progenitors that produce Granulocytes and Monocytes (GMP) amongst others, and progenitors that only produce Megakaryocytes and Erythrocytes (MEP). Dendritic cells, another type of immune cell, derive from both CLPs and GMPs [7,8].
Biological assumptions of the hematopoietic tree include: there are a finite number of phenotypically definable categories of cell type, with definitive delineation in potential; all cells within each category retain all potentials defined by that category; and once a cell loses a potential, its offspring cannot regain it, leading to a hierarchical structure with no trans-‐ or de-‐differentiation. These assumptions map to a standard mathematical description: hematopoietic development is identified with a graph, which is directed to indicate sequential loss in potential, with vertices identified as cell types; edges in the graph correspond to loss of potential through differentiation; and the directed graph is often assumed to be a tree, where each cell has a only a single path of ancestral cell types leading to hematopoietic stem cells.
The precise meaning of the canonical tree in Fig 1A is, however, subject to interpretation. Arrows connecting cell types indicate progressive differentiation paths to terminally differentiated cells, but whether they imply that every cell gives rise to all cell types beneath it in the tree, or merely could do so with the right stimuli, or summarize at the population level individual cell trajectories, is unclear. In other words, is the tree describing what is possible or what actually occurs? Recent developments in single cell sequencing and single cell lineage tracing demonstrate that it is, at best, a description of what is possible and are, once again, challenging the paradigm of the hematopoietic tree thanks to higher resolution,
high throughput in vivo measurements. The biological deductions from these data are contingent on the complex statistical and mathematical methods necessary for their analysis, which calls for an interdisciplinary effort to truly understand the abilities and limitations that arise from both the experimental and data-‐interrogation techniques.
While the canonical tree provides a good description at the population level, new single cell methodologies are enabling unprecedented analysis, dissection and re-‐evaluation of the hematopoietic tree. As other aspects of single cells studies have been reviewed elsewhere [9], here we focus on recent results from ex vivo or in vivo single cell technologies assessing their contribution in modifying our scheme of the hematopoietic tree, presenting the abilities, limitations and promise of both the experimental and the data analytic aspects of these technologies, and, in the end, questioning if a discrete directed decision tree will ultimately prove to be the lasting quantitative descriptor of the process of blood system development.
Brief description of recent single cell methods used for hematopoiesis
Recent technological advances of single cell study have proceeded in two complementary directions: 1) by enabling the interrogation of single cell state in a high dimensional way (massively parallel single cell RNA sequencing (scRNA-‐seq), mass cytometry); 2) by allowing long timescale in vivo lineage tracing of multiple initial single cells, referred to here as barcoding (integration site barcoding, cellular barcoding, transposon barcoding). This classification will be used throughout the review.
Massively parallel scRNA-‐seq uses next generation sequencing to determine the transcriptome, the presence and quantity of mRNA, of thousands of individual cells in a sample [10]. Mass cytometry is a variant of flow cytometry in which antibodies are labelled with heavy metal ion tags rather than fluorochromes [11]. Mass cytometry circumvents spectral overlap issues that come with traditional FACS enabling a greater number of simultaneous measurements, but at the cost of destroying the cell.
All forms of barcoding (integration site barcoding, cellular barcoding and transposon barcoding), enable the familial identification of progeny of individual cells in vivo by marking them with unique heritable genetic tags. Integration Site (IS) Barcoding uses the location of the integration of a retrovirus or lentivirus as the heritable tag [12]. Cellular Barcoding tags each cell with an artificial sequence that is integrated into the genome via a retoviral or lentiviral vector [13]. Both IS and cellular barcoding require ex vivo manipulation of cells followed by adoptive transfer to new hosts. In contrast, Transposon Barcoding uses an inducible sleeping beauty transposon system to generate tags in situ [14]. Inserted into the embryonic stem cell of a mouse, a doxycycline trigger induces the transposon to jump
elsewhere in the genome. The integration site of the transposon post-‐trigger serves as the cell’s tag, as with IS barcoding.
High throughput scRNA-‐seq and mass cytometry have been used to question whether cells of the same phenotypic type would be identified as being of a common category based on their cell-‐internal state. Barcoding techniques question if each cell of a given category can be treated interchangeably regardless of its antecedence.
What has been questioned, and what we have learned so far using single cell methods
Single cells studies based on these new techniques have provided additional evidence in support of certain earlier results acquired at the population level via older methodologies, but have also made original contributions to the understanding of the hematopoietic tree. So far, these contributions have ranged from revealing significant heterogeneity in apparently homogenous cell intermediates, to stimulating revisions to the topology of the tree, to comparing the dynamics of naïve versus post-‐transplantation hematopoiesis. We begin by revisiting some of these discoveries.
Heterogeneity in cell intermediates (stem cells and progenitors):
Single cell methods are natural tools with which to study heterogeneity as they provide information on each individual cell, in contrast to population averages which mask individuality. It has long since been known that there is some heterogeneity in the potential of cell intermediates, but high dimensional cell state data and barcoding methodologies have revealed much more heterogeneity than was anticipated. An illustrative example of this phenomenon is analysis of the murine CMP. Even though subsets of CMPs with unequal lineage output in the megakaryocyte-‐erythroid and granulocyte-‐macrophage lineages were reported [15–18], CMPs were still thought to be the last cell intermediate producing both lineages. Evidence from massive scRNA-‐seq combined with indexed FACS sorting [19], and cellular barcoding [20] have shown that the murine CMPs are not a homogenous population and that the majority of individual CMPs are not common to all the myeloid cells. Even the existence of a minor population of truly common myeloid-‐erythroid and megakaryocyte-‐ erythroid progenitors is still to be ascertained as it is clear that the majority of cells classified as CMPs are actually lineage-‐restricted cells, as shown by histone modification mapping [19]. Similar results have been established in vitro for human CMPs [21].
Heterogeneity has also been identified in other cell intermediates of the tree. Murine HSC heterogeneity has been known for a long time (reviewed in[4]). Not surprisingly, after transplantation barcoded HSCs were found to contribute to all the cell types analysed (balanced), but some HSCs were uni-‐outcome with output only in the myeloid or lymphoid lineage [22]. This recapitulated prior results obtained using single-‐cell transfer [23,24] and studies based on differential marker expression [25], as well as describing further heterogeneity in the lymphoid-‐biased HSC. Heterogeneity has since been identified in earlier murine progenitors such as LMPPs and MPPs by barcoding [20,26], revealing similar results
to those found in vitro for human cells [21], and by scRNA-‐seq in other myeloid progenitors downstream of CMPs in mouse and human [27,28]. Note that heterogeneity has not only been identified in progenitors and stem cells, but has also been revealed in terminally differentiated hematopoietic cells.
This revelation of substantial heterogeneity provides significant challenges to our view of the hematopoietic tree. First, it questions the existence of well-‐defined discrete hematopoietic intermediates throughout differentiation, as identified with external cellular markers by FACS. Although scRNA-‐seq data have provided predictive markers that for true stem cells [29] and megakaryocyte-‐erythroid committed progenitors [19] within the murine HSC and CMP heterogeneous populations, respectively, they have yet to purify homogeneous populations. Indeed, after transplantation, only a fraction of these purified cells give the output predicted by RNA sequencing, suggesting enrichment rather than a purification of the population. The difference in the actual output compared with the prediction from RNA sequencing could result from effects of the niches where the cells seed, or from partial reprogramming due to perturbation induced by the transplantation. It is also possible, however, that the compartmentalization of cells into a collection of discrete homogeneous hematopoietic intermediates provides for a poor description of cell state. This idea has motivated computational work to avoid defining discrete intermediates, as discussed later in this review.
Second, the existence of heterogeneous lineage output from stem cells, and to a greater extent from MPPs, questions the source of this heterogeneity [30], as well as when and where differentiation decisions are taken. It appears that choosing between the myeloid or lymphoid lineage is not the first, primary delineation. More combinations of output from MPPs than would be expected based on the classical hematopoietic tree have been reported [20,26], calling for a revised version of the topology of the tree. The decisions leading to this combination appear to be made at earlier stages than was initially thought, mainly during the transition to the MPP population [31].
Topology of the hematopoietic tree
Single cell studies are also questioning the shape of the tree. The canonical hematopoietic tree (Fig 1A), built mostly from FACS data and transplantation studies, describes a step-‐by-‐ step process of lineage commitment in which HSC self-‐renew and generate multi-‐potent progenitors (MPP) that differentiate and produce all blood cells. This tree has already been subjected to controversies over the years and numerous alternative models have been proposed and reviewed elsewhere [32–34]. Single cell studies have recently given some insights on the topology of the tree. The classical tree is on more shaky ground than ever. Cellular barcoding of murine LMPPs [26] and MPPs [20] has resulted in the observation of large numbers of progenitors giving rise to dendritic cells without generating detectable lymphoid and myeloid cells, suggesting a branching for DC that is distinct from the myeloid
and lymphoid branches. Similarly, using IS barcoding on CD34+ cells from macaques [35] have shown that NK cells don’t share barcodes with lymphocytes and myeloid cells, and could therefore originate from a separate branch. It is tempting to intuitively interpret the presence of barcodes in one cell type as the indication of a separate branch, but both detection and complex inferential issues can mislead our interpretation and suggest prudence. Discussed further later, network inference methods have proposed the existence of additional branches to the murine hematopoietic tree, such as a direct branch from LMPPs to dendritic cells [36] (Fig 1B). Making use of IS barcoding during human gene therapy, Biasco et al. [12] have also proposed that NK cells develop independently of lymphocytes. Even though not all the possible tree topologies were tested [12], they concluded in favour of a tree where lymphoid progenitors retain a myeloid potential (also called the myeloid bypass model [34], fig 1C). Bearing in mind potential bias due to the patient’s disease, these results offer further support for the idea that the lymphoid-‐myeloid segregation doesn’t occur in human [37].
The heterogeneity in lineage output of murine HSC and MPP suggests that lineage decisions occur early in the differentiation process. MPPs can be viewed as a population of lineage committed progenitors with different combinations of lineage output (Fig 1B). From this data, it is still unclear what is the shape of the tree downstream of the MPP pool. We envision that this time is a watershed for the field with fast developing experimental and computational techniques, from which more exciting results on the topology of the tree will come.
Dynamics of naïve and post-‐transplantation hematopoiesis
Single cell studies are bringing information not only about the topology of the hematopoietic tree but also on the dynamical properties of the processes taking place within it. Following transplantation, a small fraction of murine barcode-‐labelled HSCs contribute to hematopoietic output at a given time point after irradiation [26,38,39], similarly to retroviral tagging studies [40–42]. The cell types output by individual HSCs changes little after 3 months post-‐transfer, but their quantitative contribution varies over time, with most of the HSCs expanding or declining [22]. HSCs from old mice have been observed to engraft as efficiently as HSCs from younger mice, contradicting previous studies, although their cellular output was lower [22]. Barcoded HSCs recovered from individual bones were not uniformly distributed amongst them, and did not all contribute to peripheral neutrophils [43]. After granulocyte colony stimulating factor injection, however, HSCs rapidly redistributed equally between bones, suggesting that HSCs are efficiently recruited after inflammatory signals. In human and macaques a larger proportion of HSCs lineage-‐traced by integration sites is estimated to contribute to long-‐term hematopoiesis [12,44,45]. After a first wave of short-‐term progenitors post-‐transplantation, hematopoiesis is maintained by progenitors with a balanced myelo-‐lymphoid output at steady state.
Using transposon barcoding, Sun et al [14] have tagged individual murine cells in situ. At the time of induction, a fraction of the cells are labelled non-‐specifically, i.e. independently of their cell state. By using this system, it has been shown that thousand of different clones maintain long-‐term granulopoiesis sequentially. Those clones were present mostly in the MPPs and not in the HSCs, leading the authors to conclude that MPPs are the main contributor of hematopoiesis in steady state, even if limits of detection cannot exclude a contribution from HSCs. Together with the results from lineage tracing studies at the population level [46], this result clearly contrasts with the situation post-‐transplantation where only a few stable HSC contribute to hematopoiesis. These results show that the dynamics of normal hematopoiesis are different than those after transplantation. More studies need to be done to infer the dynamics downstream of HSC in the tree in normal conditions.
Single cell studies have made important contributions to the understanding of the hematopoietic tree, but these deductions are contingent on both biological and data-‐ analytic assumptions that we wish to make explicit. In doing so, we hope to make clear what we see as potential opportunities for both experimental and theoretical development, and revisit our notion of appropriate quantitative descriptions of the hematopoietic lineage.
Experimental abilities and limitations of recent single cell methods used for hematopoiesis
We have divided these methods into two categories: those that provide high dimensional measurement of single cell state (massively parallel scRNA-‐seq, mass cytometry); and those that enable in vivo lineage tracing of multiple initial cells, referred to here as barcoding (integration site barcoding, cellular barcoding, transposon barcoding). An important distinction between the methods is whether they can measure the in vivo outcome of cells, meaning what the cells are actually becoming during differentiation. Note that none of the methods discussed here can measure the potential of what a cell can do.
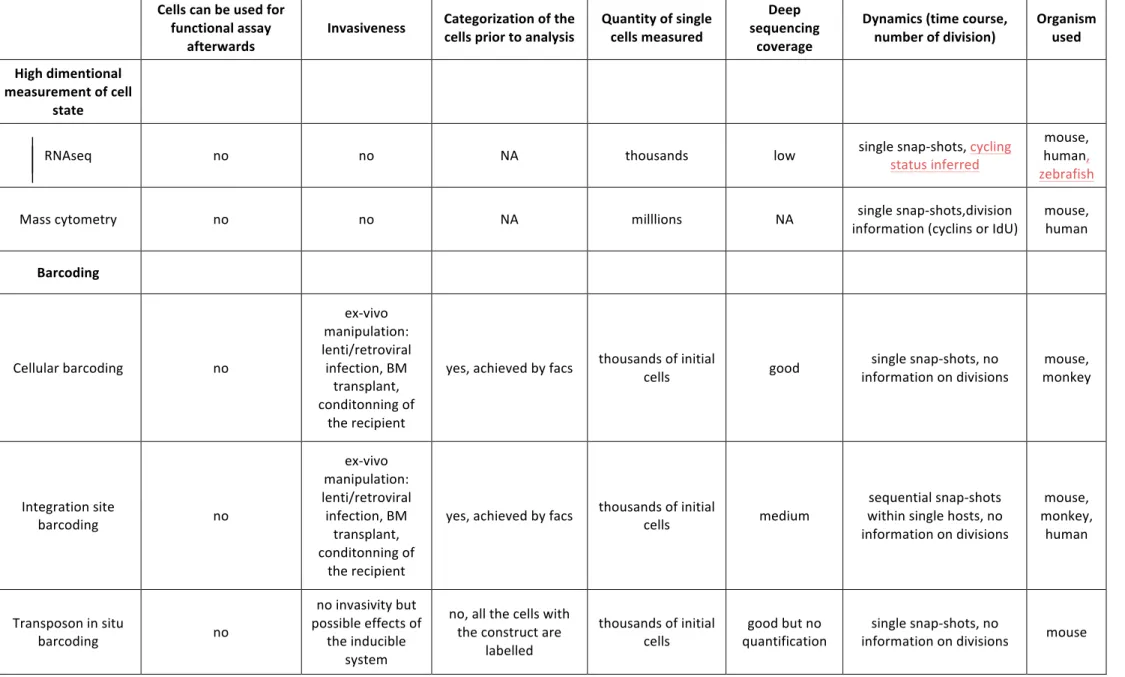
Many of the technical aspects, technical adaptations, data processing and so forth, have been reviewed elsewhere [10,13]. Thus here we focus on outlining differences between the techniques that have an impact on biological conclusions for the hematopoietic tree (table 1).
As a first comment, we would like to point out that unlike FACS analysis, all these methods are destructive for the cells and hence forbid their use for functional assays after their characterization. All methods involving sequencing (scRNA-‐seq, barcoding) require the cells to be lysed, and mass cytometry includes cell destruction in its processing pipeline. In addition, the methods generally provide snapshot measurements (scRNA-‐seq, mass cytometry and barcoding), with the exception of barcoding when sequential blood sample
are taken. As hematopoiesis is a dynamic process, snapshot measurements are a major limitation to be contrasted with live imaging studies.
All of these methods have been applied to study the hematopoietic tree in mice and, to a lesser extent, in monkeys and zebrafish [47]. Only scRNA-‐seq, mass cytometry and integration site barcoding have been, and can presently be, used for humans.
High dimensional measurements of single cell state
In scRNA sequencing, cells are directly extracted from tissues without further ex-‐vivo manipulation. Cells require no pre-‐sorting, avoiding categorization prior to measurement. In addition, scRNA-‐seq can be coupled with index sorting for correlation with surface phenotypic expression by FACS [19,29]. Compared with genome sequencing, scRNA-‐seq has the advantage that it provides a characterization of the part of the genome that is expressed, but only offers an incomplete picture due to limitations in read coverage. Thousands of single cells have been analysed in the most recent versions of these techniques [10]. By measuring the whole expressome, or hundreds of targeted genes, one expects to extract a higher dimensional characterization of the cell state than is available with traditional surface phenotyping expression methods such as FACS.
Mass cytometry offers a higher dimensional characterization than FACS, with the limitation that cells cannot be re-‐used after analysis. In this method, cells are analysed just after extraction from tissues without further ex-‐vivo manipulation. Mass cytometry can readily interrogate millions of cells and informs us of the surface phenotypic expression of cells as well as aspects of their intracellular expression. Neither scRNA-‐seq nor mass cytometry alone provide information on the potential of cells or their consequent outcome in vivo. By making assumptions on commitment mechanisms, both scRNA-‐seq and mass cytometry can contribute to our understanding of the topology of the hematopoietic tree, as discussed later.
Barcoding
Cellular barcoding is unbiased as its expression is not conditioned on the expression of a particular gene unlike other lineage tracing. It can follow hundreds of single cell simultaneously in vivo. Cellular barcoding involves manipulation of cells ex-‐vivo before their re-‐injection, which can affect their differentiation. These manipulations consist in extracting the progenitor or stem cells of interest from the tissue, labelling them by infection with a retro or a lentivirus for few hours in vitro. In addition, the integration of the tag into the genome could also affect the differentiation of the cell, even if no differentiation bias has been observed when integration site were analysed [39]. Another limitation is that the barcoded progenitor or stem cells, as well as the final differentiated cells, need to be sorted
by FACS, and this categorization needs to be decided in advance of the analysis. In contrast with scRNA-‐seq, the read coverage is generally good, especially if a reference library is available [13]. Cellular barcoding measures the output of individual cells, in other words what the cells do but it cannot measure what cells can do.
Most of the abilities and limitations of cellular barcoding also apply to Integration Site barcoding as it too uses viral labelling. The main difference is the read out of the barcode. IS barcoding needs to identify the DNA sequence outside of the integration site, which is more difficult than performing the specific nested PCR in cellular barcoding. Using linear PCR and restriction enzyme solve this challenge but result in a lower read coverage and causes some detection issues.
Transposon barcoding labels cells in situ, avoiding the ex-‐vivo manipulation typical to barcoding methods and therefore allowing the study of naïve murine hematopoiesis [14]. In the current published system all the cells, irrespective of their cell type, are potentially labeled, which complicates the subsequent analysis. One can readily imagine crossing the transposon barcoding mouse to strains in which the CRE expression is driven by genes specific to certain progenitors or stem cells. Like other barcoding techniques, transposon barcoding requires the sorting by FACS of the differentiated cells, but avoids the initial sorting step of progenitors and stem cells. Even if it was reported to be minor [14], transposition events occurring outside of the induction period can be a confounding factor to the lineage analysis. Transposon barcoding uses the integration site has a read out for the tag and therefore suffer from the same limitation in term of read coverage as IS barcoding. An attempt to overcome this limitation in read coverage has resulted in a lower cell detection limit, but also in the loss of the quantification information per tag [14].
Making sense of the data: the modelling and the inference methods (table 2)
These recent single cell techniques produce large volumes of data with their own distinct complexities As a result, they require the development and application of analytic methodologies for their interrogation. Each experimental technique produces entirely distinct output and every methodology introduces its own unique challenges in terms of sampling depth, experimental noise, and data filtering. Despite the specificities needed for the processing of each data source; the core of the data analysis techniques used is often detail-‐agnostic, with fundamental principles being similar, which we now describe.
High-‐dimensional single cell state data
For inference of the hematopoietic tree, there is a one common difficulty to all of the high dimensional data sources. While the tree summarizes development without explicit reference to time, hematopoiesis is a dynamic process in time and space. In the absence of time-‐course data, inferences from high dimensional data (scRNA-‐seq, mass cytometry) are
made using implicit or explicit notions of pseudo-‐time.
As a single-‐time snapshot captures cells at different stages of the development process, the fundamental premise of pseudo-‐time is that temporal development paths through these cell states can be inferred. Irrespective of the data source, the data analysis assumes that cells with the same potential cluster together, and that transitions from cells of one type to more committed types are marked by continuous changes in internal state between dense clusters. The latter property is then used to infer a differentiation tree by assuming that clusters of cells whose measured state are close to each other correspond to sequential differentiation state.
In all the tree inference methods, commitment is assumed to be a smooth function of state, with areas of high density anticipated to correspond to cell intermediates such as the previously phenotypically-‐identified cell types. Essential to that supposition is that differentiation does not lead to abrupt changes in internal cell state, that patterns that appear in early progenitors do not reappear in more committed cell types, and that cell types that are distant in the putative tree are dissimilar in terms of their cell content. There are few experimental studies on this topic, but those that have been reported suggest circumspection with regards theses assumptions. In the 1980s, analysis of hundreds of murine progenitor established that commitment to a single lineage could occur slowly and
in a stepwise manner over generations, or within just one generation [48–50]. Similarly,
single cell transplantation of the two offspring of an individual HSC after one division in vitro suggests that differentiation can occur in one division [34]. Using small populations of cells, Lare-‐Astiaso.D. et al [51] have shown that most of the genes in multi-‐potent cells transition from an open chromatin state to a compacted chromatin state in differentiated cells, but some genes follow a different pattern with de novo enhancement during differentiation. Based on these presumptions and motivated by various data sources, several inferential methodologies have been developed. All begin with a biologically and experimentally informed denoising of the data. As existing evidence strongly indicates that cell numbers become more numerous as cells lose potential, this pre-‐processing typically involves a significant renormalization of the data so that more rarely sampled cells are treated as being as important as highly sampled ones in the analysis that follows. This pre-‐processing is an important aspect of the treatment of the data and care is placed on informing it.
After experiment-‐technique specific data filtering, the first step in all analyses of high dimensional data is dimension reduction. This aims to provide substantially more succinct representations of the data with minimal loss of information. After dimension reduction, the resulting data is substantially smaller and so more suitable for computationally testing and comparing hypotheses. As inference is performed on the dimension-‐reduced data, the form of reduction can have a substantial impact on subsequent deductions.
clustering, which dramatically reduces the data to a finite collection of states; and a variety of non-‐clustered approaches that effectively project the data onto subspaces that capture the majority of the latent information. The reason for making this distinction is that there is a significant delineation in the machine learning approaches taken based on whether the data is first clustered.
Clustered data
Clustering is an unsupervised learning task that attempts to group similar objects based on similarity defined by a distance measure. It comes in two forms: flat, or partitional, clustering; and hierarchical clustering. In flat clustering, one determines in advance how many cell types one is looking for and a randomized algorithm then partitions the data into that many groups in a way that attempts to maximise the similarity within a group, and minimize the similarity between groups. Clearly the outcome of this process is heavily dependent on how many clusters one seeks.
Hierarchical clustering provides a tree of nested groupings and comes in two forms. In agglomerative hierarchical clustering, each data point starts out in its own cluster and clusters are merged sequential way based on their similarity to form a hierarchy of relationships. In divisive hierarchical clustering the data all starts in one cluster, which is then sequentially broken up to form a distinct hierarchy of nested relationships. After these processes, if the clustered data is to be analysed further, one must decide at what level the clustering is to be considered, and so as with flat clustering the number of groups of interest must be determined.
From this discretised data, a tree is typically then inferred by the adoption and adaptation of phylogenetic approaches developed for evolutionary biology. The following provides a non-‐ exhaustive set of examples of these approaches applied to clustered data from distinct sources of high dimensional single cell methods applied to hematopoiesis.
For high-‐volume mass cytometry data, Qui et al, and Bendall et al [11,52] developed an end-‐ to-‐end algorithm called SPADE (Spanning-‐tree Progression Analysis of Density-‐Normalized Events) based on hierarchical clustering of down-‐sampled data followed by the determination of a minimum spanning tree. That is, the tree which links all the clusters but has the shortest total distance along its links, with the anzats being that differentiation corresponds to a sequence of small changes in state. For massively parallel scRNA-‐seq data, Paul et al [19] clustered down-‐sampled data, with subsequent manual curation for the specific identification of small clusters. Index sorting flow cytometry is used to compare the resulting groups with cell surface marker defined cell types.
With the ultimate intent of providing a method to identify stem cells from scRNA-‐seq data, Grun et al. [53] created a method for tree inference and applied it to data from systems include murine hematopoiesis. Their approach is to use Pearson correlation as a measure of
similarity and to perform flat clustering using k-‐medoids, a variant of the classical k-‐means clustering that allows non-‐Euclidean distances and identifies cluster centres with a member of the dataset. Links are drawn between all pairs of cluster centres and each cell in the data is projected onto the link that it lies closest to. The network of connections between cluster centres is then pruned by assuming that if a link has substantially more cells assigned to it than one would expect by chance, it corresponds to a differentiation pathway. Identification of the root node of the network, the stem cell, relies on the biological assumption that the transcriptome of a multi-‐potent cell is more uniform than that of a differentiated cell. A combination of the median empirical Shannon entropy of a cluster, as a measure of divergence from uniformity, along with the number of links is combined into a metric from which the putative root is determined.
Motivated by general issues in lineage inference from single cell data, Giecold et al [54] have introduced a suite of publically available code called ECLAIR (Ensemble Cell Lineage Analysis with Improved Robustness). The basic principle of ensemble learning is that if there is no reason to believe any one method will outperform any other, then integrating deductions across several of them is a good strategy. In this instance, the data is sampled using either uniform or density dependent sampling, and then clustered with different methods. The maximum average normalised mutual information of the clusters is evaluated by several clustering methods, with the best selected for further processing. A complete weighted graph is formed amongst the consensus clusters, with edge weights corresponding to Euclidean distances, and a minimum spanning tree is inferred. The approach has been applied to hematopoietic data, but primarily for purposes of demonstrating its abilities rather than for the deduction of new biological knowledge. When applied to mass spectrometry data [11], improved robustness in tree reconstruction over SPADE is shown. In order to apply the approach to scRNA-‐seq data taken from [19], the authors performed an additional initial dimensional reduction step on the data by Principal Component Analysis. Applied to the resulting dimensionally reduced data, ECLAIR analysis largely recapitulates the findings of the original paper.
Non-‐clustered data
The alternative approach to clustering is to begin with the non-‐discretised data and to essentially project it onto a lower dimensional space, then simultaneously identifying areas of density with links between them. While there are some standard techniques to achieve this dimensional reduction, such as Independent Component Analysis, which attempts to project the data onto a smaller number of statistically independent co-‐ordinates, several distinct methodologies have been employed in the study of single cell hematopoietic data. Judicious pre-‐processing of the data is still required to account for the known rarity of more multi-‐potent progenitors, but the dimension reduction performed is lesser. For inference of paths, the post reduction data typically necessitates methodologies that are distinct from those used in phylogenetics.
For illustration, again we provide a non-‐exhaustive collection of representative work. For scRNA-‐seq data, Trapnell et al [55] introduced an unsupervised learning algorithm, Monocle, that takes the raw data and assumes that transitions from progenitor to one of several committed cell types is marked by a smooth shift in transcriptional state. Rather than using clustering, less substantial state space reduction is achieved by independent component analysis. Monocle then determines a minimum spanning tree on the resulting low-‐ dimensional projection of cell state. Motivated by mass cytometry data, Bendall et al [56] develop an algorithm called Wanderlust that aims to find single paths, rather than branching trees, through high dimensional data. Dimensional reduction is achieved by considering the cells as vertices, selecting a collection of cells uniformly at random as waypoints, and constructing, for some fixed number of neighbours, random k-‐nearest neighbour graphs through which biased random walks from a source to destination are considered. The output trajectory is set to the average over an ensemble of graph trajectories. With general high-‐dimensional single-‐cell data in mind, Haghverdi et al [57] have designed a method based on a well-‐established machine learning technique called diffusion maps [58]. The essential underlying idea is again to consider the relatedness of cells as determined by a random walk across neighbours within a given distance, which provides the dimension reduction, with cell densities determining drift directions. Meta-‐stable states, i.e. collections of cells where the random walker spends long periods of time circulating before moving on, are then identified as groups, with the most likely trajectories between them indicating differentiation transitions. An advantage of this diffusion map view is that the identifications of groups and connections between them can be achieved directly by spectral analysis of the Markov chain described by the random walk, without resorting to Monte Carlo (i.e. stochastic simulation) methods, and general properties of the algorithm can be mathematically established.
As a general comment on high dimensional data, there is no biological reason to believe, a priori, that any of the machine learning and phylogenetic inference approaches discussed here is superior, though minimalistic data reduction before inference holds intrinsic appeal. While the pre-‐processing steps of each of the above methods are all data-‐type dependent, the fundamental principles guiding the analysis of the post-‐processed data are the same and the methods could each be adapted for data of each type. Of note, all the approaches make a common assumption that commitment is a smooth function of state, while the other suppositions that distinguish the different methods are driven more by questions of computational feasibility, the presence of an existing formalism and so forth, rather than any biological reasons. Finally, one should think of the inferred tree as a hypothesis to be confirmed by other means, rather than as a definitive deduction. In particular, the
assumption of continuous commitment needs further biological clarification.
Barcoding data
tracing experiments has been more limited, with most papers reporting observations and deductions directly from data. This may, in part, be the case due to the natural applicability of developments from existing clustering, phylogenetic and machine learning approaches to high dimensional data, while inference from lineage data require distinctive techniques. Motivated by cellular barcoding data from non-‐self-‐renewing cells, we developed a method to determine if a network is consistent with the data [36]. It is assumed that barcoded cells begin with the potential to make a collection of phenotypically defined terminally differentiated cell types and there is an unknown directed network, which need not be a tree, of cell intermediaries with restricted potential. Cells are assumed to proliferate and differentiate stochastically in the network independently of their lineage and independently of each other until a combination of terminally differentiated cells is produced. Thus initially barcoded transient progenitors ultimately produce a probabilistic pattern of terminally differentiated barcoded cell combinations that can, using results from cascade processes (Good, 1949), be determined explicitly as a function of the network’s parameterization. For each putative network, the best fit proliferation and differentiation probabilities are determined numerically, and statistical consistency with the data checked. Based on those assumptions, the method enables the statistical rejection of proposed networks.
For non-‐transient populations, assuming sequential blood samples of the output from IS barcoded progenitors, Goyal et al [59] developed a mathematical model with a simplified network consisting of HSCs, pooled transit-‐amplifying progenitor cells, and fully differentiated nucleated blood cells. The aim is not to challenge the hematopoietic tree or the sequential output from individual clones, but to better understand the evolution of the clone-‐size distribution.
Also motivated by long term, repeat blood samples, IS barcoding data, though in humans rather than macaques, Biasco et. Al [12] used a suite of techniques to interrogate their data. By assigning a Bayesian network to each, the relative ability of two putative hematopoietic hierarchies to describe the data was first tested. Each lineage’s data is the read count found with distinct cell types, as determined by cell surface markers, and the Bayesian network asserts conditional independencies between read counts of certain cell types. One can then determine the likelihood of the data given a network, and identify which network of conditional dependencies better describes the data. In Biasco et. Al [12], Bayesian Information Criterion (BIC) was employed to assess which network provided a better description of the data. To encode a preference for a parsimonious description, the BIC score is based on a combination of the likelihood of the data given the network and a penalization term based on the number of free parameters of the model. To infer a hematopoietic network within the constraints of the preferred Bayesian network, and differentiation rates between cell types, a Markovian stochastic model is described in which times to divide, die and differentiate between cell types are assumed to be independent exponentially distributed random variables that are cell-‐type dependent, but lineage-‐