Publisher’s version / Version de l'éditeur:
Vous avez des questions? Nous pouvons vous aider. Pour communiquer directement avec un auteur, consultez la première page de la revue dans laquelle son article a été publié afin de trouver ses coordonnées. Si vous n’arrivez pas à les repérer, communiquez avec nous à [email protected].
Questions? Contact the NRC Publications Archive team at
[email protected]. If you wish to email the authors directly, please see the first page of the publication for their contact information.
https://publications-cnrc.canada.ca/fra/droits
L’accès à ce site Web et l’utilisation de son contenu sont assujettis aux conditions présentées dans le site LISEZ CES CONDITIONS ATTENTIVEMENT AVANT D’UTILISER CE SITE WEB.
Internal Report (National Research Council of Canada. Division of Building
Research), 1983-10
READ THESE TERMS AND CONDITIONS CAREFULLY BEFORE USING THIS WEBSITE.
https://nrc-publications.canada.ca/eng/copyright
NRC Publications Archive Record / Notice des Archives des publications du CNRC : https://nrc-publications.canada.ca/eng/view/object/?id=94d8b642-9b7e-4ef6-8bbe-8e0f5e045f46 https://publications-cnrc.canada.ca/fra/voir/objet/?id=94d8b642-9b7e-4ef6-8bbe-8e0f5e045f46
NRC Publications Archive
Archives des publications du CNRC
For the publisher’s version, please access the DOI link below./ Pour consulter la version de l’éditeur, utilisez le lien DOI ci-dessous.
https://doi.org/10.4224/40001320
Access and use of this website and the material on it are subject to the Terms and Conditions set forth at
Fire tests on reinforced concrete columns: specimen no. 2
National
ResearchConseil national
Council
Canada
de
recherchesCanada
FIRE TESTS ON REINFORCED CONCRETE COLUMNS, SPECIMEN NO. 2 by T.T. Lie and
T.D.
LinNRO
-
C I S T ILIBRARY,
B l s L i o r ~ Z ~ e t ~
CNmC
-
$;:BTPrivate copy for:
DBR Internal Report 479
NATIONAL
RESEARCH COUNCIL OF CANADA DIVISION OF BUILDING RESEARCHOBR INTERNAL REPORT NO. 4 7 9
FIRE TESTS ON REINFORCED CONCRETE COLUMNS, SPECIMEN NO. 2 by
T.T.
Lie andT.D.
LinCheckedby:
T.Z.H.
Approved by: L.
W.
Gold Date: October 1 9 8 3Prepared for: Record Purposes
ABSTRACT
Results of a fire test on a reinforced concrete column are given. The test is one of a series of twelve tests carried out in the first phase of a joint study on the fire performance of concrete
columns
by
the National Research Council Canada and the PortlandCement Association. The column was made with siliceous aggregate.
Its section size was 305 x 305 mm (12 x 12 in.). It was tested
to study the influence of moisture on the fire resistance of the column.
FIRE TESTS ON REINFORCED CONCRETE COLUMNS
SPECIMEN NO. 2
T. T. Lie and T. D. Lin*
Tests were carried out on a series of reinforced concrete columns
as part of a study to develop methods for the determination of the fire
resistance of such columns. The study was a cooperative effort between
the National Research Council Canada and the Portland Cement
Association. In the first phase of the study 12 columns were tested.
The columns were designed and manufactured by PCA in Skokie, U.S.A.,
and tested in the NRCC laboratories in Canada. The specimens, method
of testing and test results are described in successive reports.
This report deals with specimen No. 2, which was tested to study
the influence of moisture on the fire resistance of the column. It was
tested in a nearly dry state under a load equal to that on a similar
but normally conditioned test column (specimen No. 9).
TEST SPECIMEN
The test specimen consisted of a square tied reinforced concrete
column. Details of the specimen and its fabrication are given below.
Dimensions
Section size: 305
x305
mm(12
x12 in.)
Height: 3810
mm(12 ft 6 in.)
Materials
Cement: Type
I,
a general purpose cement for the construction of
reinforced concrete structures.
Aggregate: Siliceous sand and gravel from Eau Claire, Wisconsin.
The maximum size of the aggregate was 19
mm(314 in.).
The gradation
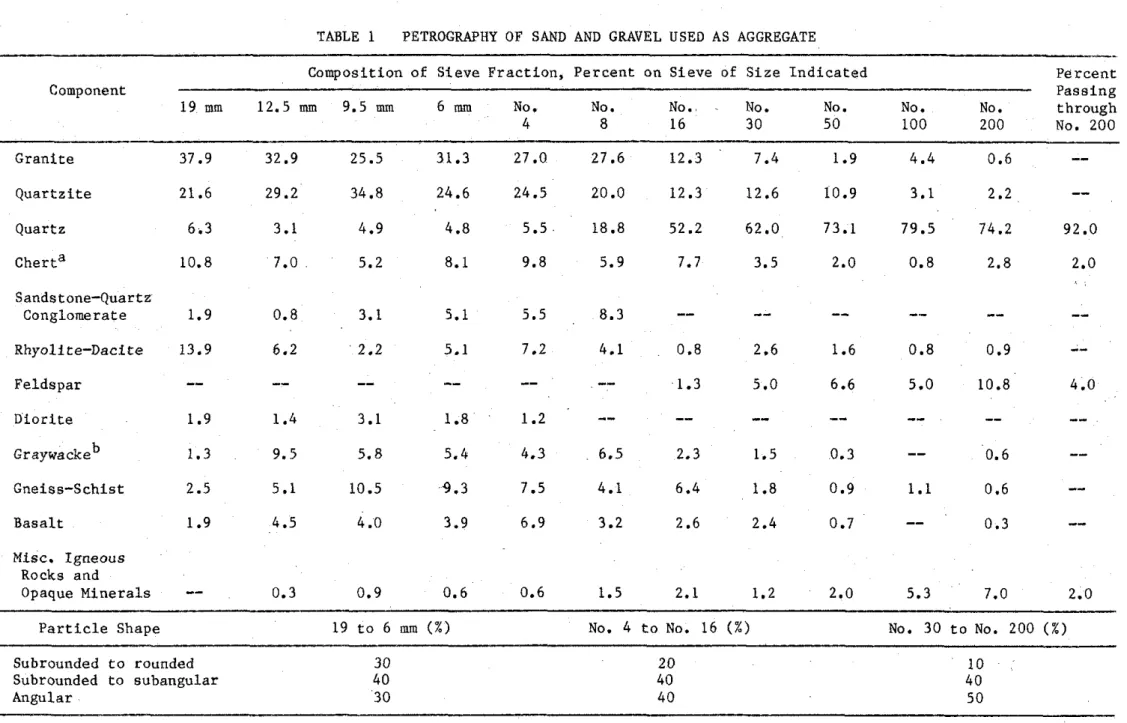
curve is shown in Figure 1. Petrographic information on the aggregate,
obtained according to
ASTM
~295-79l,
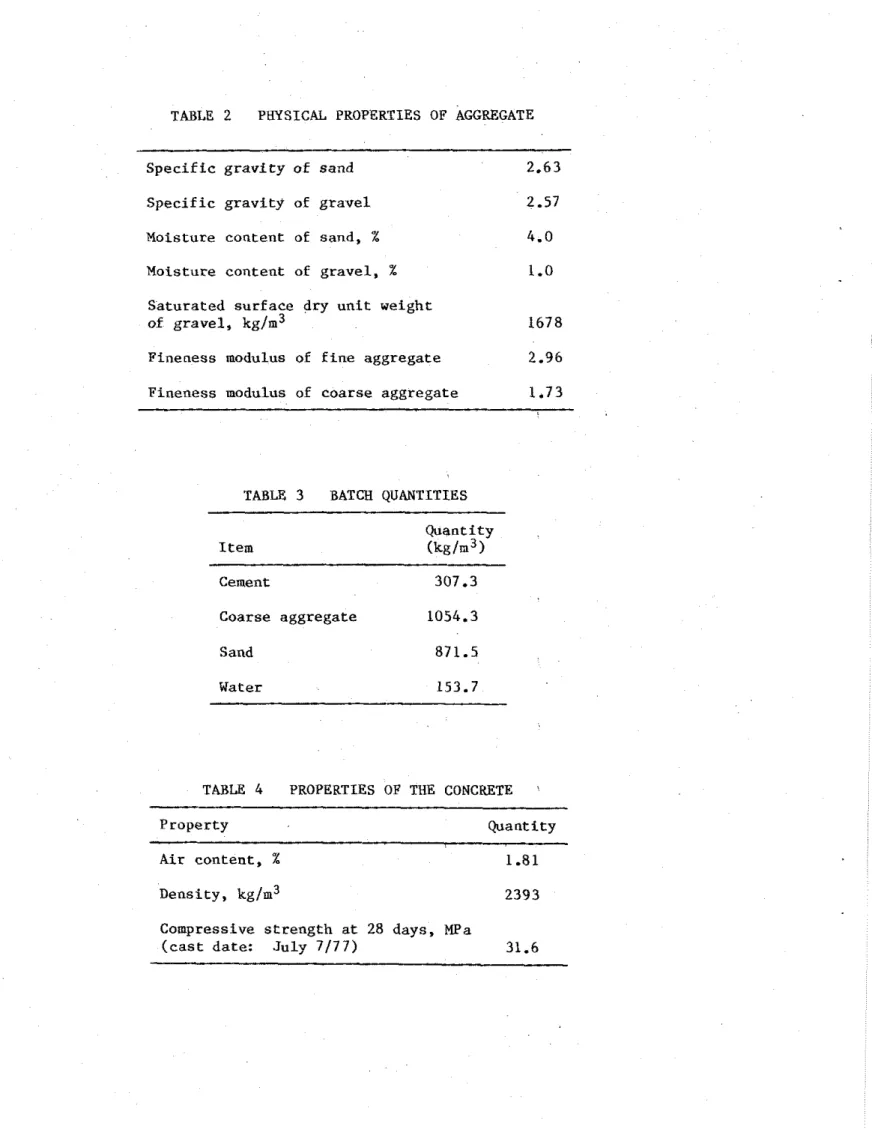
is given in Table 1. The physical
properties of the aggregate are given in Table 2.
Steel reinforcement: Deformed 25M (No.
8)
longitudinal
reinforcing bars and 10M (No. 3) ties meeting the requirements of ASTM
Designation ~615-602
were used. The yield strength of the 25M bars was
443.7 MPa (64.3 ksi) and that of the 10M bars 426.5 MPa (61.8 ksi).
*Senior research engineer, Portland Cement Association, Skokie,
Concrete mix: The concrete mix was designed to produce a 34.5 MPa
(5000 psi) strength nowairentrained concrete. A watercement ratio
of 0.6 was used. The slump was 10
mm(3.92 in.
). Batch quantities aregiven in Table 3 and measured properties of the concrete in Table 4.
Fabrication
Cas
tin&
The column was cast in a specially designed form. At the start of
the casting the front side of the form was left open for depositing
fresh concrete. The concrete was mixed in a 0.17 m5 (6 ft3) tilting
drum mixer. Shovels and scoops were used to deposit concrete in the
form. A small internal vibrator was applied to consolidate the
concrete.
As
the casting progressed upwards, the window pieces were
successively closed and tightly bolted to the form to avoid possible
moisture leaks. Lifting hooks were embedded on opposite sides of the
test specimen at 800 mm (2 ft 7 112 in.) from the top of the column. A
cylindrical humidity wells with a diameter of
4
mm (5132 in.) was
positioned at mid-height of the column for measuring the relative
humidity at mid-depth.
Reinforcing cage
The reinforcing cage was assembled by welding each end of four
longitudinal main reinforcing bars to a steel end plate. The bars were
cut to 3800 mm (12 ft 5 112 in.) and machined at both ends, for a
length of
19
mm (314 in.) to a diameter of 12.7 mm (112 in.).
Figure 2
shows details of the finished bars. The dimensions of the end plates
were 533
x533
x25
mm(21
x21
x1 in.).
In each corner of the plate,
20.6 cm holes (13116 in.) were drilled to accommodate the longitudinal
bars. The centers of the holes were spaced 92.1 mm (3 518 in.) from
the centerlines of the plates. In this way a column was obtained with
a section of 305
x305
mm(12
x12 in.) and a cover of 47.6
mm(1 718 in.) to the main reinforcing bars and 38.1 mm (1 112 in.) to the
stirrups. The main bars and stirrups were tied together to complete
the steel cage which, including the steel plates, was 3810
mm(12 ft 6 in.) long.
Welding
The provisions of AWS Designation ~12.1-75' were followed when
welding plates and bars. These members were preheated with a propane
torch to 288°C (550°F), to prevent brittle failure during welding. The
side fillet weld was done around bars on the inner face of the bottom
plate. McKay E10018-D2 and DYTRON-579 welding rods were used. Both
types of welding rods have tensile strength of 834.9 MPa (121
000
psi).
Mild-steel welding rods were used to fill up the
6
mm (114 in.) deep
holes on the outer faces of the plate. The rough surfaces of the
welded joints on the outer face of the plate were ground to a smooth
finish.
The top steel plate was welded after the casting of the columns.
Before positioning the top plate, a
6
m m(114 in.) layer of mortar was
spread over the top of the column to ensure good contact between steel
and concrete. The mortar was made of one part cement and three parts
siliceous sand. Using the same procedure as for the bottom plate, the
top plate was welded on the outer side to the bars and smoothed.
Curing
The concrete was cured under damp burlap for seven days at 21 to
24°C (70 to 75OF).
The form was then stripped, and the column kiln-
dried at about 93OC (200°F) and 0 to 5% relative humidity. The column,
which was to be tested at a nearoven-dry condition, was removed from
the kiln periodically to cool at 23-C (73OF) so that the relative
humidity in the concrete could be measured. Moisture content in the
column during the drying period is given below.
Days after
Relative humidity
casting
center of column (%)
One hundred forty-five days after the column was cast, the near
dry condition was reached, and the column was wrapped in plastic to
prevent absorption of moisture from the environment.
Thermocouples
Butt-welded chromel-alumel thermocouples 0.912
mmthick
(0.0359 in.) were used to make thermocouple frames for measuring
concrete temperatures at different locations in various cross sections
of the columns. Each frame consisted of a number of thermocouples tied
to steel rods that were firmly secured to the main reinforcing bars.
The thermocouples were arranged to measure temperatures at three
levels: at one-quarter height, at mid-height and at three-quarter
height of the column. At mid-height the temperatures were measured
along the whole length of a centerline and a diagonal of the section;
at the other two levels the temperatures were measured only along half
of the centerline and half of the diagonal of the section. The
locations of the thermocouples in the concrete and their numbering are
shown in Figures 3 and 4.
In addition, a number of thermocouples were mounted on the
reinforcing steel bars and ties. The locations of the thermocouples on
the steel are shown in Figure 5 and in more detail in Figure
6.All
thermocouples were installed in such a way that the wire followed an
isotherm for at least 12.7
mm(112 in.) from the junction.
Test Apparatus
The test was carried out by exposing the column to heat in a
furnace specially built for testing loaded columns and walls. The test
furnace was designed to produce the conditions to which a member might
be exposed during a fire; for example, fire temperatures, structural
loads, and heat transfer. It consists of a steel framework supported
by four steel columns with the furnace chamber inside the framework
(Fig.
7
)
.
The characteristics and instrumentation of the furnace are
described in detail in reference 5. Only a brief description of the
furnace and the main components will be given here.
Loading
Device
Three hydraulic jacks produce forces along the three principal
axes. The jack acting along the axis of the test column is located at
the bottom of the furnace chamber. The plate on top of this jack can
be used as a platform to which the coJurnn can be attached.
Furnace Chanber
The furnace chamber has a floor area of 2642
x2642 mm
(8 ft 8 in.
x8 ft 8 in.) and is 3058
mm (10 ft) high.
It
is made of
insulating materials that will produce a high heat transfer to the
specimen. There are 32 propane gas burners in the furnace chamber,
arranged in eight columns, containing four burners each. The total
capacity of the burners is 4700 kW (16
xloo
Btulh).
Each burner can
be adjusted individually to obtain a high temperatura uniformity in the
furnace chamber. The pressure in the furnace chamber is also
adjustable. It was set somewhat lower than atmospheric pressure.
Instrumentation
The furnace temperatures were measured with the aid of eight
chromel-alumel thermocouples. The junction of each thermocouple was
located 305
m m(1 it) from the test specimen, at various heights. Two
thermocouples were placed opposite each other every 610
mm(2 ft) along
the height of the furnace chamber. Thq locations of their junctions
and their numbering are shown in Figure 8. Thermocouples Nos. 4 and 6
were located at a height of 610
mm (2 ft) from the floor, thermocouples
Nos. 2 and 8 at 1220
mm
(4
ft), thermocouples Nos. 3 and 5 at 1830 mm
(6 ft) and thermocouples Nos. 1 and 7 at 2440
mm (8 ft).
The
temperatures measured by the thermocouples were averaged automatically
and the average temperature was used as the criterion for controlling
the furnace temperature.
The loads were controlled and measured with pressure transducers.
The accuracy of controlling and measuring loads was about 5% at lower
load levels and better at higher loads.
The axial deformation of the test specimen was determined by
measuring the displacement of the jack that supports the column. The
displacement was measured using transducers with an accuracy of 0.002 mm.
Test Conditions and
ProcedureThe column was i n s t a l l e d i n t h e furnace by b o l t i n g i t s end p l a t e s t o a loading head a t t h e t o p and a h y d r a u l i c jack a t t h e bottom. For t h i s purpose e i g h t 19 mm (314 in.) b o l t s spaced r e g u l a r l y around t h e column 63.5
mm
(2 112 i n . ) from t h e s i d e s were used a t each end.No humidity reading was taken on t h e day of t h e t e s t . Previous measurement with a Monfore gaugea showed, however, t h a t t h e moisture condition of t h e column, which was wrapped i n p l a s t i c , did not change w i t h time. Therefore i t was assumed t h a t a t t h e t e s t d a t e t h e r e l a t i v e humidity i n t h e c e n t e r of t h e column would be approximately 15%. t h e value found i n t h e previous measurements.
The column was c a s t on 7 July, 1977 and t e s t e d on 19 June, 1981. It was subjected t o a load of 1333 kN (300 k i p s ) applied about one hour before t h e t e s t . A t t h e t e s t d a t e , t h e cylinder s t r e n g t h s of t h e
concrete measured on two c y l i n d e r s were 37.3 MPa (5402 p s i ) and 36.6 MPa (5305 p s i ) respectively.
During t h e t e s t t h e column was exposed t o heating c o n t r o l l e d s o t h a t t h e average temperaure i n t h e furnace followed a s c l o s e l y a s p o s s i b l e t h e ASTM-E119O or ULC-S101' standard temperature-time curve. This curve can be approximately described by t h e following equation:'
T f = 20
+
750 11-exp(-3.79553mj+
1 7 0 . 4 1 6 ( 1 ) whereTf = tymperature i n OC, and
T = time i n h
T f = 68
+
1350 11-exp(-3.79553Ji)I+
306.74G ( 2 ) whereTf
= temperature i n OF.During t h e t e s t , temperatures i n t h e furnace and i n t h e column were measured a t t h e l o c a t i o n s described e a r l i e r . The a x i a l
deformation of t h e column was a l s o measured. The column was considered t o have f a i l e d and t h e t e s t was terminated when t h e h y d r a u l i c jack, which has a maximum speed of 76 mmlmin ( 3 in./min), could no longer maintain t h e load.
TEST RESULTS
Measured Temperatures and Deformations
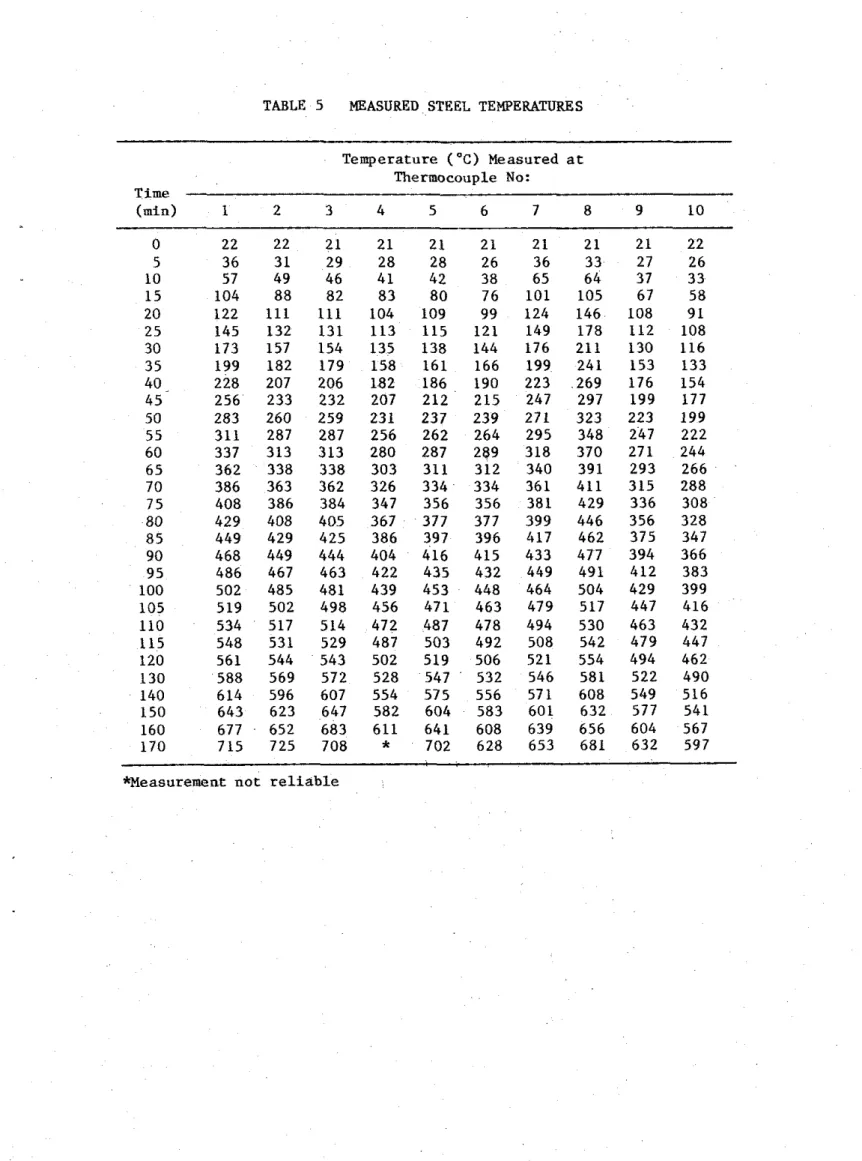
The temperatures measured during t h e t e s t a t various l e v e l s on t h e r e i n f o r c i n g s t e e l and i n t h e concrete s e c t i o n s a r e given i n Tables 5
and 6A-D. I n Table 5 t h e s t e e l temperatures a r e given f o r v a r i o u s
times, The temperatures measured i n t h e concrete s e c t i o n s a r e given i n Tables 6A-D.
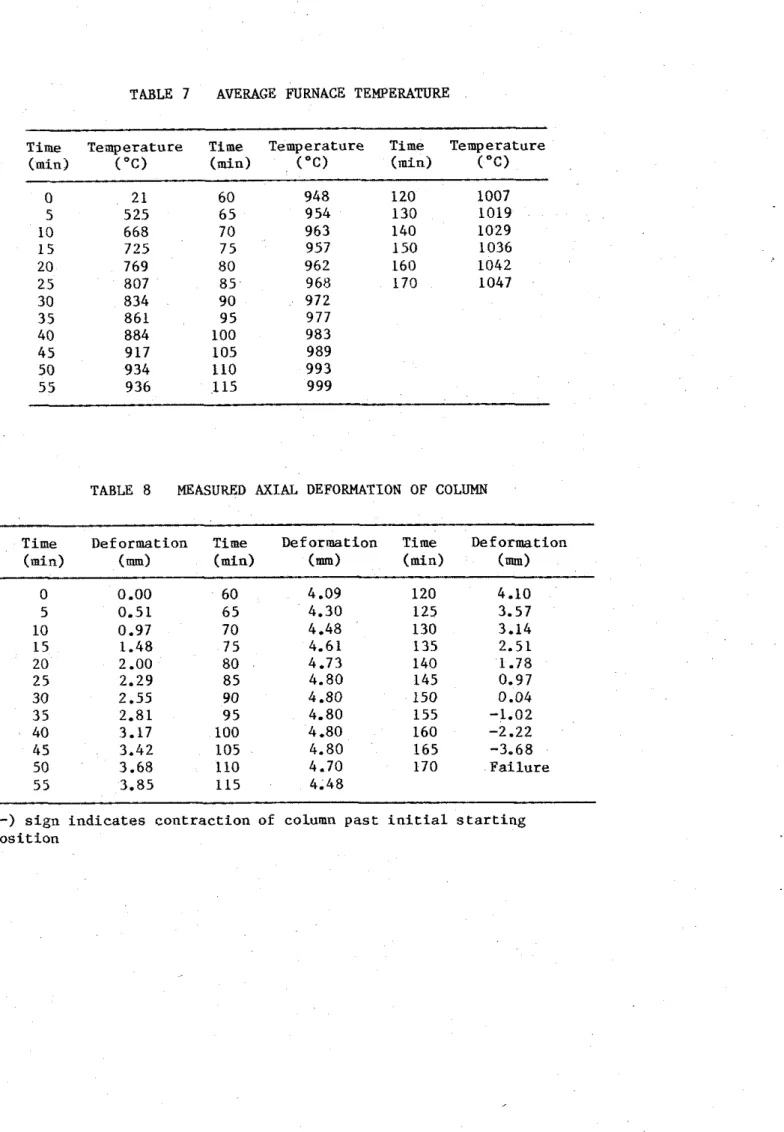
I n Table 7 t h e average furnace temperature and i n Table 8 t h e measured a x i a l deformation of t h e column a r e given f o r various times during t h e t e s t .
Observations
The observations made during t h e t e s t a f t e r v a r i o u s exposure times a r e given below.
50 min: H a i r l i n e cracks were observed on a l l f a c e s s i m i l a r t o t h a t shown on t h e south f a c e i n Figure 9.
130 min: Wider cracks could be seen on a l l faces. They a r e shown i n Figure 10. These cracks v a r i e d i n l e n g t h from approximately 150 mm (6 in.) t o 300
mm
(12 in.) and i n width fromapproximately 1.6 mm (1/16 in.) t o 4.8 mm (3116 in.). 150 min: The r a t e of c o n t r a c t i o n of t h e column increased r a p i d l y . 170 min: Sudden f a i l u r e of column. The load on t h e column could no
longer be maintained. Cracks and f a l l i n g off of t h e cover were observed a s i l l u s t r a t e d i n F i g u r e 11.
I n Figure 12 t h e column is shown a f t e r t h e t e s t .
DISCIJSSIOM
OFRESULTS
The method described i n r e f e r e n c e 9 was used t o c a l c u l a t e t h e temperatures of t h e main r e i n f o r c i n g s t e e l , and t h e temperatures a t various depths i n t h e concrete s e c t i o n s . For t h e r e i n f o r c i n g s t e e l t h e temperature a t t h e c e n t e r h a s been chosen a s r e p r e s e n t a t i v e of t h e average temperature of t h e s t e e l . This temperature has been p l o t t e d and compared i n Figure 13 w i t h t h e average temperatures obtained from measurements on two r e i n f o r c i n g bars during t h e t e s t . These
measurements were made w i t h thermocouples Nos. 3 and 9 , l o c a t e d opposite each o t h e r with respect t o t h e c e n t e r of one bar, and w i t h thermocouples Nos.
4
and 10, l o c a t e d opposite each o t h e r on another b a r(see Fig. 6). The comparison between measured average s t e e l
temperatures and t h e temperatures i n t h e concrete s e c t i o n a t t h e c e n t e r of t h e s t e e l , c a l c u l a t e d according t o t h e method described i n reference
The temperatures measured on t h e s t e e l by t h e i n d i v i d u a l
thermocouples a r e shown i n Figure 14. The d i f f e r e n c e i n temperature between two opposite p o i n t s of t h e bar i s r e l a t i v e l y small.
The temperatures shown i n Figure 15 were measured along a c e n t e r l i n e i n t h e concrete s e c t i o n a t mid-height a t various depths. The curves show good agreement between measured and c a l c u l a t e d
temperatures.
I n
Figure 16 t h e measured a x i a l deformation during t h e t e s t and t h o s e c a l c u l a t e d u s i n g t h e method described i n r e f e r e n c e 9 a r e shown. Up t o about 60 min, t h e r e i s good agreement between measured andc a l c u l a t e d a x i a l deformations. After t h i s , however, t h e measured a x i a l deformations a r e somewhat higher than those predicted. The measured f a i l u r e time of 170 min i s a l s o somewhat higher than t h e p r e d i c t e d f a i l u r e time of about 150 min. The comparison of measured and c a l c u l a t e d temperatures, deformations and f a i l u r e times shows t h a t although t h e p r e d i c t i o n s l i e on t h e s a f e s i d e , t h e d i f f e r e n c e s between them and t h e a c t u a l measurements a r e r e l a t i v e l y small.
1. S t a n d a r d P r a c t i c e f o r P e t r o g r a p h i c Examination of A g g r e g a t e s f o r C o n c r e t e (1979). ASTM C295-79, American S o c i e t y f o r T e s t i n g a n d
Materials, P h i l a d e l p h i a , PA.
2. S t a n d a r d S p e c i f i c a t i o n f o r Deformed and P l a i n B u l l e t - S t e e l Bars f o r C o n c r e t e Reinforcement (1980). ASTM A615-80, American S o c i e t y f o r T e s t i n g and Materials, P h i l a d e l p h i a , PA.
3 . Monfore, G.E. (1962). A Small Probe-Type Gauge f o r Measuring R e l a t i v e Humidity. J o u r n a l o f t h e PCA R e s e a r c h and Development L a b o r a t o r i e s , Vol. 5, NO. 2.
4. R e i n f o r c i n g S t e e l Welding Code (1975). AWS-D12.1-75, American Welding S o c i e t y , M a n l i u s ,
NY.
5. L i e , T.T. (1980). New F a c i l i t y t o Determine F i r e R e s i s t a n c e o f Columns, Canadian J o u r n a l of C i v i l E n g i n e e r i n g , Vol. 7, No. 3.
6. S t a n d a r d Methods of F i r e T e s t s of B u i l d i n g C o n s t r u c t i o n and
Materials (1979). ANSIIASTM E119-79, American S o c i e t y f o r T e s t i n g and M a t e r i a l s , P h i l a d e l p h i a , PA.
7. S t a n d a r d Methods of F i r e Endurance T e s t s of B u i l d i n g C o n s t r u c t i o n and Materials (1 980). ULC-S1 01-Ml980. U n d e r w r i t e r s ' L a b o r a t o r i e s of Canada, Scarborough, O n t a r i o .
8. L i e , T.T. and Harmathy,
T.Z.
(1972). A Numerical P r o c e d u r e t o C a l c u l a t e t h e Temperature o f P r o t e c t e d S t e e l Columns Exposed t o F i r e . F i r e Study No. 28, D i v i s i o n of B u i l d i n g R e s e a r c h , N a t i o n a l R e s e a r c h C o u n c i l o f Canada, Ottawa, O n t a r i o , NRCC 12535.9. L i e , T.T., A l l e n , D.E., L i n , T.D. and Ahrams, M.S. F i r e R e s i s t a n c e of R e i n f o r c e d C o n c r e t e Columns, D i v i s i o n of B u i l d i n g R e s e a r c h , N a t i o n a l Research C o u n c i l of Canada, Ottawa, t o be p u b l i s h e d .
TABLE
1PETROGRAPHY
OFSAND AND GRAVEL USED AS AGGREGATE
Composition of Sieve Fraction, Percent on Sieve of Size Indicated
Percent
Component
Passing
19
mm
12.5 mm 9.5 mm 6 mmNo.
No.
No.
No.
No.
No.
No.
through
4 8 16 30 50 100 200
No.
200Granite
37.9Quartzite
21.6Quartz
6.3cherta
10.8Sandstone-Quartz
Conglomerate
1.9Rhyolite-Dacite
13.9Feldspar
--
Diorite
1.9 1.4 3.1 1.8 1.2--
--
--
--
--
--
--
Graywacke
b
1.3
9.5 5.8 5.4 4.3 6.5 2.3 1.5 0.3--
0.6--
Gneiss-Schist
2.5 5.1 10.5 4.3 7.5 4.1 6.4 1.8 0.9 1.1 0.6--
Basalt
1.9 4.5 4 .O 3.9 6.9 3.2 2.6 2.4 0.7--
0.3--
Mist.Igneous
Rocks and
Opaque Minerals
--
0.3 0.9 0.6 0.6 1.5 2.1 1.2 2.0 5.3 7.0 2.0Particle Shape
19to
6mm
( % )No.
4to No.
16 ( % )No.
3 0to No.
200 ( % )Subrounded to rounded
Subrounded to subangular
Angular
a"~ronstone,"
made up of jasper and hematite, is included in the chert classification.
b~ncludes
metagraywacke.
he
miscellaneous igneous rocks were severely altered and positive identification was impossible. The opaque minerals occurred
in the No.
50and smaller sieve sizes and were largely magnetite.
TABLE 2 PWSICAL PROPERTIES OF AGGREGATE S p e c i f i c g r a v i t y of sand 2.63 S p e c i f i c g r a v i t y of g r a v e l 2.57 Moisture c o n t e n t of sand, % 4.0 Moisture c o n t e n t of g r a v e l , % 1.0 S a t u r a t e d s u r f a c e dry u n i t weight of g r a v e l , kg/m3 1678 Fineness modulus of f i n e aggregate 2.96 Fineness modulus of c o a r s e aggregate 1.73
TABLE 3 BATCH QUANTITIES Q u a n t i t y Item ( k g / n 3 ) Cement 307.3 Coarse aggregate 1054.3 Sand 871.5 Water 153.7
TABLE 4 PROPERTIES OF THE CONCRETE '
P r o p e r t y Quantity
A i r c o n t e n t , % 1.81
Density, kg/m3 2393
Compressive s t r e n g t h a t 28 days. MPa
TABLE 5 MEASURED STEEL TEMPERATURES T i m e ( m i d 0 5 10 15 20 2 5 30 3 5 40 45 50 5 5 60 65 70 75 80 85 90 9 5 100 105 110 115 120 130 140 150 160 170 T e m p e r a t u r e ( O C ) M e a s u r e d a t T h e r m o c o u p l e N o : 1 2 3 4 5 6 7 8 9 10 * M e a s u r e m e n t not reliable
TABLE 6A CONCRETE TEMPERATURES ElEASURED WITH THERMOCOUPLES I N FRAME A T e m p e r a t u r e (OC) Measured a t Thermocouple No: Time (min) 1 1 12 1 3 1 4 1 5 16 17 1 8 19 20 2 1 22 23 24 0 22 22 22 22 22 22 22 22 22 22 22 22 22 2 2 5 1 2 8 9 3 5 3 37 27 2 3 22 23 29 42 8 2 116 242 179 10 222 164 101 66 33 24 2 3 25 3 8 87 151 208 350 304 1 5 304 229 1 4 0 9 9 4 6 27 2 3 2 8 6 4 129 217 294 453 405 20 373 288 182 128 64 32 25 36 102 161 281 371 529 482 25 434 342 223 159 9 4 4 3 29 5 5 1 0 8 204 338 434 595 548 3 0 487 389 261 187 1 0 4 59 3 5 6 5 117 251 390 489 649 598 3 5 5 3 1 428 294 213 112 66 44 7 3 1 3 3 292 436 538 693 626 40 567 463 324 238 121 73 5 3 82 153 328 476 583 732 699 4 5 607 498 3 5 3 263 136 8 3 72 9 2 174 361 511 627 772 739 50 641 529 381 287 151 9 3 84 105 195 392 545 664 8 0 5 756 5 5 6 6 3 554 407 309 166 104 9 3 111 217 420 579 696 8 2 3 795 60 686 578 431 331 181 111 100 118 239 446 611 724 842 817 6 5 704 600 4 5 3 3 5 1 197 1 2 1 106 131 260 470 638 747 8 4 2 832 70 720 618 473 369 212 134 112 147 281 492 665 768 816 844 7 5 732 634 492 387 226 146 1 1 5 161 302 512 687 786 767 852 8 0 743 648 508 403 241 158 123 174 321 530 704 799 771 858 8 5 754 662 524 418 256 169 1 3 3 187 341 547 719 812 772 865 9 0 765 674 538 433 270 181 144 199 358 564 734 823 759 866 9 5 776 687 552 448 284 192 156 212 376 581 747 8 3 3 752 864 100 786 698 566 462 298 210 166 226 393 596 759 843 748 776 1 0 5 797 710 5 8 0 476 313 216 177 238 409 609 771 882 748 774 110 806 720 5 9 4 489 327 228 187 251 426 623 782 861 748 776 115 816 731 607 502 341 241 199 264 442 637 792 869 749 777 120 826 742 619 515 354 253 211 277 457 649 802 877 751 778 1 3 0 8 4 7 763 6 4 5 539 381 278 234 302 486 673 821 889 754 779 140 865 784 669 564 407 303 259 326 512 696 838 896 753 781 150 8 8 1 802 691 589 433 331 291 349 536 717 8 5 1 906 753 784 160 8 9 3 817 711 616 460 372 348 371 559 602 858 768 763 777 170 903 829 729 646 491 448 433 392 584 755 763 762 767 794
TABLE 6B CONCRETE TEMPERATURES MEASURED WITH THERMOCOUPLES I N FRAME B T e m p e r a t u r e (OC) M e a s u r e d a t T h e r m o c o u p l e No: T i m e (min) 25 26 27 28 2 9 3 0 31 32 3 3 3 4 3 5 36 37 3 8 % e a s u r e r n e n t not r e l i a b l e
TABLE 6C CONCRETE TEMPERATURES MEASURED WITH THERMOCOUPLES I N FRAME C T e m p e r a t u r e (OC) Measured a t Thermocouple No: Time (min) 39 40 4 1 42 4 3 44 45 46 47 48 49 5 0 5 1 5 2 0 22 22 22 22 22 22 22 22 22 22 2 2
*
2 3 2 3 5 1 4 4 100 52 37 26 22 22 2 3 29 4 3 8 7*
194 277 10 267 192 103 72 33 24 22 24 42 98 167*
363 472 1 5 358 266 1 5 5 1 0 8 5 0 26 2 3 2 8 78 132 248*
472 578 20 433 333 204 148 100 34 25 35 110 176 316*
546 6 5 3 25 494 388 2 5 1 186 1 0 8 5 3 30 57 119 222 372*
606 709 30 541 434 2 9 1 219 1 0 8 64 40 77 140 264 423*
655 752 3 5 582 474 327 250 112 7 2 5 5 8 6 162 304 471*
710 789 40 618 507 358 278 1 2 8 8 2 66 9 3 186 342 514*
751 827 4 5 659 542 389 303 147 9 1 74 1 0 3 2 1 1 3 7 5 5 5 3*
721 8 6 8 50 692 573 417 328 163 102 8 3 103 235 406 5 9 3*
741 892 5 5 712 598 444 3 5 1 181 105 9 9 111 259 436 628*
756 901 60 733 620 466 372 196 117 102 1 2 5 283 462 658*
771 9 1 5 6 5 751 640 4 8 8 3 9 1 212 129 105 140 306 487 686*
784 926 70 767 650 506 409 228 141 109 154 328 509 7 0 8*
792 934 7 5 775 672 524 426 244 152 121 167 348 530 729*
*
*
8 0 785 685 538 442 258 163 129 179 369 549 744*
x*
8 5 795 697 553 457 273 174 141 192 388 567 759*
*
*
9 0 805 709 567 471 287 187 151 206 406 585 772*
*
*
9 5 814 720 581 484 3 0 3 199 1 6 3 219 423 601 784*
*
*
100 824 731 593 498 316 211 173 232 441 616 796*
*
*
1 0 5 834 739 607 511 332 224 186 246 456 631 806*
*
*
110 842 751 618 523 345 237 196 259 473 644 8 0 8*
*
A 115 8 5 1 762 632 536 361 249 209 272 487 657 745*
*
*
120 8 6 1 772 643 547 374 262 221 285 502 669 749*
*
*
1 3 0 8 8 0 794 667 573 401 287 245 311 528 692 756*
x*
140 897 814 690 599 429 312 268 336 554 715 759*
x*
1 5 0 9 1 0 8 3 1 711 622 455 337 292 360 580 736*
*
*
*
160 922 846 729 644 481 360 316 383 605 754*
x*
*
1 7 0*
*
*
x*
*
3 4 0*
6 2 1*
*
*
*
*
*Measurement n o t r e l i a b l eTABLE 6D CONCRETE TEMPERATURES MEASURED WITH THERMOCOUPLES IN FRAME D
Temperature (OC) Measured at Thermocouple No: Time ( m i d 5 3 54 55 56 57 5 8 59 6 0 6 1 62 6 3 64 65 6 6 0 22 22 22 22 22 22 22 21 22 2 1 2 1
*
*
2 1 5 124 8 8 5 3 3 5 26 2 3 2 3 22 27 39 76*
*
252 10 234 174 109 66 32 24 23 2 3 37 9 1 159*
*
452 1 5 324 248 158 102 47 27 24 27 6 9 136 239*
*
5 6 6 20 402 316 209 137 72 32 26 35 106 177 309*
*
651 25 468 377 257 172 99 56 32 55 112 233 3 6 5*
*
710 30 521 426 299 204 109 74 4 3 7 3 126 282 414*
*
756 3 5 5 6 3 467 334 232 117 8 2 54 8 3 1 4 8 3 2 5 463*
*
794 40 603 507 367 256 131 87 64 9 3 172 363 508*
*
8 3 1 4 5 644 543 398 278 147 9 3 7 3 103 197 397 548*
*
8 4 3 5 0 677 577 427 299 162 102 8 2 112 222 427 590*
*
8 5 0 5 5 697 602 452 320 1 7 8 1 1 0 9 3 121 245 455 626*
i*
6 0 717 624 474 338 193 116 104 133 268 481 654*
*
*
6 5 734 644 494 3 5 5 208 123 111 147 290 504 682*
*
x 70 749 662 512 371 223 134 116 160 312 526 704*
~t R 7 5 759 676 528 387 237 146 119 1 7 3 332 545 724*
*
*
8 0 769 688 543 401 252 159 125 187 353 565 741*
*
*
8 5 779 699 556 416 267 172 1 3 8 201 372 5 8 3 756*
*
*
9 0 790 711 570 430 282 186 151 214 391 600 769*
*
*
9 5 8 0 0 722 5 8 3 444 297 199 1 6 3 228 408 616 782*
*
*
100 8 1 1 733 596 459 311 212 174 242 426 631 794*
*
*
105 8 2 1 744 609 474 326 226 1 8 6 256 441 6 4 5 8 0 5*
*
*
110 824 754 621 488 341 239 198 269 457 658 8 1 5*
*
x 1 1 5*
764 633 502 355 252 211 283 472 671 825*
x*
120*
774 646 517 370 265 223 296 487 683 834*
*
*
1 3 0*
795*
550 404 291 249 322 513 705 8 5 3*
*
it 140*
814*
593 448 316 285 347 536 726 869*
*
A 150*
830*
638 500 339 343 371 5 6 1*
8 8 3*
*
*
160*
831*
671 547 363 414 394 586*
*
*
x*
170*
*
*
692 577 394 468 421 607*
k*
*
*
TABLE
7 AVERAGE FURNACE TEMPERATURETime Temperature T i m e Temperature Time Temperature ( min ) ("C) (min) ("C) ( m i d ("C) 0 21 60 948 120 1007 5 525 65 9 54 130 1019 10 668 70 963 140 1029 1 5 725 75 957 150 1036 20 769 80 962 160 1042 25 807 8 5 9 68 170 1047 30 834 90 972 35 861 9 5 977 40 884 100 983 45 917 105 989 50 934 110 993 5 5 936 115 999
TABLE 8 MEASURED AXIAL DEFORMATION OF COLUMN
Time Deformation Time Deformation Time Deformation ( m i d (mm) ( m i d (m) ( m i d (mm) 0 0.00 60 4.09 120 4.10 5 0.51 6 5 4.30 125 3.57 10 0.97 70 4.48 130 3.14 15 1.48 75 4.61 135 2.51 20 2.00 80 4.73 140 1.78 2 5 2.29 8 5 4.80 145 0.97 30 2.55 90 4.80 150 0.04 3 5 2.81 9 5 4.80 155 -1.02 40 3.17 100 4.80 160 -2.22 45 3.42 105 4.80 165 -3.68 50 3.68 110 4.70 170 F a i l u r e 5 5 3.85 115 4.48
-
s i g n i n d i c a t e s c o n t r a c t i o n of column p a s t i n i t i a l s t a r t i n g p o s i t i o nS T A N D A R D S I Z E O F S Q U A R E M E S H S I E V E F I G U R E
1
P L A T E
P L A T E
F I G U R E
2
TIC
F R A M E A23
S E C T I O N A - ATIC
F R A M E B O N B A C K9
TIC
F R A M E C O N F R O N T S E C T I O N B - BTIC
F R A M ETIC
F R A M ED
A
S E C T I O N C - C H = 3810 m m F I G U R E3
L A Y O U T OF T H E R M O C O U P L E F R A M E ST/
c
FRAME 16 15 14 13 12 11 A30
29 28 27 26 25 B 44 43 42 41 40 39 C 58 57 56 55 54 53 D F I G U R E 4 L O C A T I O N A N D N U M B E R S OF T H E R M O C O U P L E S I N A S E C T I O Nr 4 8 mrn CLEAR COVER TO BAR
~ ' T / c1. 2. 3, 9 9 5 rnm
533 x 533 x 25 rnm
THICK STEEL PLATE 7
F I G U R E 5
F I G U R E 6
FIGURE 7 TEST FURNACE
F I G U R E 8
L O C A T I O N A N D N U M B E R S O F T H E R M O C O U P L E S I N C O L U M N F U R N A C E C H A M B E R
E A S T N O R T H W E S T S O U T H V I E W V
l
EW V I E W V I E W F U R N A C E C E I L I N G F U R N A C E F L O O R1
F I G U R E9
N ,/ %' H A I R L I N E C R A C K S A F T E R50
rnin O N A L L F A C E S OF C O L U M N N O .2
S I M I L A R T O T H O S E O N T H E S O U T H F A C EE A S T N O R T H W E S T S O U T H
V I E W V I E W V I E W V l EW
' I G U R E 10
E A S T N O R T H W E S T S O U T H
V I E W V I E W V I E W V l E W
F I G U R E
11
L O C A T I O N O F T H E W I D E S T C R A C K S A N D O F S P A L L E D C O N C R E T E D l R E C T L Y A F T E R F A I L U R E
FIGURE 12
COLUMN SPECIMEN AFTER TEST
"
CALCULATED,,
LC CL 3-
P: "MEASURED, AVERAGE TIC 3,9
w
a
=
L u MEASURED. AVERAGE TIC 4.10
C 0
I
I 0 1 0 0 2 0 0 3 0 0 T I M E , m i n F I G U R E 1 3 C A L C U L A T E D A N D M E A S U R E D A V E R A G E T E M P E R A T U R E S OF M A l N R E I N F O R C I N G B A R S F I G U R E 14 T E M P E R A T U R E S M E A S U R E D O N M A l N R E I N F O R C I N G B A R S 1 0 0 0 o LC CL =1 P: w a=
LC C II
T H E R M O C O U P L E NO. 3 4 9 1 0; -
0 0/
1 0 0 2 0 0,
3 0 0 T I M E , r n ~ n1 0 0 0 I I