HAL Id: cea-02506821
https://hal-cea.archives-ouvertes.fr/cea-02506821
Submitted on 12 Mar 2020
HAL is a multi-disciplinary open access
archive for the deposit and dissemination of
sci-entific research documents, whether they are
pub-lished or not. The documents may come from
teaching and research institutions in France or
abroad, or from public or private research centers.
L’archive ouverte pluridisciplinaire HAL, est
destinée au dépôt et à la diffusion de documents
scientifiques de niveau recherche, publiés ou non,
émanant des établissements d’enseignement et de
recherche français ou étrangers, des laboratoires
publics ou privés.
PAREX, a numeric code for plant operation aid
B. Dinh, M. Montuir, C. Sorel, J. Bisson, C. Huel
To cite this version:
B. Dinh, M. Montuir, C. Sorel, J. Bisson, C. Huel. PAREX, a numeric code for plant operation aid.
Global 2015 - International Fuel Cycle Conference, Sep 2015, Paris, France. �cea-02506821�
PAREX, a numerical code for plant operation aid B. Dinh1, M. Montuir1, C. Sorel1, J. Bisson2, C. Huel2
(1) CEA, Nuclear Energy Division, Radiochemistry and Process Department F- 30207, Bagnols-sur-Cèze, France,
[email protected], [email protected], [email protected]
(2) AREVA NC, La Hague Plant, Technical Department, 50444 Beaumont-Hague, France, [email protected]
[email protected], [email protected]
The PAREX code has been widely used for process design used for the flowsheet design of the purification cycles of the La Hague plant build for nuclear fuel treatment. This paper focused on the use of the code as an aid for plant operation through two application examples. The first one is related to on site flow sheet available margin evaluation of the extraction zone of a first cycle flow sheet. The second example concern the plutonium stripping operation of a plutonium cycle, where the code has been used to explain the shift of plutonium leak in the solvent outlet observed.
I. SCOPE
The modelling approach chosen for process design that led to the PAREX code has been presented in previous communications, especially the qualification of the code obtained by systematic comparison of the code simulation results with experimental data provided by appropriate tests in pilot plant or exploitation results collected from industrial plants [1][2]. Thus, the PAREX code appeared to be an useful tool for process design thet has been widely used for the flow sheets of solvent extraction workshops of the La Hague plants UP3 and
UP2-800[3].
The PAREX code is also used, on industrial site, as an aid for the operation of solvent extraction purification cycle. One the most common application is related with safety analysis of plant operation, by giving a mean to determine the operating margin available, towards the risk of leak of matter - uranium and/or plutonium- and plutonium build-up and also estimate the time available to perform corrective actions on the process in case of the occurrence of a malfunction. As the code can simulate the process operation, it can be used to explain the performance shift of an extraction operation. A decrease of transfer efficiency of a plutonium stripping operation in the second plutonium cycle has been explained by simulation using the PAREX. This study helps to decide appropriate corrective action that permit the recovery of the initial mass transfer performance of the column. This
two cases are developed to illustrate the aid provided by simulation using the PAREX code.
II. Sensitive analysis of solvent extraction purification flow sheets.
Flow sheet for the treatment of a specific fuel in an solvent extraction workshop, systematically undergoes a sensitivity analysis to determine the impact of operating parameters deviation from their nominal value, on the process behavior, especially in regard of the risks of plutonium leakage and buil-up. This analysis, performed using the PAREX code, consists mainly in two steps. II.A Operating margin determination
The first step aims to determine the available operating margin for each operating parameter. This value is the deviation of the considered parameter from its nominal value, all others remaing unchanged, beyond which a leak of plutonium occurred, preceded by a plutonium build-up. This value is determined, by calculating the process steady-state using the PAREX code, for increasing level of deviation, the other parameters remaining unchanged.
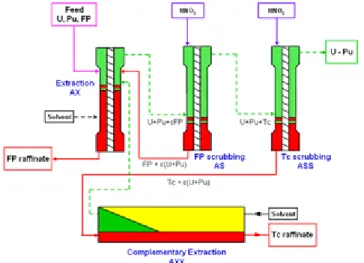
Figure 1. Extraction zone of the first putification cycle flow sheet
To illustrate these calculations, we consider the extraction zone of the fist purification cycle of La Hague plant, which flow sheet is shown Figure 1. Feed solution containing the dissolution liquor is introduced in the extraction column (AX). The loaded solvent is treated in the srubbing column (AS). The loaded solvent is further treated in the technetium scrubbing column (ASS). Uranium and plutonium contained in the aqueous outlet of this latter is recovered in the complentary extraction operation (AXX) which is a mixer-settlers bank. The solvent outlet of AXX is headed back to the extraction column.
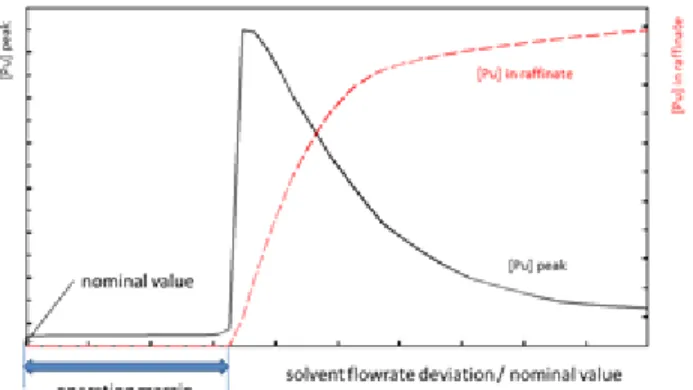
Figure 2 shows the results of the calculations done to determine the operating margin available for the flowrate of the solvent introduced in the extraction column. Beyond the operating margin shown in the chart, the plutonium concentration in the raffinate increases significantlty. An important plutonium build-up represented by the evolution of plutonium peak concentration shown in the same chart slightly preceeds plutonium leakage.
Figure 2. Plutonium peak concentration and plutonium leak in the raffinate in case of extraction
solvent flowrate decrease
These calculations also helps to identify the process measurements that reflect the process status, thus worth monitoring for an efficient control of process operation .
Figure 2. Identification of process status indicators
Figure 3 shows that plutonium concentration as well as density of aqueous outlet of the scrubbing column have both an evolution similar to the peak plutonium concentration shown before, and thus are process status parameters to be monitored.
Operating parameters can be classified on the base of the operating margin, calculated as shown just before, the most sensitive ones having the lowest operating margin. II.B Dynamic analysis of severe malfunction
The second step of the sensitive analysis is a study of the dynamic of the process following the occurrence of a malfunction leading to plutonium leakage and build-up. This study is usually performed for the most sensitive operating parameters. Severe deviation are then applied, far beyond the operating margin calculated. Transient calculations are performed using the PAREX code, to apprehend the dynamic of the process. These calculations allows also to verify that the monitored process measurements chosen allow a reliable detection of any drift of the process towards an plutonium buid-up and leakage, sufficiently early to correct the process.
Figure 4 shows the evolutions of the plutonium peak concentration and plutonium concentration in the raffinate of the extraction column, in the case of a sharp decrease of the solvent flowrate of the extraction column.
Figure 3- Plutonium leakage and build up in case of sharp decrease of extraction solvent flow rate Figure 5 shows that the density and the plutonium concentration of the aqueous outlet of the scrubbing column permit an early detection of the malfunction.
Figure 4- Process status indicators evolution in case of sharp decrease of extraction solvent flow rate II.B. Equivalence rules for parameters deviation impact
Operating margin evaluation
Complementary studies have recently been conducted on La Hague site to determine the impact on the process behavior operating deviations involving more than one operating parameter, to complete the results of the analysis presented above.
The uranium and plutonium extraction capability of the flow sheet is governed by the extraction factor E of the extraction operation, which formula is
E = O/A х D
O and A being the organic and aqueous flowrate and the partition coefficient. Thus operating deviations leading to decrease the O/A phase ratio or the partition coefficient can lead to plutonium build-up in the contactors and plutonium leakage. Decrease of solvent flowrate introduced in the extraction column, for example, decrease the organic to aqueous phase ratio but also the uranium and plutonium partition coefficient due to higher loading of the solvent phase.
Figure 5- Operating parameters deviations for a defined plutonium concentration in the raffinate
(2mg/L)
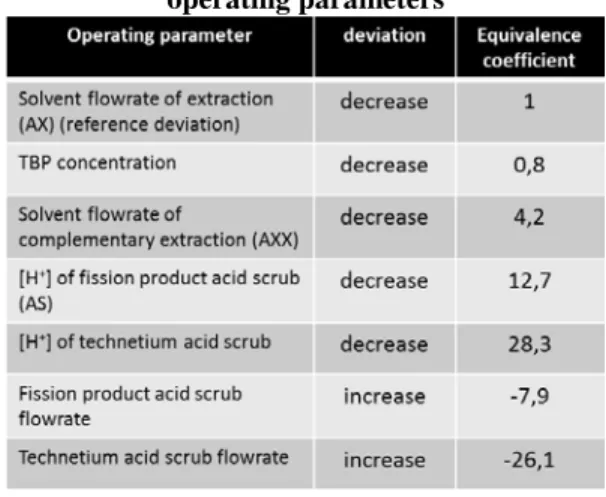
Figure 5 shows that the evolution of the plutonium concentration in the extraction raffinate due to deviation of different operating parameter are quite similar. They all sharply increase near the operating margin followed by a smoother increase until an equilibrium value is reached. They just differ by the level of deviation needed to observe this evolution, that correspond to their respective margin, depending on the impact of each parameter on the extraction factor E. We can etasblish equivalence rules between the deviation of the different operating parameters by considering the level of deviations to apply to the different parameters to obtain the same impact on the process, thus the same plutonium leakage in extraction raffinate. Let us consider the solvent flowrate of the extraction operation (AX) as basis, name the corresponding deviation RD, expressed in % of its nominal value that lead to the considered level of plutonium leakage. For the solvent flowrate of the complementary extraction (AXX), the same level of leakage will be obtained with a deviation of 4,2 RD. For the scrub flowrate (AS), the equivalent deviation is -7,9RD (cf.Table 1). For this less sensitive parameter, a greater deviation is needed, and the minus sign indicates that it’s an increase instead of a decrease of the parameter. Thus, an equivalent coefficient can be established for all the operating parameters.
Table 1. Example of equivalence coefficient for operating parameters
Dynamic simulation of malfunction
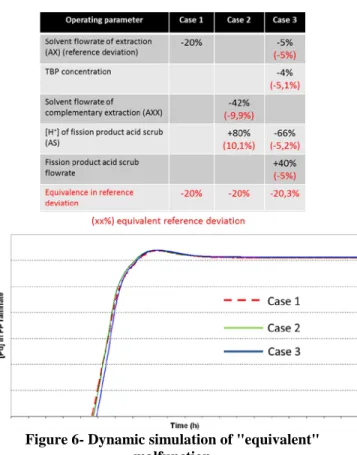
The equivalence rules also works for the dynamic simulation of severe malfunction. Three cases were considered, detailed in Table 2, all equivalent to a decrease of -20% of solvent extraction flowrate. The
dynamic simulation of the process responses are quite similar, as shown in Figure 1
Hence, it is possible to estimate the operating margin available when several parameters deviates from their nominal value, without performing extra simulation work to estimate quite precisely the available operating margin (steady-state calculations) as well as the dynamic response in the process using the available results of the sensitive analysis of the flow sheet.
Table 2- Equivalent cases of operating parameters deviation.
Figure 6- Dynamic simulation of "equivalent" malfunction
III. Operation analysis with the PAREX code The PAREX code can also be used to analyze industrial exploitation results with a troubleshooting purpose. In the following, we briefly describe the analysis done using the code to treat a slight decrease of efficiency of a plutonium stripping operation , operated in a pulsed column.
This function is part of the second plutonium purification cycle of the UP3 plant in La Hague.
Figure 7- 2nd plutonium purification flow sheet
Figure 7 represents the flow sheet of the considered workshop. The plutonium aqueous feed of the cycle is reduced plutonium at (III) oxidation state is treated succescively in an oxidation column feeded with nitrous vapors and a degassing column to remove the excess nitrous acid produced in the oxidizing test. The solvent loaded with plutonium produced by the extraction and scrbbing columns is introduced in the plutonium stripping column. Plutonium is reduced by hydroxylamine nitrate and back extracted in the aqueous phase. A plutonium barrier downstream the stripping column ensures very low plutonium concentration in the solvent outlet the plutonium stripping zone.
Exploitation results showed a drift of performance of the plutonium stripping zone, higher plutonium concentration than usual (about an order of magnitude higher, but still remaining in reasonable range) is measured, while, at the time, a decreased hydrazine in the plutonium production is noticed. This latter information indicated that the degassing operation is less efficient resulting in greater nitrous acid concentration in the loaded solvent headed to the plutonium stripping column.
The PAREX code was then used to simulate the plutonium leak in the solvent outlet of the column in order to check the possible cause to that result.
Figure 8 shows the organic plutonium concentration simulated, while Figure 9 shows aqueous hydrazine concentration profiles for different hypothesis.
The nominal profile (in black continuous line) is the profile that should be obtained in normal conditions, with good transfer efficiency of the column.
For the profile represented in red dotted line, a change in wettability of column internals was supposed tending to promote the coalescence of organic droplets (the column works in aqueous continuous phase mode) because of the degradation products of the solvent (DBP for example) that with time has recovered the surface of the column internals. This results in greater mean drop diameter, thus
poorer specific surface transfer. This can be simulated by choosing greater mean drop diameter and indeed permit to simulate the plutonium leak measured. This decrease of mass transfer efficiency, has very little effect on the hydrazine consumption (or plutonium oxidation) as the hydrazine profile still remain close to the one obtained in nominal simulation.
To simulate the decrease of hydrazine concentration in the plutonium production we have to take into account a higher nitrous acid concentration in the cycle feed, added the previous simulation. This leads to the profiles drawed in dotted blue line in Figures 8 and 9. This change has almost no effect on the simulated plutonium profile. It seems normal because the destruction of nitrous acid is very quick and the excess of nitrous acid is almost destroyed at the bottom of the column, near the solvent introduction. Thus hydrazine extra consumption and column efficiency drp seems to be two problems quite independent that are to be treated separately.
Corrective actions on the operating conditions of the de-gassing column permit to reduce the concentration of nitrous acid feeded in the cycle. Washing of the stripping colums with appropriate acidic solutions permit to retrieve a proper state for column internals and a normal plutonium concentration in the column solvent outlet. A slightly modified scheme for the plutonium stripping column has also been suggested to diminish plutonium leakage, in the lapse of time waiting for the corrective actions to be done. It consists in enhance the stripping capability of the scheme (decrease the extractipn factot of the operation) by decreasing the solvent flowrate while maintening unchanged the feed flowrate and the aqueous flowrates of the plutonium stripping operation. The resulting plutonium and hydrazine profiles are the green dotted lines in figures 8 and 9.
IV. CONCLUSIONS
This paper illustrates some examples of the PAREX code use as an aid to plant operation. The most important and common use is the work done for safety purpose, giving available operating margins as well as a good appreciation of process dynamics in case of malfunction .
Moreover, the process analysis of specific exploitation results using the PAREX code can help gaining insight on the behavior of the process and its apparatus, that can be easily capitalized, and re-used either to improve plant operation procedures or to design new plants.
ACKNOWLEDGMENTS
Our sincere thanks to AREVA NC for their financial support.
REFERENCES
1. Sorel, C., Montuir M., Balaguer C., Baron P., Dinh B., Hérès X., Pacary V., Roussel H., “A powerful tool to model and simulate solvent extraction operations”, Solvent Extraction Conference ISEC’11, October 2011 - Santiago- Chili, Chapter 3 – 103. 2. B. Dinh, M.Montuir, P. Baron, “PAREX a numerical
code for process design integration”, GLOBAL 2013 –Salt Lake City UT USA –September 2013
3. P. Baron, B. Dinh, J. Duhamet,F. Drain, F. Meze, A. Lavenu, Plutonium purification cycle in centrifugal extractors. From flowsheet design to industrial operation“, ISEC 2008 – Tucson (AZ) USA – September 2008.
Figure 8- Organic [Pu] profile simulation in plutonium stripping column
Figure 9- Hydrazine profiles simulation in plutonium stripping column
![Figure 8- Organic [Pu] profile simulation in plutonium stripping column](https://thumb-eu.123doks.com/thumbv2/123doknet/12711897.356120/6.918.482.835.247.731/figure-organic-pu-profile-simulation-plutonium-stripping-column.webp)
