HAL Id: inserm-00917086
https://www.hal.inserm.fr/inserm-00917086
Submitted on 11 Dec 2013HAL is a multi-disciplinary open access archive for the deposit and dissemination of sci-entific research documents, whether they are pub-lished or not. The documents may come from teaching and research institutions in France or abroad, or from public or private research centers.
L’archive ouverte pluridisciplinaire HAL, est destinée au dépôt et à la diffusion de documents scientifiques de niveau recherche, publiés ou non, émanant des établissements d’enseignement et de recherche français ou étrangers, des laboratoires publics ou privés.
Brain volumes in late life: gender, hormone treatment,
and estrogen receptor variants.
Joanne Ryan, Sylvaine Artero, Isabelle Carrière, Jacqueline Scali, Jerome
Maller, Chantal Meslin, Karen Ritchie, Pierre-Yves Scarabin, Marie-Laure
Ancelin
To cite this version:
Joanne Ryan, Sylvaine Artero, Isabelle Carrière, Jacqueline Scali, Jerome Maller, et al.. Brain volumes in late life: gender, hormone treatment, and estrogen receptor variants.. Neurobiology of Aging, Elsevier, 2014, 35 (3), pp.645-54. �10.1016/j.neurobiolaging.2013.09.026�. �inserm-00917086�
Table 1. Characteristics of the 582 participants according to gender a d wo e ’s use of HT.
Characteristic Males (N=287) Females (N=295)
Never HT Past HT Current HT
Median (Interquartile range: 25th– 75th percentile)
Age (years) 71 (68 to 74) 71 (68 to 75) 70 (68 to 72) 68 (67 to 71)
Body Mass Index (kg/m2) 25.6 (23.7 to 27.4) 24.1 (22.0 to 26.7) 23.9 (21.6 to 26.3) 23.2 (21.1 to 25.5)
N (%) N (%) N (%) N (%)
years of edu atio 126 (43.9) 45 (26.0) 12 (20.0) 29 (46.8)
Living alone 17 (5.9) 59 (34.1) 15 (25.0) 14 (22.6)
High al ohol o su ptio g each day) 100 (34.8) 9 (5.2) 4 (6.6) 5 (8.1)
Smoking history (10 pack year) 98 (34.2) 32 (18.5) 15 (25.0) 15 (24.2)
Current depressive symptoms (CES-D 58 (20.2) 58 (33.5) 24 (40.0) 17 (27.4) Lifetime major depressive disordera 37 (14.0) 54 (34.4) 25 (45.5) 28 (46.7)
Low global cognitive function MMSE ) 15 (5.2) 21 (12.1) 6 (10.0) 3 (4.8)
History of cardiovascular disease 58 (20.2) 36 (20.8) 8 (13.3) 6 (9.7)
Hypertension /9 Hg or treat e t 138 (48.1) 86 (49.7) 27 (45.0) 17 (27.4) Diabetes fasti g glu ose . ol/l or treat e t 37 (12.9) 12 (6.9) 1 (1.7) 0 (0.0)
Hypercholesterolemia 79 (27.6) 67 (38.7) 25 (41.7) 21 (33.9)
Anticholinergic medication 7 (2.4) 9 (5.2) 2 (3.3) 9 (14.5)
Curre t user of edi atio s 94 (32.8) 72 (44.5) 20 (33.3) 20 (32.3)
Carrier of the APOE ε4 allele 61 (21.3) 42 (24.3) 14 (23.3) 10 (16.1)
Median (Interquartile range: 25th– 75th percentile)
Volume of grey matter, cm3 684 (643 to 729) 631 (598 to 662) 630 (608 to 661) 623 (594 to 659) Ratio of grey matter to ICV 54.5 (53.4 to 56.4) 55.2 (53.8 to 56.9) 55.9 (54.6 to 57.9) 54.8 (53.2 to 55.9) Volume of white matter volume, cm3 374 (346 to 407) 339 (315 to 362) 334 (314 to 360) 342 (327 to 365) Ratio of white matter to ICV 29.8 (28.5 to 31.4) 29.6 (28.3 to 31.0) 29.3 (28.3 to 30.3) 30.4 (28.7 to 31.4) Total volume of hippocampus, mm3 5964 (5510 to 6481) 5653 (5109 to 6011) 5619 (5136 to 6114) 5572 (5231 to 6048) Ratio of hippocampus to ICV 4.7 (4.3 to 5.3) 4.9 (4.5 to 5.3) 5.0 (4.2-5.3) 4.9 (4.5-5.4) Midsagittal total corpus callosum area, mm2 609 (546 to 670) 591 (524 to 651) 574 (534 to 652) 596 (527 to 671) Ratio of corpus callosum to ICV 0.48 (0.43 to 0.54) 0.52 (0.47 to 0.57) 0.51 (0.46 to 0.58) 0.52 (0.46 to 0.60) Total volume of WML, cm3 0.8 (0.3 to 3.2) 0.60 (0.2 to 2.1) 0.80 (0.2 to 2.4) 0.45 (0.2 to 2.1) Volume of WML transformed (log10) -0.09 (-0.51 to 0.51) -0.21 (-0.68 to 0.32) -0.09 (-0.68 to 0.39) -0.34 (-0.68 to 0.32)
N (%) N (%) N (%) N (%)
a
Data were missing for 23 men and women. Sig ifi a tly differe t etwee ge ders at p . . Significantly different between women according to their use or not of HT at p . .
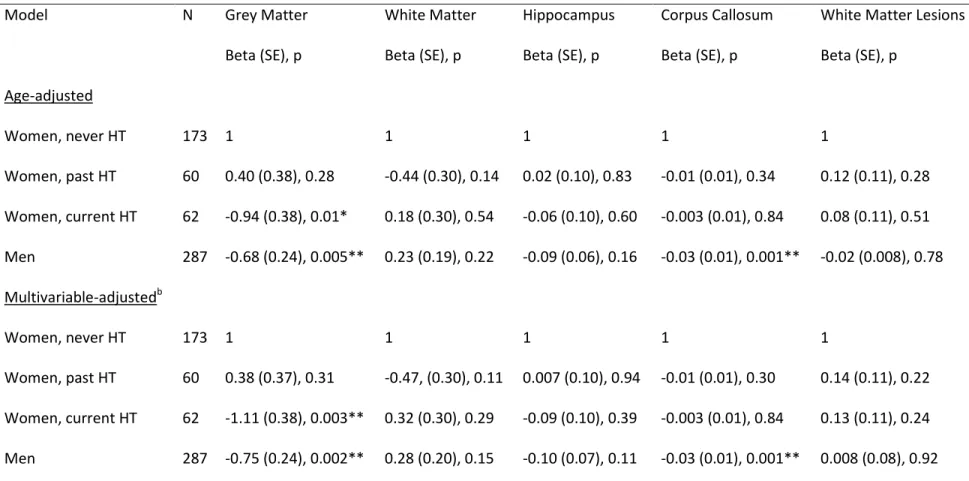
Table 2. Linear regression models for the association between brain measuresa and gender or use of HT.
a
All brain measures are given as a percentage of total intracranial volume (ICV), except for the volume of white matter lesions, which were adjusted for the volume of white matter.
b
Adjusted for age, educational level, cardiovascular disease, hypertension and number of medications *p< . ; **p .
Model N Grey Matter White Matter Hippocampus Corpus Callosum White Matter Lesions Beta (SE), p Beta (SE), p Beta (SE), p Beta (SE), p Beta (SE), p
Age-adjusted Women, never HT 173 1 1 1 1 1 Women, past HT 60 0.40 (0.38), 0.28 -0.44 (0.30), 0.14 0.02 (0.10), 0.83 -0.01 (0.01), 0.34 0.12 (0.11), 0.28 Women, current HT 62 -0.94 (0.38), 0.01* 0.18 (0.30), 0.54 -0.06 (0.10), 0.60 -0.003 (0.01), 0.84 0.08 (0.11), 0.51 Men 287 -0.68 (0.24), 0.005** 0.23 (0.19), 0.22 -0.09 (0.06), 0.16 -0.03 (0.01), 0.001** -0.02 (0.008), 0.78 Multivariable-adjustedb Women, never HT 173 1 1 1 1 1 Women, past HT 60 0.38 (0.37), 0.31 -0.47, (0.30), 0.11 0.007 (0.10), 0.94 -0.01 (0.01), 0.30 0.14 (0.11), 0.22 Women, current HT 62 -1.11 (0.38), 0.003** 0.32 (0.30), 0.29 -0.09 (0.10), 0.39 -0.003 (0.01), 0.84 0.13 (0.11), 0.24 Men 287 -0.75 (0.24), 0.002** 0.28 (0.20), 0.15 -0.10 (0.07), 0.11 -0.03 (0.01), 0.001** 0.008 (0.08), 0.92
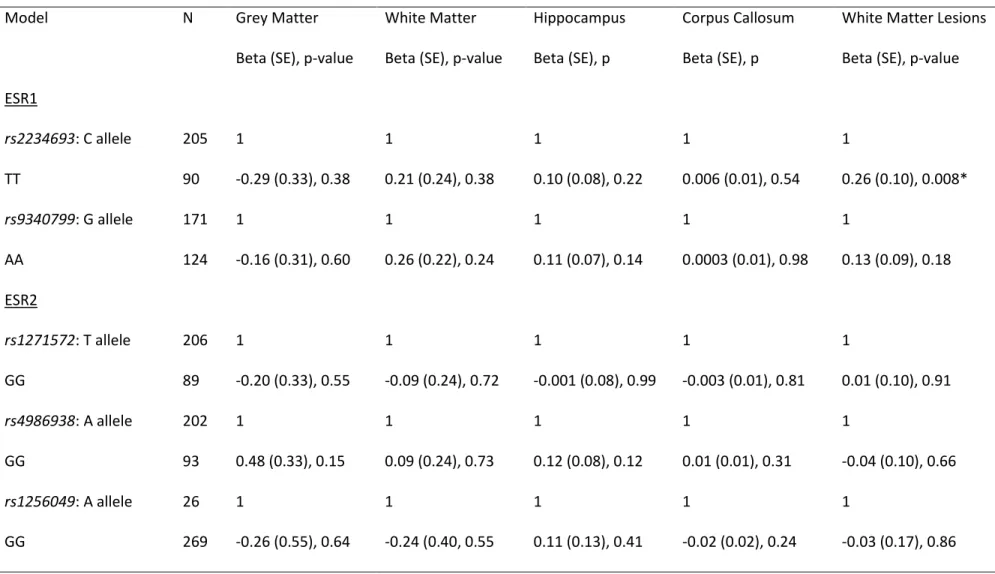
Table 3. Linear regression models for the multivariable-adjusted associationa between ESR polymorphisms and brain measuresb in women. Model N Grey Matter White Matter Hippocampus Corpus Callosum White Matter Lesions
Beta (SE), p-value Beta (SE), p-value Beta (SE), p Beta (SE), p Beta (SE), p-value ESR1 rs2234693: C allele 205 1 1 1 1 1 TT 90 -0.29 (0.33), 0.38 0.21 (0.24), 0.38 0.10 (0.08), 0.22 0.006 (0.01), 0.54 0.26 (0.10), 0.008* rs9340799: G allele 171 1 1 1 1 1 AA 124 -0.16 (0.31), 0.60 0.26 (0.22), 0.24 0.11 (0.07), 0.14 0.0003 (0.01), 0.98 0.13 (0.09), 0.18 ESR2 rs1271572: T allele 206 1 1 1 1 1 GG 89 -0.20 (0.33), 0.55 -0.09 (0.24), 0.72 -0.001 (0.08), 0.99 -0.003 (0.01), 0.81 0.01 (0.10), 0.91 rs4986938: A allele 202 1 1 1 1 1 GG 93 0.48 (0.33), 0.15 0.09 (0.24), 0.73 0.12 (0.08), 0.12 0.01 (0.01), 0.31 -0.04 (0.10), 0.66 rs1256049: A allele 26 1 1 1 1 1 GG 269 -0.26 (0.55), 0.64 -0.24 (0.40, 0.55 0.11 (0.13), 0.41 -0.02 (0.02), 0.24 -0.03 (0.17), 0.86
a
All brain measures are given as a percentage of total intracranial brain volume, except for the volume of white matter lesions, which were adjusted for the volume of white matter.
b
Adjusted for age, educational level, cardiovascular disease, hypertension and number of medications. *p< . ; **p .
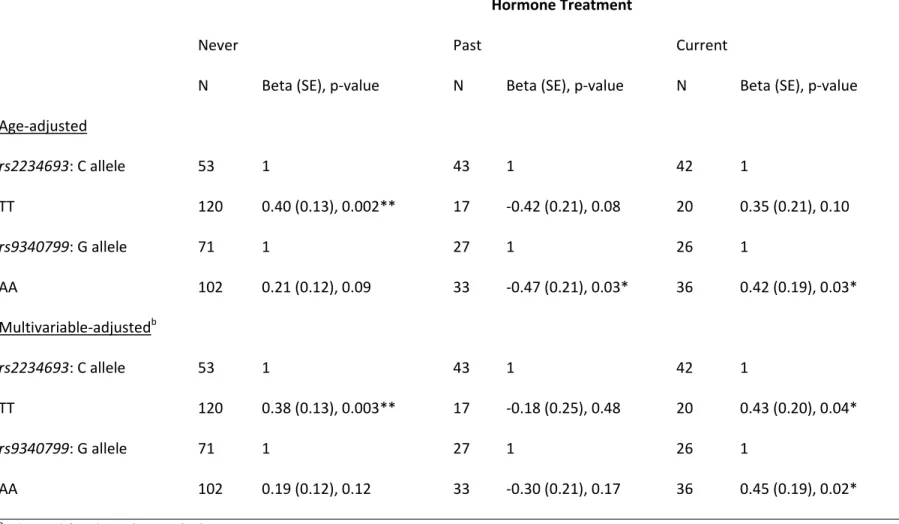
Table 4. Linear regression models for the association between ESR1 variants and white matter lesionsa in women, stratified by HT.
a
Adjusted for the volume of white matter. b
Adjusted for age, educational level, cardiovascular disease, hypertension and number of medications. *p< . ; **p .
Hormone Treatment
Never Past Current
N Beta (SE), p-value N Beta (SE), p-value N Beta (SE), p-value Age-adjusted rs2234693: C allele 53 1 43 1 42 1 TT 120 0.40 (0.13), 0.002** 17 -0.42 (0.21), 0.08 20 0.35 (0.21), 0.10 rs9340799: G allele 71 1 27 1 26 1 AA 102 0.21 (0.12), 0.09 33 -0.47 (0.21), 0.03* 36 0.42 (0.19), 0.03* Multivariable-adjustedb rs2234693: C allele 53 1 43 1 42 1 TT 120 0.38 (0.13), 0.003** 17 -0.18 (0.25), 0.48 20 0.43 (0.20), 0.04* rs9340799: G allele 71 1 27 1 26 1 AA 102 0.19 (0.12), 0.12 33 -0.30 (0.21), 0.17 36 0.45 (0.19), 0.02*
Supplementary Table 1. Linear regression model for the association between ESR1 polymorphisms and brain measuresa in men.
Model N Grey Matter White Matter Hippocampus Corpus Callosum White Matter Lesions Beta (SE), p Beta (SE), p Beta (SE), p Beta (SE), p Beta (SE), p
Age-adjusted rs2234693: C allele 79 1 1 1 1 1 TT 208 -0.33 (0.33), 0.31 -0.04 (0.28), 0.89 0.05 (0.10), 0.60 -0.02 (0.01), 0.07 -0.01 (0.10), 0.91 rs9340799: G allele 114 1 1 1 1 1 AA 173 -0.31 (0.30), 0.30 0.18 (0.26), 0.47 0.05 (0.09), 0.58 -0.01 (0.01), 0.36 -0.008 (0.09), 0.93 Multivariable-adjustedb rs2234693: C allele 79 1 1 1 1 1 TT 208 -0.35 (0.32), 0.28 -0.04 (0.28), 0.89 0.06 (0.09), 0.50 -0.02 (0.01), 0.07 -0.007 (0.10), 0.94 rs9340799: G allele 114 1 1 1 1 1 AA 173 -0.36 (0.30), 0.23 0.20 (0.26), 0.45 0.05 (0.09), 0.60 -0.01 (0.01), 0.36 0.004 (0.09), 0.97 a
All brain measures are given as a percentage of total intracranial brain volume, except for the volume of white matter lesions, which were adjusted for the volume of white matter.
b
Supplementary Table 2. Linear regression model for the association between ESR2 polymorphisms and brain measuresa in men.
Model N Grey Matter White Matter Hippocampus Corpus Callosum White Matter Lesions Beta (SE), p Beta (SE), p Beta (SE), p Beta (SE), p Beta (SE), p
Age-adjusted rs1271572: T allele 196 1 1 1 1 1 GG 91 -0.09 (0.31), 0.79 0.16 (0.27), 0.55 0.01 (0.09), 0.90 0.00 (0.01), 0.95 -0.06 (0.09), 0.53 rs4986938: A allele 176 1 1 1 1 1 GG 111 0.36 (0.30), 0.23 0.02 (0.26), 0.93 0.09 (0.09), 0.30 0.00 (0.01), 0.99 -0.05 (0.09), 0.57 rs1256049: A allele 23 1 1 1 1 1 GG 264 -0.77 (0.57), 0.19 0.49 (0.50), 0.33 -0.16 (0.18), 0.38 -0.02 (0.02), 0.29 -0.23 (0.17), 0.18 Multivariable-adjustedb rs1271572: T allele 196 1 1 1 1 1 GG 91 -0.18 (0.31), 0.56 0.16 (0.30), 0.56 -0.02 (0.09), 0.82 0.00 (0.01), 0.99 -0.04 (0.09), 0.70 rs4986938: A allele 176 1 1 1 1 1 GG 111 0.43 (0.30), 0.16 0.02 (0.26), 0.93 0.09 (0.09), 0.27 0.00 (0.01), 0.98 -0.07 (0.09), 0.44 rs1256049: A allele 23 1 1 1 1 1 GG 264 -0.68 (0.57), 0.23 0.51 (0.50), 0.30 -0.14 (0.18), 0.43 -0.02 (0.02), 0.31 0.27 (0.17), 0.11
a
All brain measures are given as a percentage of total intracranial brain volume, except for the volume of white matter lesions, which were adjusted for the volume of white matter.
b
Supplementary Table 3. Linear regression model for the age-adjusted association between ESR polymorphisms and brain measuresa in women.
a
All brain measures are given as a percentage of total intracranial brain volume, except for the volume of white matter lesions, which were adjusted for the volume of white matter. *p<0.05
Model N Grey Matter White Matter Hippocampus Corpus Callosum White Matter Lesions Beta (SE), p-value Beta (SE), p-value Beta (SE), p Beta (SE), p Beta (SE), p-value ESR1 rs2234693: C allele 205 1 1 1 1 1 TT 90 -0.28 (0.33), 0.38 0.25 (0.24), 0.30 0.12 (0.08), 0.14 0.008 (0.01), 0.46 0.24 (0.10), 0.02* rs9340799: G allele 171 1 1 1 1 1 AA 124 -0.13 (0.30), 0.66 0.29 (0.22), 0.20 0.12 (0.07), 0.11 0.00 (0.01), 0.98 0.11 (0.09), 0.23 ESR2 rs1271572: T allele 206 1 1 1 1 1 GG 89 -0.16 (0.33), 0.64 -0.17 (0.24), 0.49 0.00 (0.08), 0.99 -0.003 (0.01), 0.81 -0.004 (0.10), 0.97 rs4986938: A allele 202 1 1 1 1 1 GG 93 0.47 (0.33), 0.15 0.09 (0.25), 0.70 0.12 (0.08), 0.12 0.01 (0.01), 0.31 -0.05 (0.10), 0.62 rs1256049: A allele 26 1 1 1 1 1 GG 269 -0.32 (0.54), 0.55 -0.12 (0.40), 0.76 -0.10 (0.13), 0.46 -0.02 (0.02), 0.32 -0.04 (0.17), 0.80