HAL Id: inserm-00181396
https://www.hal.inserm.fr/inserm-00181396
Submitted on 10 Sep 2009HAL is a multi-disciplinary open access archive for the deposit and dissemination of sci-entific research documents, whether they are pub-lished or not. The documents may come from teaching and research institutions in France or abroad, or from public or private research centers.
L’archive ouverte pluridisciplinaire HAL, est destinée au dépôt et à la diffusion de documents scientifiques de niveau recherche, publiés ou non, émanant des établissements d’enseignement et de recherche français ou étrangers, des laboratoires publics ou privés.
experimentally induced liver fibrosis.
Anne Rullier, Jennifer Gillibert-Duplantier, Pierre Costet, Gaëlle Cubel,
Valérie Haurie, Cyril Petibois, Danièle Taras, Nathalie Dugot-Senant,
Paulette Bioulac-Sage, Jean Rosenbaum
To cite this version:
Anne Rullier, Jennifer Gillibert-Duplantier, Pierre Costet, Gaëlle Cubel, Valérie Haurie, et al.. Protease-activated receptor 1 knockout reduces experimentally induced liver fibrosis.. AJP - Gas-trointestinal and Liver Physiology, American Physiological Society, 2008, 294 (1), pp.G226-35. �10.1152/ajpgi.00444.2007�. �inserm-00181396�
Protease-activated receptor 1 (PAR-1) knock-out reduces experimentally-induced liver
fibrosis.
Anne Rullier1, 2, Jennifer Gillibert-Duplantier1, Pierre Costet3, Gaëlle Cubel1,, Valérie Haurie1, Cyril Petibois4, Danièle Taras1, Nathalie Dugot-Senant1, Paulette Bioulac-Sage1, 2 and Jean Rosenbaum1.
1INSERM, U889, Bordeaux, F-33076 France; IFR 66, Université Victor Segalen Bordeaux 2,
Bordeaux, F-33076 France
2CHU de Bordeaux, Hôpital Pellegrin, Department of Pathology, Bordeaux, F-33076 France 3Université Victor Segalen Bordeaux 2, Animalerie spécialisée, Bordeaux, F-33076 France 4CNRS, UMR5084, Bordeaux, F-33076 France ; Université Victor Segalen Bordeaux 2,
Bordeaux, F-33076 France.
Key words : liver fibrosis, hemostasis, thrombin, hypoxia, lymphocytes
Running head : PAR-1 knock-out protects against liver fibrosis
Contact information
Jean ROSENBAUM, INSERM U889, Université Victor Segalen Bordeaux 2, 146, Rue Léo Saignat, 33076 Bordeaux, FRANCE
Tel: +33 5 57 57 15 94 ; Fax: +33 5 56 51 40 77 ; e-mail: [email protected]
Number of tables : 4, figures : 6.
Abbreviations : alpha smooth muscle actin (ASMA); matrix metalloproteinase (MMP);
Protease-Activated Receptor (PAR); carbon tetrachloride (CCl4,); connective tissue growth factor (CTGF); monocyte chemotactic protein-1 (MCP-1); Fourier Transformed-infrared (FT-IR); Platelet Derived Growth Factor (PDGF)
Abstract
Thrombin inhibition protects against liver fibrosis. However, it is not known whether thrombin profibrogenic effect is due to effects on blood coagulation or to signaling via protease-activated receptors (PAR). We took advantage of the lack of blood coagulation defects in PAR-1 knock-out mice. Acute CCl4 toxicity was similar in wild-type (WT), PAR-1-/- and PAR-1+/- mice as judged by aminotransferases levels, area of liver necrosis, and liver peroxidation measured by Fourier transformed infrared spectroscopy. Fifteen mice/group received CCl4 or its solvent for 6 weeks (300µl/kg, 3 times a week). Fibrosis area was increased ten-fold by CCl4 treatment in WT mice. PAR-1 deficiency protected against fibrosis, with a 36% and 56% decrease in PAR-1+/- and PAR-1-/- mice, respectively (p<0.001). Similar results were obtained for the area of activated fibrogenic cells (64% and 79% decrease in PAR-1+/- and PAR-1-/- mice, respectively, p<0.001). These findings were corroborated by measurements of type I collagen, matrix metalloproteinase-2 and PDGFβ-R mRNA levels. There was also a significant decrease in T lymphocyte infiltration in PAR-1-deficient mice. Altogether, these results suggest that thrombin pro-fibrogenic effects are independent of effects on blood coagulation, but are instead due to direct effects on fibrogenic cells and possibly on T lymphocytes.
Key words : liver fibrosis, hemostasis, thrombin, hypoxia, lymphocytes
Introduction
Liver fibrosis is the major complication of most chronic liver diseases leading eventually to cirrhosis and hepatocellular carcinoma. Fibrosis deposition results from the activation of fibrogenic cells, the major ones being hepatic stellate cells and portal fibroblasts (22). Activated fibrogenic cells have a myofibroblastic phenotype characterized notably by the expression of alpha smooth muscle actin (ASMA) and are responsible for a high-level synthesis of extracellular matrix components, particularly collagen 1, and of extracellular matrix remodeling enzymes such as matrix metalloprotease-2 (MMP-2) (2).
Thrombin is a multifunctional serine protease that plays a central role in hemostasis by converting soluble fibrinogen into an insoluble fibrin clot and by promoting platelet aggregation (11). Thrombin has also a cytokine-like activity exerted via specific cell surface receptors called Protease-Activated Receptors (PAR). PARs belong to the seven transmembrane domain G-protein-coupled receptor superfamily. There are altogether four PARs, 3 of them, PAR-1, PAR-3 and PAR-4, being thrombin receptors. All PARs are activated by cleavage of the amino terminal sequence of the extracellular exodomain, resulting in a new amino terminal sequence which acts as a tethered ligand and initiates signal transduction (11). PAR-1 is expressed by several human cellular types like platelets, endothelial cells, fibroblasts, smooth muscle cells and T lymphocytes (12, 14, 34). Besides its procoagulant effects, many studies have shown the implication of thrombin and PAR-1, its main receptor, on inflammation, fibrogenesis and extracellular matrix remodeling in several organs and particularly in kidney and liver. Thus, we and others have shown that PAR-1 was overexpressed in human liver fibrosis (27, 34). In vitro, thrombin via PAR-1 stimulates rat (16, 26) and human (24) hepatic stellate cell proliferation, it regulates their migration (18) and their capacity to synthesize extracellular matrix components (17) and protease inhibitors (30).
Finally, we recently demonstrated that a thrombin antagonist was protective against carbon tetrachloride-induced fibrosis (CCl4) (15).
The profibrotic effects of thrombin could result from one of two signaling pathways. Activation of hemostasis would result in the occurrence of fibrin deposition and microthrombi in the liver parenchyma (31), leading to hypoxia and subsequent fibrogenesis (10, 37). However, PAR-1 signaling is known to result in the increased expression of a series of extracellular matrix molecules (7, 17) and profibrogenic mediators such as connective tissue growth factor (CTGF) (8) or monocyte chemotactic protein-1 (MCP-1) (26) and could thus account for the pro-fibrogenic effect of thrombin. Fiorucci et al have shown that a PAR-1 antagonist reduced liver fibrosis induced by bile duct ligation (16). These results are in favor of a significant role of PAR-1 signalization in liver fibrogenesis. Indeed, since rodent platelets do not express PAR-1 but instead use PAR-3 together with PAR-4, PAR-1 antagonists do not alter blood coagulation (9) and their protective effects are thus the consequence of the blockage of PAR-1 function in other cells such as fibro/myofibroblasts. However, the use of pharmacological antagonists may lead to improper results because of incomplete effects on one hand, or of non specific effects on the other (13).
Thus, in this study, we used mice where PAR-1 expression was abolished via homologous recombination in order to clarify the implication of PAR-1 in liver fibrogenesis.
Material and Methods
Animals
PAR-1-deficient mice were established by Connolly et al (9) and were studied in the C57BL/6 background. We used only male animals, aged 10-12 weeks, and weighing 31.0 ± 2.5 g at the onset of the study. The mice were allowed food and water ad libitum, and were housed at a constant temperature with a 12-h light/dark cycle during the study. Genotyping was performed using tail blood sample spotted onto Flinders Technology Associates (FTA) filter paper (Whatman, Oxon, UK) that was processed according to instructions from the manufacturer. Primers 1s (5’-GGA GAA AAA TGA AAG CGT CCT GC) and PAR-1as (5’-AGC CTT GCA TCA GGT TCT CAC TG) were used to amplify a 660 bp product from the wild type allele whereas primer PAR-1as neo (5’-TGA GAC GTG CTA CTT CCA TTT GTC AC) in combination with PAR-1s were used to amplify a 400 bp product from the targeted allele. Fragments were amplified using Hot start polymerase (Qiagen, Venlo, The Netherlands) with a PCR buffer containing 1.5 mM MgCl2 in a final volume of 50µl under the following conditions : 94°C, 1 min, 61.9°C, 1 min, 72°C, 1 min for 35 cycles. PCR products were visualized by electrophoresis on 1.5% agarose gels containing ethidium bromide. Knock-out, heterozygous and paired littermates wild-type animals were used. This studywas performed in accordance with the European Community Standards on the Care and Use of Laboratory Animals and approved by theAnimal Care and Use Committee of the University of Bordeaux 2.
Carbon tetrachloride-induced liver lesions
CCl4-acute liver toxicity
To assess the necrotic and inflammatory changes caused by acute exposure to CCl4 (Sigma, St Quentin-Fallavier, France), a single intraperitoneal injection of 300µl/kg (in olive oil) was
administered to PAR-1+/+, PAR-1+/- and PAR-1-/- mice (5 mice/group). Mice without any treatment were used as controls. Blood and liver samples were obtained after 48 hours. Liver tissue was snap-frozen or fixed in 10% neutral formalin. Sera were collected for biochemical analysis.
CCl4-induced liver fibrosis
Liver fibrosis was induced by the intraperitoneal injection of 300µl/kg body weight CCl4 mixed with olive oil three times weekly for 6 weeks. Four groups of mice were studied : three groups received CCl4 (group 1 : PAR-1+/+ mice, group 2 : PAR-1+/- mice, group 3 : PAR-1 -/-mice; 15 animals per group), whereas one control group of PAR-1+/+ mice received only the CCl4- solvent (n=6). Mice were sacrificed after 6 weeks of treatment, 2 days following the last injection. Blood and sera were collected. Liver samples were harvested, weighted and rapidly sliced: sections from several lobes were fixed in 10% neutral formalin for histological examination; other parts were snap frozen in liquid nitrogen for RNA extraction or Western blot. Spleen weight was also measured.
Measure of CCl4 acute liver toxicity
Acute liver toxicity was assessed by three different methods in a blinded fashion. First, we tested the levels of serum aminotransferases on an automated analyser in the Biochemistry Department of Pellegrin Hospital in Bordeaux. Secondly, we analyzed the extent of liver peroxidation induced by CCl4 in microsomal fractions of mouse liver by Fourier Transformed-infrared (FT-IR) spectroscopy as previously described (29). Ward’s algorithm was used on OPUS 4.0 software (Bruker, Ettlingen, Germany) for spectra classification on the spectral interval that are the most representative of the ν(C-O) sugar absorptions (1130-930 cm-1).
Third, the area of centrolobular necrosis was measured using a histomorphometric method based on hemalun-eosin and saffron stained slides. Slides were examined with a Zeiss Axioplan 2 microscope (Carl Zeiss Microscopy, Jena, Germany). Images were acquired with an AxioCam camera (Carl Zeiss Vision, Hallbergmoos, Germany) by means of the Axiovision image processing and analysis system (Carl Zeiss Vision) and quantitative data were obtained using a computerized image analysis (KS300, Carl Zeiss Vision). Sampling corresponded to three sections randomly taken from left, median and right major lobes. Analysis was performed on an average of ten fields per sample randomly taken using the x10 objective. Necrosis was expressed as a percentage of necrotic area on the total surface of liver analyzed.
Fibrosis assessment
Four µm thick sections from formalin fixed paraffin embedded liver tissue were prepared and stained with picrosirius red (saturated picric acid in distillated water containing 0.1% (w/v) picrosirius red F3B (BDH Chemicals Ltd., Poole, UK) to allow visualization of liver fibrosis. Sections were mounted with Eukitt (O Klinder GmbH and Co, Freiburg, Germany) before examination. The analysis was performed on the whole surface of the sample, including three sections randomly taken from left, median and right major lobes using the x 4 objective of a Coolscope microscope (Nikon, Champigny sur Marne, France) and the Lucia version 5.0 software (Nikon) in a blinded fashion. Large centrolobular veins (diameter >150µm) and large portal tracts were excluded. Fibrosis deposition was expressed as a percentage of picrosirius red stained area on the total area of the sample.
Immunolabelling for ASMA was performed on serial sections of formalin fixed paraffin embedded liver tissue with a monoclonal antibody (Dako A/S, Glostrup, Denmark, clone 1A4) diluted to 1/400, after heat induced antigen retrieval (citrate buffer pH 6, ten minutes). The signal was amplified by EnVisionTM+ dextran polymer (Dako A/S) and revealed with
liquid diaminobenzidine substrate (Dako A/S). Results were analyzed with the same histomorphometric method using the x 20 objective.
Real-time quantitative RT-PCR
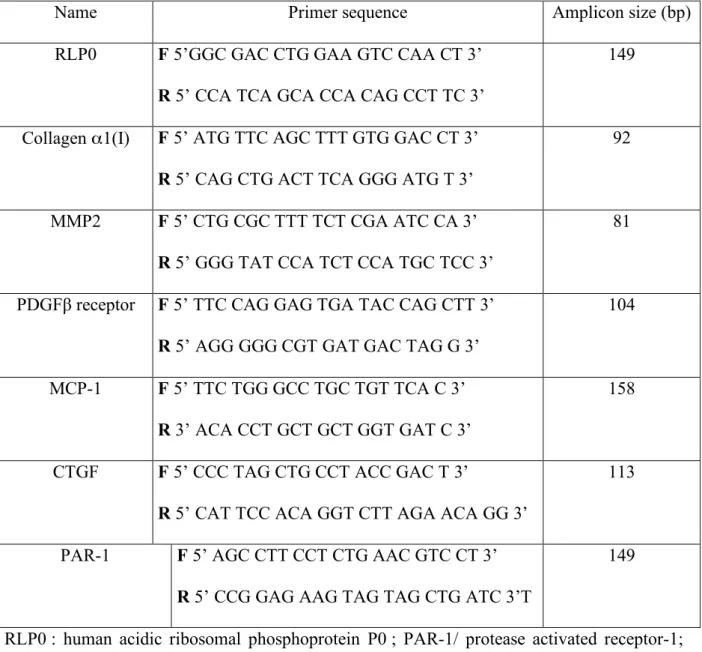
Total RNA was extracted from liver samples using the Nucleospin RNA II (Macherey Nagel, Düren, Germany). The quality of the total RNA samples were determined by electrophoresis through agarose gels and staining with ethidium bromide, and the 18S and 28S RNA bands were visualized under UV light. RNA was reverse transcribed using Superscript II (Promega, Charbonnières-les-Bains, France). Nucleotide sequences of primers for collagen α1(I), MMP-2, Platelet Derived Growth Factor (PDGF) β receptor, MCP-1, CTGF and PAR-1 target genes, and for RLP0 (encoding the human acidic ribosomal phosphoprotein P0, used as a control) are shown in Table 1. No template and no-reverse transcriptase were also performed as controls.
All PCR reactions were performed using a Stratagene X4000 thermocycler (Stratagene, Amsterdam, The Netherlands) and the SYBR Green PCR Core reagents kit (Bio-Rad, Marnes-la-Coquette, France). Five microliters of diluted complementary DNA samples (produced from 3ng total RNA) was added to 20µl of the PCR master mix. The thermal cycling conditions comprised an initial denaturation step at 95°C for 10 minutes and 45 cycles at 95°C for 15 seconds and 65°C for 1 minute. Experiments were performed with duplicates for each data point. Each sample was normalized on the basis of its expression of the RLP0 gene as previously described (4). All amplified sequences were also verified by sequencing in a ABI prism 3130 xl Genetic Analyser (HITACHI High Technologies Corporation, Tokyo, Japan). In order to compare quantitative values from one sample to another, the relative expression of each gene was also normalized to the sample displaying the smallest amount of
RNA and called calibrator. Each sample-normalized value was divided by the calibrator-normalized value to give the final relative expression level.
Hypoxia assessment
To detect liver hypoxic areas, an intraperitoneal injection of 60mg/kg pimonidazole (HypoxyprobeTM-1 kit, Chemicon International, Temecula, CA) was performed one hour before sacrifice. Pimonidazole is a stable and aqueous soluble molecule that specifically forms adducts in hypoxic cells. Such adducts are stable on time and can be detected by a specific monoclonal antibody called Hypoxyprobe 1-Mab-1 on formalin-fixed paraffin embedded tissues. The signal was detected according to the manufacturer’s procedure. Briefly, after inhibition of endogenous peroxidase, sections were incubated with 0.01% Pronase during 40 min at 40°C and then with Dako blocking system during 5 min at room temperature before incubation with Hypoxyprobe 1-Mab-1 (1/50) 45 min at room temperature. After washing, sections were incubated with biotin-SP-conjugated F(ab’)2 fragment of a rabbit anti-mouse IgG. The signal was detected after application of peroxidase conjugated streptavidin followed by liquid diaminobenzidine substrate. Positive hepatocytes were counted using a Coolscope microscope (Nikon) in twelve non overlapping fields at the x 20 objective.
Assessment of T lymphocyte infiltration
In order to study T lymphocyte infiltration, we used an immunohistochemical method with a polyclonal CD3 antibody (Dako A/S) diluted to 1/100, after heat induced antigen retrieval (citrate buffer pH 6, ten minutes). The staining was amplified as described above. Centrolobular CD3-positive lymphocytes were counted in twelve fields at the 40 objective using the Coolscope microscope.
MMP-2 immunoblots
Sixteen micrometers cryostat sections were solubilized in 25 µl 10% glycerol, 1% SDS at room temperature for 15 min. Protein concentration was estimated from A280 readings. Samples normalized for protein concentration were separated on 10% SDS-PAGE gels, transferred to polyvinylidene difluoride membranes. The blots were incubated with a MMP-2 antibody from Santa Cruz Biotechnologies (sc-13594, Santa Cruz, CA) and the signals were detected with enhanced chemiluminescence.
Statistical analysis
All data were expressed as median (range). Kruskal-Wallis test was performed to compare groups. Results were considered to be significant when p<0.05.
Results
Genotyping
About only 7% of mice born from crossing between PAR-1+/- mice were PAR-1-/- males. This sub-Mendelian ratio is in accordance with previous publications (9) and is due to a roughly 50% embryonic lethality of PAR-1-/- mice resulting from hemorrhage and cardiovascular failure at midgestation because of an abnormal endothelial function (19).
CCl4-acute liver toxicity
Since CCl4-induced fibrosis is under the dependence on CCl4 ability to induce liver necrosis and inflammation, we took great care to ensure that all 3 groups of mice had a similar response to an acute CCl4 challenge. No mice died during this experiment. Serum aminotransferase levels were very high in animals receiving CCl4 (Table 2). There was however no significant difference between PAR-1+/+, PAR-1+/- and PAR-1-/- mice. Similarly,
PAR-1+/- and PAR-1-/- mice did not differ from PAR-1+/+ mice regarding the extent of centrolobular necrosis (Table 2). Finally, we used FT-IR spectroscopy to provide a global analysis of liver peroxidation level induced by CCl4 in microsomal fractions of mouse liver. Using Ward’s algorithm for spectra classification (classification is represented in dendrogram), this allowed a clear discrimination between controls and CCl4-treated animals, although the 3 treated groups clustered together (Fig 1). We also measured liver infiltration by CD3-positive lymphocytes. Median value was 49.0 (range : 32-95) in control untreated mice, and 52.5 (47-73), 38.0 (36-59) and 45.0 (39-48) for PAR-1+/+, PAR-1+/- and PAR-1-/-mice treated with CCl4, respectively. These values did not differ significantly between them (p = 0.07 by ANOVA).
CCl4-induced liver fibrosis
Vital parameters and liver function tests
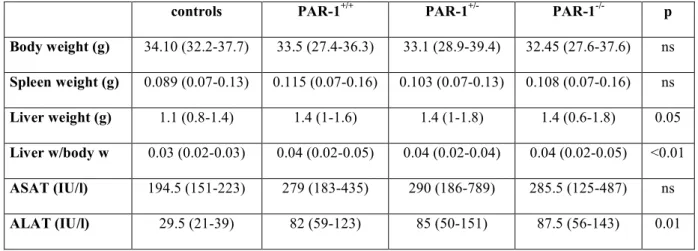
During CCl4 treatment,three PAR-1+/+ mice and one PAR-1-/- mouse died; the difference of mortality was not statistically different between the three groups. After six weeks of CCl4 treatment, mouse body weight and spleen weight were not different between the four groups (controls, PAR-1+/+, PAR-1+/- and PAR-1-/- treated mice) whereas liver weight and consequently liver weight to body weight ratio were significantly higher in all CCl4 treated groups as compared to controls (Table 3); these 3 groups were however not different from each other. Treatment with CCl4 also resulted in increased values of serum transaminases with no difference between the three groups (Table 3).
PAR-1 expression
PAR-1 expression was measured with real-time PCR in the livers of PAR-1+/+ control animals or those that received CCl4 for 6 weeks. The median PAR-1/RLP0 value in controls was 6802 (range : 2481-12916), whereas it was 13372 in CCl4-treated animals (range : 9455-22256). The difference was highly significant (p = 0.008), in accordance with previous data (16).
Fibrosis measurement
CCl4 treatment induced fibrosis deposition predominantly located in centrolobular areas. The area of fibrosis increased by about tenfold from 0.25 (0.13-0.35) % of field area in control group which received only olive oil, to 2.31 (1.79-3.20) % in CCl4-treated PAR-1+/+ mice. The area of fibrosis was decreased by 56% in PAR-1-/- mice (1.16% ; 0.88-1.44) and by 36% (1.58% ; 1.16-2.80) in PAR-1+/- mice as compared to PAR-1+/+ mice (p<0.001) (Fig 2). ASMA staining was restricted to vessel walls in control group whereas in CCl4 treated groups ASMA-positive cells were observed around the centrolobular areas and infiltrated the lobule. The area of ASMA-positive cells increased by tenfold from 0.25 (0.21-0.37) % in control group, to 2.69 (1.58-3.76) in CCl4 PAR-1+/+ mice. The area of ASMA-positive cells was decreased by 79% in PAR-1-/- mice (0.76% ; 0.50-1.73) and by 64% (1.14% ; 0.97-1.62) in PAR-1+/- mice as compared to PAR-1+/+ mice (p<0.001) (Fig 3).
Expression of fibrosis-related molecules
We evaluated the mRNA levels of collagen α1(I), a major component of liver fibrosis, PDGFβ-R, a marker of fibrogenic cell activation, and MMP-2, implicated in extracellular matrix remodeling, using real-time quantitative RT-PCR. The median collagen α1(I)/RLP0 ratio was 2.25 (1-14) in control group whereas it reached 59.5 (18.80-233.20) in PAR-1+/+
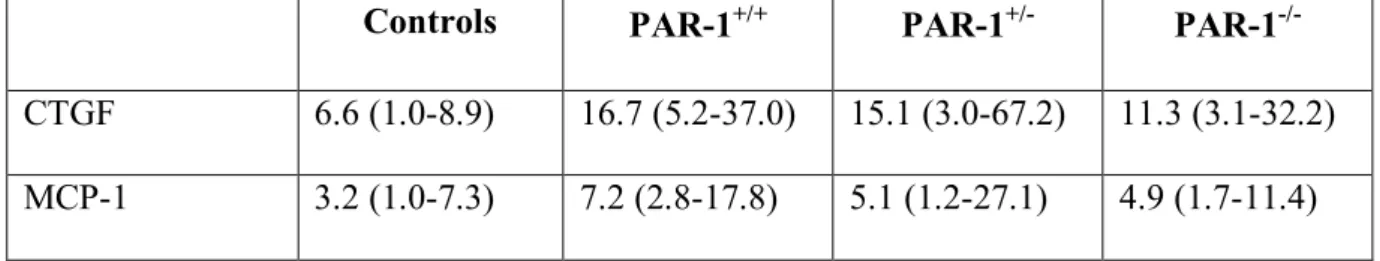
mice treated for 6 weeks with CCl4. As shown on Fig 4a, PAR-1-/- mice had a significantly lower expression of collagen α1(I) transcripts, whereas PAR-1+/- mice showed intermediate levels (p=0.008). The median PDGFβ-R/RLP0 ratio was also increased from 1.50 (1-10.70) in the control group to 10.50 (2.80-38.90) in PAR-1+/+ mice treated for 6 weeks with CCl4. There was a trend towards a decrease in PAR-1-/- mice and PAR-1+/- mice although the difference did not reach statistical difference (p=0.063) (Fig 4b). The median MMP-2/RLP0 ratio was 1.60 (1-18.70) in control group whereas it was 64.45 (17-179) in PAR-1+/+ mice treated for 6 weeks with CCl4. As for collagen α1(I), PAR-1-/- mice had a significantly lower expression of MMP-2 transcripts, whereas PAR-1+/- mice showed intermediate levels (p=0.004) (Fig 4c). MMP-2 expression was also analyzed in a subset of samples using western blot. As shown on Fig. 4d, MMP-2 expression was as expected increased in CCl4 -treated PAR-1+/+ mice as compared with controls; the increase was abolished in PAR-1-/- mice. Finally, we also assessed the expression of two cytokine genes known to be PAR-1 targets and relevant in the context of liver fibrosis, CTGF (8) and MCP-1 (26). The expression of both genes was increased in CCl4-treated PAR-1+/+ mice as compared to controls, although modestly. In both cases, there was a decrease in PAR-1-/- mice, but it failed to reach statistical significance (Table 4).
Hypoxia
Fig. 5 illustrates hypoxia staining in the different groups of animals. As previously described (10), the staining was localized preferentially in the cytoplasm of centrolobular hepatocytes. Quantitative analysis of all samples demonstrated that the median number of hypoxic hepatocytes was different between the four groups (Fig. 5, p<0.001). The median number of hypoxic hepatocytes was 117.0 (86.0-186.0) in control group whereas it increased to 179.0
(67.0-231.0) in PAR-1+/+ mice treated for 6 weeks with CCl4 (p=0.049). In PAR-1-/- mice, it was down to control level (97.5; 62.0-145.0) (p=0.001). However, the difference was not statistically different between PAR-1+/- mice (162.0; 100.0-201.0) and PAR-1+/+ mice.
T lymphocyte infiltration
Fig. 6 illustrates CD3 staining in the different groups of animals. Quantitative analysis of all samples demonstrated that the median number of CD3-positive lymphocytes was different between the 4 groups (Fig. 6, p<0.001). The median number of CD3-positive lymphocytes was 49.0 (32.0-95.0) in control group whereas it reached 178.5 (146.0-210.0) in PAR-1+/+ mice treated for 6 weeks with CCl4. The number of these cells decreased by 70% (87.5; 66.0-125.0) in PAR-1-/- mice and by 35% (130.0; 98.0-179.0) in PAR-1+/- mice.
Discussion
In this work, we studied the impact of PAR-1 deficiency on mouse liver fibrogenesis in the CCl4 model. We observed that PAR-1 complete deficiency led to a 56% decrease in the area of fibrosis and almost 80% reduction in the area of ASMA-positive cells. This was paralleled by decreased levels of collagen 1, MMP-2, PDGFβ-R, CTGF and MCP-1 transcripts. These data indicate that PAR-1 deficiency afforded a significant protection against liver fibrosis. Animals with a single deleted allele had an intermediate protection. In addition, we found that PAR-1-/- mice had a significant reduction in the number of hypoxic hepatocytes. It is likely that this reduced hypoxia is the consequence of decreased fibrogenesis, that will improve oxygen supply (21). In turn, since hypoxia is a contributing factor to fibrogenesis (1, 10), its decrease will contribute to the reduction in liver fibrosis.
CCl4 toxicity results from the liver microsomal metabolism of CCl4 leading to the generation of the toxic trichloromethyl radical that induce hepatocyte necrosis and apoptosis (32). This results in local inflammation that subsequently triggers fibrogenic cell activation. Since CCl4 metabolism can be altered by a variety of environmental or genetic mechanisms, we took great care to ensure that CCl4 toxicity was not altered in the different mouse genotypes under study. We found that PAR-1+/+, PAR-1+/- and PAR-1-/- behaved similarly in response to CCl4 regarding serum aminotransferases, and the extent of liver necrosis as quantified by histomorphometry. There was also no difference in the number of T lymphocytes infiltrating the parenchyma following an acute lesion, although this infiltration was low in every group at the time point studied. We also used the recently developed method of FT-IR spectroscopy that allows a global assessment of many biochemical parameters in the liver (29) and found again no difference between the 3 experimental groups. Thus, it is likely that the differences we found on fibrosis and ASMA scores truly reflect the role of PAR-1 on fibrogenesis,
although our data do not allow to formally exclude the possibility of a defect in tissue repair mechanisms in PAR-1-deficient mice.
Our results confirm and extend the observations of Fiorucci et al. These authors have found that a synthetic PAR-1 antagonist protected against liver fibrosis in the bile duct ligation model in rats (16). Our own study adds several new pieces of information. First, it strongly suggests that PAR-1 may be a generic mediator of fibrogenesis since it is involved in liver fibrosis resulting from very different mechanisms and involving distinct populations of fibrogenic cells. Indeed, CCl4-induced fibrosis is a highly inflammatory disease where the main cellular actor is the hepatic stellate cell; on the other hand, bile duct-induced fibrosis is very little inflammatory, and the main cell type responsible for fibrosis deposition is the portal fibroblast (3, 36). Secondly, the use of knock-out animals in our study allows to unambiguously ascribe a pro-fibrogenic role to PAR-1 whereas studies with pharmacological antagonists may lead to improper results because of insufficient specificity of the molecules (13).
As pointed out earlier, an unresolved question is whether the reported liver pro-fibrogenic effects of thrombin are due to its pro-coagulant effect, or to its documented pro-fibrogenic signaling via PAR receptors (17, 24, 27). Our study allows to answer this question. Indeed, mouse platelets do not express PAR-1, but instead use PAR-3 and PAR-4 to respond to thrombin. Thus PAR-1 depletion does not affect thrombin effect on platelets and altogether has no effect on blood coagulation (9). We can thus conclude that the pro-fibrogenic effect of thrombin is largely independent on blood coagulation but instead relies on its ability to activate PAR-1. This is also supported by data from Fiorucci et al (16).
In addition to the direct effects of thrombin on fibrogenic cells, our results point to the possible role of T lymphocytes. T lymphocytes are now acknowledged as key contributors to
liver fibrosis (35). We found that PAR-1 deficient animals had a significantly reduced infiltration of the liver with T lymphocytes. Since the expression of PAR-1 on T lymphocytes is well documented (25, 34) and since thrombin can elicit activation signals in T cells (20, 25), we suggest that PAR-1 deficiency may reduce T lymphocyte accumulation in the liver which may participate in the decreased fibrogenic process.
Since PAR-1 can also be activated by other ligands, such as activated protein C (APC) (33) or M MP-1 (5), it could be argued that the effects of PAR-1 depletion may not reflect only a defect in thrombin signaling. However, APC generation is under the dependence of thrombin, and given that thrombin affinity for PAR-1 is much higher than that of APC, the available concentrations of APC may be insufficient to activate PAR-1 (23). Regarding MMP-1, it is expressed at low levels in the liver and is not upregulated in the course of fibrosis. On the other hand, there is evidence that thrombin is generated in fibrotic liver, as evidenced by the presence of fibrin deposition in experimental (31) or human disease (28). Thus, although the role of alternative PAR-1 ligands can not be completely excluded, most evidence points to thrombin as being the active PAR-1 ligand in this setting.
In conclusion, we have shown that invalidation of PAR-1 induces a significant protection against liver fibrosis. These observations confirm and extend previous data obtained in the bile duct ligation model with a PAR-1 antagonist (16). Thus, altogether, these data suggest that PAR-1 antagonists may be useful in the clinical management of liver fibrosis. This is especially appealing, since contrary to direct thrombin inhibitors, PAR-1 antagonists do not provoke a bleeding risk, and there is moreover great hope that orally active molecules will be available (reviewed in (6)). Finally, the fact that deletion of a single PAR-1 allele was enough
to offer a very significant protection, suggests that complete blockage of PAR-1 function may not be required for a therapeutic effect.
Acknowledgments
We thank Shaun Coughlin for the PAR-1 KO mice, Ivan Bièche for his help in setting up the real-time PCR experiments, and the Biochemistry Department of Pellegrin Hospital, Bordeaux, for performing liver function tests.
References
1. Ankoma-Sey V, Wang Y, and Dai Z. Hypoxic stimulation of vascular endothelial
growth factor expression in activated rat hepatic stellate cells. Hepatology 31: 141-148, 2000. 2. Arthur MJ, Stanley A, Iredale JP, Rafferty JA, Hembry RM, and Friedman SL.
Secretion of 72 kDa type IV collagenase/gelatinase by cultured human lipocytes. Analysis of gene expression, protein synthesis and proteinase activity. Biochem J 287 (Pt 3): 701-707, 1992.
3. Beaussier M, Wendum D, Schiffer E, Dumont S, Rey C, Lienhart A, and Housset C. Prominent contribution of portal mesenchymal cells to liver fibrosis in ischemic and
obstructive cholestatic injuries. Lab Invest 87: 292-303, 2007.
4. Bieche I, Nogues C, Paradis V, Olivi M, Bedossa P, Lidereau R, and Vidaud M.
Quantitation of hTERT gene expression in sporadic breast tumors with a real-time reverse transcription-polymerase chain reaction assay. Clin Cancer Res 6: 452-459, 2000.
5. Boire A, Covic L, Agarwal A, Jacques S, Sherifi S, and Kuliopulos A. PAR1 is a
matrix metalloprotease-1 receptor that promotes invasion and tumorigenesis of breast cancer cells. Cell 120: 303-313, 2005.
6. Chackalamannil S. Thrombin receptor (protease activated receptor-1) antagonists as
potent antithrombotic agents with strong antiplatelet effects. J Med Chem 49: 5389-5403, 2006.
7. Chambers RC, Dabbagh K, McAnulty RJ, Gray AJ, Blanc-Brude OP, and Laurent GJ. Thrombin stimulates fibroblast procollagen production via proteolytic activation
of protease-activated receptor 1. Biochem J 333 (Pt 1): 121-127, 1998.
8. Chambers RC, Leoni P, Blanc-Brude OP, Wembridge DE, and Laurent GJ.
Thrombin is a potent inducer of connective tissue growth factor production via proteolytic activation of protease-activated receptor-1. J Biol Chem 275: 35584-35591, 2000.
9. Connolly AJ, Ishihara H, Kahn ML, Farese RV, Jr., and Coughlin SR. Role of the
thrombin receptor in development and evidence for a second receptor. Nature 381: 516-519, 1996.
10. Corpechot C, Barbu V, Wendum D, Kinnman N, Rey C, Poupon R, Housset C, and Rosmorduc O. Hypoxia-induced VEGF and collagen I expressions are associated with
angiogenesis and fibrogenesis in experimental cirrhosis. Hepatology 35: 1010-1021, 2002. 11. Coughlin SR. Thrombin signalling and protease-activated receptors. Nature 407:
258-264, 2000.
12. D'Andrea MR, Saban MR, Nguyen NB, Andrade-Gordon P, and Saban R.
Expression of protease-activated receptor-1, -2, -3, and -4 in control and experimentally inflamed mouse bladder. Am J Pathol 162: 907-923, 2003.
13. Di Serio C, Pellerito S, Duarte M, Massi D, Naldini A, Cirino G, Prudovsky I, Santucci M, Geppetti P, Marchionni N, Masotti G, and Tarantini F. Protease-Activated
Receptor 1-Selective Antagonist SCH79797 Inhibits Cell Proliferation and Induces Apoptosis by a Protease-Activated Receptor 1-Independent Mechanism. Basic Clin Pharmacol Toxicol 101: 63-69, 2007.
14. Dugina TN, Kiseleva EV, Chistov IV, Umarova BA, and Strukova SM. Receptors
of the PAR family as a link between blood coagulation and inflammation. Biochemistry
(Mosc) 67: 65-74, 2002.
15. Duplantier JG, Dubuisson L, Senant N, Freyburger G, Laurendeau I, Herbert JM, Desmouliere A, and Rosenbaum J. A role for thrombin in liver fibrosis. Gut 53:
1682-1687, 2004.
16. Fiorucci S, Antonelli E, Distrutti E, Severino B, Fiorentina R, Baldoni M, Caliendo G, Santagada V, Morelli A, and Cirino G. PAR1 antagonism protects against
experimental liver fibrosis. Role of proteinase receptors in stellate cell activation. Hepatology 39: 365-375, 2004.
17. Gaca MD, Zhou X, and Benyon RC. Regulation of hepatic stellate cell proliferation
and collagen synthesis by proteinase-activated receptors. J Hepatol 36: 362-369, 2002.
18. Gillibert-Duplantier J, Neaud V, Blanc JF, Bioulac-Sage P, and Rosenbaum J.
Thrombin inhibits migration of human hepatic myofibroblasts. Am J Physiol Gastrointest
Liver Physiol 293: G128-136, 2007.
19. Griffin CT, Srinivasan Y, Zheng YW, Huang W, and Coughlin SR. A role for
thrombin receptor signaling in endothelial cells during embryonic development. Science 293: 1666-1670., 2001.
20. Joyce DE, Chen Y, Erger RA, Koretzky GA, and Lentz SR. Functional interactions
between the thrombin receptor and the T-cell antigen receptor in human T-cell lines. Blood 90: 1893-1901, 1997.
21. Le Couteur DG, Cogger VC, Markus AM, Harvey PJ, Yin ZL, Ansselin AD, and McLean AJ. Pseudocapillarization and associated energy limitation in the aged rat liver.
Hepatology 33: 537-543, 2001.
22. Lotersztajn S, Julien B, Teixeira-Clerc F, Grenard P, and Mallat A. Hepatic
fibrosis: molecular mechanisms and drug targets. Annu Rev Pharmacol Toxicol 45: 605-628, 2005.
23. Ludeman MJ, Kataoka H, Srinivasan Y, Esmon NL, Esmon CT, and Coughlin SR. PAR1 cleavage and signaling in response to activated protein C and thrombin. J Biol
Chem 280: 13122-13128, 2005.
24. Mallat A, Gallois C, Tao J, Habib A, Maclouf J, Mavier P, Preaux AM, and Lotersztajn S. Platelet-derived growth factor-BB and thrombin generate positive and
negative signals for human hepatic stellate cell proliferation. Role of a prostaglandin/cyclic AMP pathway and cross-talk with endothelin receptors. J Biol Chem 273: 27300-27305, 1998.
25. Mari B, Imbert V, Belhacene N, Far DF, Peyron JF, Pouyssegur J, Van Obberghen-Schilling E, Rossi B, and Auberger P. Thrombin and thrombin receptor agonist
peptide induce early events of T cell activation and synergize with TCR cross-linking for CD69 expression and interleukin 2 production. J Biol Chem 269: 8517-8523, 1994.
26. Marra F, Arrighi MC, Fazi M, Caligiuri A, Pinzani M, Romanelli RG, Efsen E, Laffi G, and Gentilini P. Extracellular signal-regulated kinase activation differentially
regulates platelet-derived growth factor's actions in hepatic stellate cells, and is induced by in vivo liver injury in the rat. Hepatology 30: 951-958, 1999.
27. Marra F, DeFranco R, Grappone C, Milani S, Pinzani M, Pellegrini G, Laffi G, and Gentilini P. Expression of the thrombin receptor in human liver: up-regulation during
acute and chronic injury. Hepatology 27: 462-471, 1998.
28. Marsden PA, Ning Q, Fung LS, Luo X, Chen Y, Mendicino M, Ghanekar A, Scott JA, Miller T, Chan CW, Chan MW, He W, Gorczynski RM, Grant DR, Clark DA, Phillips MJ, and Levy GA. The Fgl2/fibroleukin prothrombinase contributes to
immunologically mediated thrombosis in experimental and human viral hepatitis. J Clin
Invest 112: 58-66, 2003.
29. Melin AM, Perromat A, and Deleris G. Pharmacologic application of fourier
transform IR spectroscopy: in vivo toxicity of carbon tetrachloride on rat liver. Biopolymers 57: 160-168, 2000.
30. Neaud V, Gillibert Duplantier J, Mazzocco C, Kisiel W, and Rosenbaum J.
Thrombin Up-regulates Tissue Factor Pathway Inhibitor-2 Synthesis through a Cyclooxygenase-2-dependent, Epidermal Growth Factor Receptor-independent Mechanism. J
Biol Chem 279: 5200-5206, 2004.
31. Neubauer K, Knittel T, Armbrust T, and Ramadori G. Accumulation and cellular
localization of fibrinogen/fibrin during short-term and long-term rat liver injury.
Gastroenterology 108: 1124-1135, 1995.
32. Recknagel RO, Glende EA, Jr., Dolak JA, and Waller RL. Mechanisms of carbon
tetrachloride toxicity. Pharmacol Ther 43: 139-154, 1989.
33. Riewald M and Ruf W. Protease-activated receptor-1 signaling by activated protein
C in cytokine-perturbed endothelial cells is distinct from thrombin signaling. J Biol Chem 280: 19808-19814, 2005.
34. Rullier A, Senant N, Kisiel W, Bioulac-Sage P, Balabaud C, Le Bail B, and Rosenbaum J. Expression of protease-activated receptors and tissue factor in human liver.
Virchows Arch: 1-6, 2005.
35. Safadi R, Ohta M, Alvarez CE, Fiel MI, Bansal M, Mehal WZ, and Friedman SL.
Immune stimulation of hepatic fibrogenesis by CD8 cells and attenuation by transgenic interleukin-10 from hepatocytes. Gastroenterology 127: 870-882, 2004.
36. Tuchweber B, Desmoulière A, Bochaton-Piallat ML, Rubbia-Brandt L, and Gabbiani G. Proliferation and phenotypic modulation of portal fibroblasts in the early stages
of cholestatic fibrosis in the rat. Lab Invest 74: 265-278, 1996.
37. Wanless IR, Liu JJ, and Butany J. Role of thrombosis in the pathogenesis of
congestive hepatic fibrosis (cardiac cirrhosis). Hepatology 21: 1232-1237, 1995.
Figure 1 : Effect of an acute CCl4 treatment on liver microsome peroxidation
Microsomal fractions of liver from mice acutely treated with CCl4 were analyzed by FT-IR spectroscopy as described in Materials and Methods. Results are shown as a dendrogram representing liver peroxidation as assessed by FT-IR spectroscopy (1130-930 cm-1 spectral
interval, which mainly contains glycogen). All samples from CCl4-treated mice (n = 15), whether PAR-1+/+, PAR-1+/-, or PAR-1-/- clustered together on the left side (clusters 1-8) whereas all control samples (n = 15, clusters 9-11) clustered separately on the right side. Spectra in clusters 9-11 present significant molecular content differences (H values = heterogeneity) from those of the 1-8 series (*: P < 0.01).
Figure 2 : Effect of PAR-1 deficiency on fibrosis deposition.
Fibrosis was stained with picrosirius red and the staining was quantified by histomorphometry.
a : controls; b-d : mice treated for 6 weeks with CCl4 (b: PAR-1+/+ ; c :PAR-1+/- ; d : PAR-1-/-) (picrosirius red ; x10) ; e: The graph shows a box and whiskers plot of percentage of section area occupied by fibrosis. The top and bottom of each box represent the 75th and 25th percentiles, respectively. Whiskers represent the range and the line in the box represents the median value of the distribution. (WT : wild type, HT : heterozygous, KO : knock-out mice for PAR-1 gene). Kruskal-Wallis test showed a significant difference between groups (p < 0.001; n = 15 for PAR-1+/+,PAR-1+/- and PAR-1-/- animals each, and 6 for controls).
Figure 3 : Effect of PAR-1 deficiency on ASMA expression
Fibrogenic cell activation was assessed by staining for ASMA. The area stained positively was quantified by histomorphometry.
a : controls; b-d : mice treated for 6 weeks with CCl4 (b: PAR-1+/+ ; c :PAR-1+/- ; d : PAR-1-/-) (immunostaining ASMA ; x20) ; e :the graph shows a box and whiskers plot of percentage of section area occupied by ASMA-positive cells. The top and bottom of each box represent the 75th and 25th percentiles, respectively. Whiskers represent the range and the line in the box represents the median value of the distribution. (WT : wild type, HT : heterozygous, KO : knock-out mice for PAR-1 gene) of treatment. Kruskal-Wallis test showed a significant difference between groups (p < 0.001; n = 15 for PAR-1+/+, PAR-1+/- and PAR-1-/- animals each, and 6 for controls).
Figure 4 : Effect of PAR-1 deficiency on the expression of specific transcripts
After 6 weeks of CCl4, total RNA was extracted from the livers and analyzed by real-time RT-PCR with primers specific for collagen α1(I) (a), PDGFβ-R (b) or MMP-2 (c). Results were normalized using the expression of RLP0 transcripts. The graph shows box and whiskers plots of transcripts levels. The top and bottom of each box represent the 75th and 25th percentiles, respectively. Whiskers represent the range and the line in the box represents the median value of the distribution. P values are shown on the graphs (n = 15 for PAR-1+/+, PAR-1+/- and PAR-1-/- animals each, and 6 for controls); d : western blot for MMP-2 expression in liver extracts of untreated animals (controls), or in WT or PAR-1-/- animals that received CCl4.
Figure 5: Hypoxia labeling in the mice liver after 6 weeks of treatment
Mice were injected with pimonidazole before sacrifice and liver sections were stained with the Hypoxyprobe 1-Mab-1 as described in Materials and Methods. a: control; b-d : mice treated with CCl4 for 6 weeks (b : PAR-1+/+; c: PAR-1+/-; d: PAR-1-/-). The continuous sinusoidal staining seen in all pictures was also seen in sections obtained from mice not
injected with pimonidazole (not shown) and was thus considered non specific. e :the graph shows a box and whiskers plot of the number of hypoxia-positive cells counted in 12 non overlapping fields. The top and bottom of each box represent the 75th and 25th percentiles, respectively. Whiskers represent the range and the line in the box represents the median value of the distribution. (WT : wild type, HT : heterozygous, KO : knock-out mice for PAR-1 gene) of treatment. Kruskal-Wallis test showed a significant difference between groups (p < 0.001; n = 15 for PAR-1+/+,PAR-1+/- and PAR-1-/- animals each, and 6 for controls).
Figure 6: CD3-positive cells in the mice liver after 6 weeks of treatment
CD3-positive cells were labeled as described in Materials and Methods. a: control; b-d : mice treated with CCl4 for 6 weeks. Numerous positive cells were observed in PAR-1+/+ mice treated for 6 weeks with CCl4 (b, arrows). The number of CD-3 positive cells was reduced in PAR-1+/- mice (c) and even more in PAR-1-/- mice (d). e : the graph shows a box and whiskers plot of the number of CD3-positive cells counted in 12 non overlapping fields. The top and bottom of each box represent the 75th and 25th percentiles, respectively. Whiskers represent the range and the line in the box represents the median value of the distribution. (WT : wild type, HT : heterozygous, KO : knock-out mice for PAR-1 gene) of treatment. Kruskal-Wallis test showed a significant difference between groups (p < 0.001; n = 15 for PAR-1+/+,PAR-1
and PAR-1-/- animals each, and 6 for controls).
Table 1 : Primer sequences used for real-time quantitative RT-PCR
Name Primer sequence Amplicon size (bp)
RLP0 F 5’GGC GAC CTG GAA GTC CAA CT 3’
R 5’ CCA TCA GCA CCA CAG CCT TC 3’
149
Collagen α1(I) F 5’ ATG TTC AGC TTT GTG GAC CT 3’ R 5’ CAG CTG ACT TCA GGG ATG T 3’
92
MMP2 F 5’ CTG CGC TTT TCT CGA ATC CA 3’
R 5’ GGG TAT CCA TCT CCA TGC TCC 3’
81
PDGFβ receptor F 5’ TTC CAG GAG TGA TAC CAG CTT 3’
R 5’ AGG GGG CGT GAT GAC TAG G 3’
104
MCP-1 F 5’ TTC TGG GCC TGC TGT TCA C 3’
R 3’ ACA CCT GCT GCT GGT GAT C 3’
158
CTGF F 5’ CCC TAG CTG CCT ACC GAC T 3’
R 5’ CAT TCC ACA GGT CTT AGA ACA GG 3’
113
PAR-1 F 5’ AGC CTT CCT CTG AAC GTC CT 3’
R 5’ CCG GAG AAG TAG TAG CTG ATC 3’T
149
RLP0 : human acidic ribosomal phosphoprotein P0 ; PAR-1/ protease activated receptor-1; MMP2 : matrix metalloprotease 2 ; PDGFβ : Platelet Derived Growth Factor β ; MCP-1 : monocyte chemotactic protein-1; CTGF : connective tissue growth factor; F : forward ; R : reverse.
Table 2 : CCl4-acute liver toxicity : aminotransferase levels and centrolobular necrosis
in the three groups
PAR-1+/+ PAR-1+/- PAR-1-/- p
ASAT (IU/l) 1002 (981-1023) 2217 (1176-3258) 1423 (963-2976) ns ALAT (IU/l) 2379 (1443-3315) 4394 (2047-6741) 3916 (3333-6564) ns Centrolobular necrosis (% of section area) 24.25 (22.5-32) 32 (22.8-35) 29.5 (27-29.7) ns
Table 3 : Vital parameters and liver function tests in mice after 6 weeks of CCl4
treatment
controls PAR-1+/+ PAR-1+/- PAR-1-/- p
Body weight (g) 34.10 (32.2-37.7) 33.5 (27.4-36.3) 33.1 (28.9-39.4) 32.45 (27.6-37.6) ns Spleen weight (g) 0.089 (0.07-0.13) 0.115 (0.07-0.16) 0.103 (0.07-0.13) 0.108 (0.07-0.16) ns Liver weight (g) 1.1 (0.8-1.4) 1.4 (1-1.6) 1.4 (1-1.8) 1.4 (0.6-1.8) 0.05 Liver w/body w 0.03 (0.02-0.03) 0.04 (0.02-0.05) 0.04 (0.02-0.04) 0.04 (0.02-0.05) <0.01 ASAT (IU/l) 194.5 (151-223) 279 (183-435) 290 (186-789) 285.5 (125-487) ns ALAT (IU/l) 29.5 (21-39) 82 (59-123) 85 (50-151) 87.5 (56-143) 0.01
Table 4 : Expression of CTGF and MCP-1 transcripts
Controls PAR-1+/+ PAR-1+/- PAR-1
-/-CTGF 6.6 (1.0-8.9) 16.7 (5.2-37.0) 15.1 (3.0-67.2) 11.3 (3.1-32.2)
MCP-1 3.2 (1.0-7.3) 7.2 (2.8-17.8) 5.1 (1.2-27.1) 4.9 (1.7-11.4)
The values are the median (range) of gene expression results normalized to RLP0 (n = 12 for PAR-1+/+,PAR-1+/- and PAR-1-/- animals each, and 5 for controls). The differences did not reach statistical significance.
H = 0.0201 0.002 0.004 0.006 0.008 0.01 0.012 0.014 0.016 0.018 0.02 0.022 0 1 6 12 102 94 110 112 2 91 93 8 89 92 111 7 5 103 28 34 52 99 37 42 43 46 53 66 47 4 3 6 8 7 5 1 2 11 9 10
controls KO HT WT F ib ro si s d ep os it io n 4 3 2 1 0
e
d
c
d
c
p<0.001
controls KO HT WT A S M A -p os it iv e ar ea ( % o f to ta l) 4 3 2 1 0e
p=0.008 0 50 100 150 200 WT HT KO Control
m
R
N
A
c
ol
l I
/R
L
P
c
p=0.004 0 50 100 150 200 350m
R
N
A
M
M
P
2/
R
L
P
0
WT HT KO Control p=0.063 0 10 20 30 40 50 WT HT KO Controlm
R
N
A
P
D
G
F
R
β
/R
L
WT KO Controld
100µm
b
100µmc
100µmd
100µm controls KO HT WT N u m b er o f h yp ox ic h ep at oc yt es250 200 150 100 50 0e
100µm 100µm