HAL Id: inserm-02093066
https://www.hal.inserm.fr/inserm-02093066
Submitted on 8 Apr 2019HAL is a multi-disciplinary open access archive for the deposit and dissemination of sci-entific research documents, whether they are pub-lished or not. The documents may come from teaching and research institutions in France or abroad, or from public or private research centers.
L’archive ouverte pluridisciplinaire HAL, est destinée au dépôt et à la diffusion de documents scientifiques de niveau recherche, publiés ou non, émanant des établissements d’enseignement et de recherche français ou étrangers, des laboratoires publics ou privés.
mother-reported eating behavior in children up to 5
years
Blandine de Lauzon-Guillain, Yves Koudou, Jérémie Botton, Anne Forhan,
Sophie Carles, Véronique Pelloux, Karine Clément, Ken Ong, Marie Aline
Charles, Barbara Heude
To cite this version:
Blandine de Lauzon-Guillain, Yves Koudou, Jérémie Botton, Anne Forhan, Sophie Carles, et al.. Association between genetic obesity susceptibility and mother-reported eating behavior in children up to 5 years: genetic obesity risk and child’s eating behavior. International Journal of Pediatric Obesity, Taylor & Francis, 2019, 14 (5), pp.e12496. �10.1111/ijpo.12496�. �inserm-02093066�
Association between genetic obesity susceptibility and mother-reported
eating behavior in children up to 5 years
Blandine de Lauzon-Guillain, PhD1,2,8, Yves Akoli Koudou, MSc1, Jérémie Botton, PhD1,3,
Anne Forhan, MSc1,2, Sophie Carles, PhD1, Véronique Pelloux, PhD 4,5,6, Karine Clément,
PhD 4,5,6, Ken K. Ong, FRCPCH7, Marie Aline Charles, MD, PhD1,2, Barbara Heude, PhD1,2;
on behalf of the EDEN Mother-Child Cohort Study Group*
* Members of the EDEN Mother-Child Cohort Study Group: I. Annesi-Maesano, JY.
Bernard, J. Botton, M.A. Charles, P. Dargent-Molina, B. de Lauzon-Guillain, P. Ducimetière, M. de Agostini, B. Foliguet, A. Forhan, X. Fritel, A. Germa, V. Goua, R. Hankard, B. Heude, M. Kaminski, B. Larroque†, N. Lelong, J. Lepeule, G. Magnin, L. Marchand, C. Nabet, F. Pierre, R. Slama, M.J. Saurel-Cubizolles, M. Schweitzer, O. Thiebaugeorges.
Affiliations
1
INSERM, UMR1153 Epidemiology and Biostatistics Sorbonne Paris Cité Center, Early ORigin of the Child’s Health and Development Team (ORCHAD), Paris, France
2
Paris Descartes University, France
3
Univ. Paris-Sud, Université Paris-Saclay, Faculty of Pharmacy, F-92296, Châtenay-Malabry, France;
4
Institute of Cardiometabolism and Nutrition, ICAN, F-75013, Paris, France;
5
INSERM, UMRS 1166, Nutriomic team 6, Paris, F-75013 France;
6
Sorbonne Universités, UPMC Université Paris 06, UMRS1166, Paris, F-75013 France;
7
Medical Research Council Epidemiology Unit & Department of Paediatrics, University of Cambridge, Addenbrooke’s Hospital, Cambridge, England
8
INRA, U1125 Epidemiology and Biostatistics Sorbonne Paris Cité Center (CRESS), Early ORigin of the Child’s Health and Development Team (ORCHAD), Paris, F-75014 France.
PubMed indexing.
de Lauzon-Guillain, Koudou, Botton, Forhan, Carles, Pelloux, Clément, Ong, Charles, Heude; on behalf of the EDEN Mother-Child Cohort Study Group
Running head
genetic obesity risk and child’s eating behavior
Keywords
obesity, genetic, eating behaviour, growth, birth cohort, childhood
Corresponding author
de Lauzon-Guillain Blandine INSERM CRESS – Eq6 ORCHAD
16 av. Paul Vaillant Couturier, 94807 Villejuif Cedex, FRANCE
Tel: +33145595019; Fax: +33147269454; E-mail: blandine.delauzon@inserm.fr
Abbreviations
BMI-GRS: combined obesity risk-allele score SNP: single-nucleotide polymorphisms
Abstract
1
Background. Many genetic polymorphisms identified by genome wide association studies
2
for adult BMI have been suggested to regulate food intake. 3
Objective. The objective was to study the associations between a genetic obesity risk score,
4
appetitive traits and growth of children up to age 5 years, with a longitudinal design. 5
Methods. In 1,142 children from the EDEN birth cohort, a combined obesity risk-allele score
6
(BMI-GRS) was related to appetitive traits (energy intake up to 12 months, a single item on 7
appetite from 4 months to 3 years, a validated appetite score at 5 years) using Poisson 8
regressions with robust standard errors. The potential mediation of appetitive traits on the 9
association between BMI-GRS and growth was assessed by the Sobel test. 10
Results. Children with a high BMI-GRS were more likely to have high energy intake at 1
11
year and high appetite at 2 and 5 years. High energy intake in infancy and high appetite from 12
1 year were related to higher subsequent BMI. High 2-y appetite seemed to partially mediate 13
the associations between BMI-GRS and BMI from 2 to 5 years (all p<=0.05). 14
Conclusions. Genetic susceptibility to childhood obesity seems to be partially explained by
15
appetitive traits in infancy, followed by an early childhood rise in BMI. 16
Introduction
18
Genome-wide-association studies (GWAs) have identified several genes associated with an 19
increased risk of obesity (1, 2). Time has now come to take advantage of these major findings 20
in order to better understand the mechanisms of lifecourse obesity development from infancy 21
to adulthood. Many birth cohorts have shown that scores of genetic susceptibility to obesity 22
are associated with early growth, as early as 2 years in some of them, but not with foetal 23
growth (3, 4, 5, 6). 24
A great part of the genes implicated by GWAs, and especially those from monogenic studies 25
on severe childhood or early onset obesity, are purportedly involved in the central regulation 26
of food intake (7). Furthermore, the genetic component of eating behavior has clearly been 27
established through heritability studies, in adults (8) and also in children (9, 10). Eating 28
behavior even in infancy may influence later adiposity development (11), which raises the 29
question whether the association between the genetic score and adiposity is mediated by 30
eating behaviour in childhood. Cross-sectional studies, conducted among 8-11 years children, 31
have already shown that increased BMI of children homozygous for the at-risk allele of a 32
FTO SNP may be partially mediated by appetitive traits (12, 13). Similarly, a cross-sectional 33
analysis of the Twins Early Development Study highlighted that satiety responsiveness 34
partially mediated the association between a polygenic risk score and adiposity in children 35
aged 8-11 years(14). However, such a cross-sectional design is insufficient to establish a 36
causal pathway. More recently, this causal pathway has been tested longitudinally within a 37
Norwegian cohort following children from the age of 4 years to the age of 8 years (15). In that 38
study, higher genetic risk for obesity was associated with appetitive traits at 6 years, but these 39
appetitive traits were not related to BMI gain up to 8 years. As a previous study has shown 40
that appetitive traits assessed at age 3 months predicted weight at 9 months, it would be 41
important to test the potential mediating effect of infant or toddler’s appetitive traits on 42
subsequent growth. A prospective design would also offer the opportunity to highlight a 43
potential window of opportunity for this mediating effect. 44
In this context, we aimed at investigating within the French EDEN mother-child cohort, how 45
genetic predisposition to obesity may influence eating behavior very early life and whether 46
this relationship might explain the accelerated growth in children with higher genetic risk for 47
obesity. In the present study, we focused on three aspects of child’s eating behavior that could 48
be assessed longitudinally, from 4 months to 5 years: energy intake and appetite. 49
Material and methods
50
Study population
51
The EDEN mother-child study is a prospective cohort whose aim is to assess pre- and post-52
natal determinants of child growth, development and health. It has been described in more 53
detail elsewhere (16). In brief, 2002 pregnant women were recruited from 2003 to 2006 in 54
two French university hospitals, before 24 weeks of amenorrhea. Exclusion criteria were 55
multiple pregnancies, known diabetes prior to pregnancy, illiteracy, plan to move outside the 56
region within the next three years. The study was approved by the Ethics Committee of the 57
University Hospital of Kremlin-Bicêtre on December 12, 2002 and data files were declared to 58
the National Committee for Processed Data and Freedom. Written consent was obtained from 59
both parents. 60
The primary endpoints of the cohort were pre and post-natal growth, blood pressure, allergies, 61
infectious diseases, mental health and cognitive development. Dietary behavior was initially 62
collected as one of the main exposure factors in the cohort and was considered as a potential 63
mediating factor in the present study. 64
Data collected during pregnancy and at birth, include sociodemographic variables, maternal 65
smoking, gestational diabetes, parental anthropometric measurements, and newborn 66
characteristics (sex, gestational age, birthweight) (17). At four, eight and twelve months after 67
birth, mothers completed mailed questionnaires that provided detailed information on the 68
feeding method (exclusive breast-feeding, exclusive formula-feeding or mixed-diet) between 69
birth and four months, then at eight and twelve months as well as the date of breastfeeding 70
cessation. Breastfeeding duration was derived from these data (18). Clinical exams were also 71
conducted at birth, 1 year, 3 years and 5 years and were dedicated to collection of biological 72
sample, cognitive assessments by psychologists and measurement of anthropometric and 73
clinical parameters. 74
Genotyping and BMI Genetic Risk Score (BMI-GRS) generation
75
DNA was extracted from cord blood samples collected at birth. Genotypes at 16 single-76
nucleotide polymorphisms (SNPs) were measured at the Medical Research Council 77
Epidemiology Unit, Cambridge (iPLEX platform; Sequenom), as previously described (19). 78
Among the 32 loci identified by Speliotes et al. as having genome-wide significant 79
associations with BMI in adults (2), we considered in the present study the 16 SNPs also 80
showing associations with childhood BMI either in that original report (2) or in subsequent 81
data (4); they lie in or near NRXN3 (rs10146997), SLC39A8 (rs13107325), TNNI3K 82
(rs1514175), PTBP2 (rs1555543), MC4R (rs17782313), FLJ35779 (rs2112347), NEGR1 83
(rs2568958), RPL27A (rs4929949), TMEM18 (rs6548238), RBJ/POMC (rs713586), CADM2 84
(rs7640855), TRA2B/ETV5 (rs7647305), BDNF (rs925946), TFAP2B (rs987237), FTO 85
(rs9941349), and ZNF608 (rs4836133). The summary of genotyped SNPs and allele 86
frequencies in presented in supplementary table S1. All variants passed genotyping quality 87
control criteria (call rate, >95%; Hardy-Weinberg equilibrium, P > .01). 88
Combined obesity risk-allele scores, indicating genetic susceptibility to obesity, were 89
calculated for each participant as the sum of risk alleles (0, 1 or 2 at each locus) associated 90
with higher BMI across the 16 SNP loci. The score ranged from 0 to 32. To minimize dropout 91
due to missing genotype data, infants with missing genotype data at 4 (25%) or fewer loci 92
were imputed with the mean number of susceptibility alleles in their cohort for each locus. In 93
sensitivity analyses, we also computed a weighted BMI-GRS, where each risk allele was 94
multiplied by the ‘European only sex combined’ effect estimate for the BMI-increasing allele 95
reported by Locke and colleagues (1). 96
Child’s eating behavior
97
Maternal perception of infant’s appetite was assessed, at ages 4, 8 and 12 months, by one 98
question, translated as follow: “Usually, you would say that your baby: 1/ is always hungry or 99
demanding to feed 2/ demands to feed the same as other babies of the same age 3/ needs to be 100
stimulated to eat”, at ages 2 and 3 years, by one question: “Usually, you would say that your 101
child: 1/ is always hungry or asking to eat 2/ has a normal appetite compared with other 102
children of the same age 3/ is not often hungry”, and at 5 years by the Low Appetite scale 103
from the Children’s Eating Difficulties Questionnaire (20). From 4 months to 4 years, a high 104
appetite was defined as the category of children “always hungry or claiming to eat” and at 5 105
years as a Low Appetite score below the 10th percentile. 106
Infant diet was assessed by food records on three non-consecutive days (two weekdays and 107
one weekend day), when the infant was not sick, at 4, 8 and 12 months. Data were checked 108
and computerized a posteriori by a dietician. Nutrient intake was then calculated based on two 109
food composition databases, one specific to ready-prepared baby foods from the French baby 110
foods industry group (SFAE 2005) and one for common foods from the French Observatory 111
of Food Nutritional Quality (CIQUAL 2006) (21). Total nutrient intake was calculated only 112
among infants who were not breastfed during the three days of the dietary records, given that 113
the amount of breast milk intake could not be measured in breastfed infants. At each age, high 114
energy intake was defined as the highest quintile of energy intake. Unfortunately, energy 115
intake was not available in 2-5-year-old children, as diet was collected from a 24-item food 116
frequency questionnaire from 2 years instead of 3-d dietary records. 117
Child’s growth
118
At each clinical examination, child’s weight and height were measured. In between, weight 119
and height data were collected from self-administered questionnaires and from measurements 120
noted in the child’s health booklet by health professionals. Children had on average 22 weight 121
measurements (interquartile range 16–26) from birth to 5–6 years. Individual growth curves 122
were obtained for weight and height using the Jenss-Bayley growth curve model (22). This 123
model allows us to predict weight, length/height and then calculate BMI at any given age 124
(22). We used these model-based values of weight, length/height and BMI at 1, 2, 3, 4 and 5 125
y. At each age, the WHO growth standards were used for the calculation of weight-for-age, 126
length/height-for-age and BMI-for-age z-scores. The WHO Anthro SAS macro (WHO 127
Anthro, SAS Macro, Geneva: World Health Organization; 128
http://www.who.int/childgrowth/software/en/) was used for this calculation. 129
Sample selection
130
Of the 2002 women who were recruited, 76 women were excluded because they left the study 131
before or at the time of delivery, 24 because of miscarriages, intra-uterine death, or 132
discontinuation of pregnancy for medical reasons, and 9 because they delivered outside the 133
study hospitals. Data on birthweight were available for 1899 newborns. Among them, 134
genotyping data were available for 1324 children. Children without any data on eating 135
behavior from 4 months to 5 years (n=123) as well as those with missing data on age, sex, 136
growth, breastfeeding duration or maternal smoking (n=59) were excluded from the analyses. 137
Among the 1899 newborns with data on birth weight, the 1142 participants included in our 138
analyses were quite similar to those excluded concerning gender (p=0.9) and maternal pre-139
gestational BMI (p=0.12) but had older mothers (29.7 vs 29.1 years at delivery, p=0.007) and 140
were born with higher gestational age (39.4 vs. 39.0 weeks of amenorrhea, p<0.0001) and 141
higher birth weight (3324 g vs. 3210 g, p<0.0001). 142
Statistical analyses
143
Student t-tests, ²-tests and 1-way ANOVA were used to test differences between included 144
and excluded populations. 145
Associations between the obesity risk-allele score (BMI-GRS) and child’s eating behavior 146
were tested by Poisson regression models with robust standard errors, adjusted for recruitment 147
center, infant’s gender, and age at eating behavior assessment. Additional analyses were 148
conducted to adjust further for breastfeeding duration and maternal smoking during 149
pregnancy. 150
Associations between infant/child eating behavior and predicted child’s weight-for-age, 151
length/height-for age or BMI-for-age WHO z-scores were tested by linear regression models 152
adjusted for recruitment center, infant’s sex, age at eating behavior assessment. Additional 153
analyses were conducted to adjust further for breastfeeding duration, maternal smoking during 154
pregnancy and parental height. 155
Associations between BMI-GRS and predicted child’s weight, length/height or BMI z-scores 156
were tested by linear regression models adjusted for recruitment center and infant’s sex. 157
If an eating behaviour was associated with both the independent variable (BMI-GRS, path a, 158
Supplementary Figure S1) and the dependent variable (WHO z-score, path b), we tested for 159
the presence of mediation. Mediation is said to occur when a third variable lies on the causal 160
pathway between an exposure (in this case, the BMI-GRS) and an outcome (in this case, 161
WHO z-scores). To test for mediation, the linear regression of genetic risk score on each 162
WHO z-score was adjusted for the considered eating behaviour. The presence of mediation 163
was established using the Sobel test (23, 24) and quantified by the mediation ratio ((β-β’)/ β), 164
where β is the initial coefficient for BMI from the model WHO z-score ~ BMI-GRS (path c) 165
and β’ is the coefficient for WHO z-score after the model is additionally adjusted for the 166
eating behaviour (path c’). As high score on appetitive traits were considered as binary 167
variables, we used the method adapted by Jasti et al. to calculate the Sobel test (25). 168
We conducted sensitivity analyses using a weighted genetic risk score for BMI (WtBMI-169
GRS) instead ot the crude genetic risk score. To calculate this weighted score, at each locus, 170
the number of BMI increasing variants was multiplied by the effect estimate for the BMI-171
increasing variant from Speliotes et al (2). 172
All analyses were carried out using SAS V9.3 (SAS, Cary, NC). 173
Results
174
Among the 1142 mothers-child pairs with both genotyping data and eating behavior 175
assessment, mothers were aged on average 29.7 (SD=4.8) years, had a pre-pregnancy BMI of 176
23.1 (SD=4.3) kg/m2 and breastfed for 3.3 (SD=3.7) months. Children carried on average 13.7 177
(SD=2.5) obesity risk alleles, with a range of 5 to 22 obesity risk alleles. At 5 years, 6.6 % of 178
children were considered overweight or obese using IOTF definition (26). Children’s BMI 179
and appetitive traits are described in Supplementary table S2. 180
BMI-GRS related to eating behaviours
181
BMI-GRS was not significantly related to high energy intake at 4 mo and 8 mo but was 182
positively related to energy intake at 1 year (in infants who were not breastfed at time of 183
energy intake assessment) (Figure 1). Among all children, BMI-GRS was positively related 184
to maternal perception of high appetite between 8 months and 5 years, although not 185
significant in the first year or at 3 years. Further adjustment for breastfeeding duration and 186
maternal smoking during pregnancy did not substantially modify the associations (data not 187
shown). In sensitivity analyses, when considering the weighted BMI-GRS, results were 188
similar (data not shown). 189
Child’s eating behavior and growth parameters
190
Among children not breastfed during the 3-d dietary records, high energy intakes at 4 and 8 191
months were positively related to weight-for-age, length/ height-for-age and BMI-for-age z-192
scores (Table 1) from 1 to 5 years. High energy intake at 12 months was positively related to 193
weight-for-age z-score from 3 to 5 years but was not related to length/ height-for-age or BMI-194
for-age z-scores. 195
High appetite before 1 year was not clearly related to subsequent WHO’s z-scores. High 196
appetite was not related to length/height-for-age z-score, whatever the age considered. High 197
appetite at 1 year was positively related to weight-for-age or BMI-for-age z-scores up to 5 198
years but the strength of the association decreased with age and was no more significant for 199
BMI-for-age at 5 years. High appetite at 2 or 3 years was positively related to child’s 200
subsequent BMI-for-age z-score and, to a lesser extent, weight-for-age z-score. These 201
associations were mitigated by further adjustment for breastfeeding duration, maternal 202
smoking during pregnancy and parental height, the associations but remained significant, 203
except the association between high energy intake at 12 months and weight-for-age z-score 204
from 3 to 5 years (supplementary table S3) 205
Mediation analysis
206
The association between BMI-GRS and child’s size increased with age and became 207
significant from 3 years onwards for child’s weight (Figure 2A) and 4 years onwards for 208
child’s BMI (Figure 2B). High appetite at 2 years was the only eating behavior related to 209
both BMI-GRS and BMI, and therefore considered as a potential mediator in the association 210
between BMI-GRS and BMI. These associations were attenuated after adjustment for high 211
appetite at 2 years (Figure 2A and 2B). The Sobel test for mediation was significant but the 212
mediation was only partial with a mediation ratio decreasing with time from 47% for 2-y BMI 213
z-score (p=0.03) and 35% for 3-y BMI z-score (p=0.03) to 28% for 4-y BMI z-score (p=0.05) 214
and 24% for 5-y BMI (p=0.05). Similar results were found with the weighted BMI-GRS (data 215
not shown). 216
Discussion
217
In our study, the score of genetic predisposition to develop obesity was association with a 218
higher risk of high energy intake at 1 year, and high parental-perceived appetite at 2 and 5 219
years. The associations between the BMI-GRS and BMI-for-age or, to a lesser extent, weight-220
for-age z-scores were attenuated by further adjustment for high appetite at 2 years, whereas 221
BMI-GRS was not related to length/height-for-age z-score up to 5 years. Finally, among 222
infants not breastfed during the food records, energy intakes at 4 and 8 months were 223
positively related to child’s WHO z-scores until 5 years, but were not related to the BMI-224
GRS. 225
226
The association between genetic susceptibility to obesity and appetitive traits has been 227
previously examined in childhood but not so early in infancy. Within 8-11 years olds twins of 228
the TEDS study, Llewellyn et al. (14) showed that a BMI-GRS (based on 28 SNPs) was 229
related to both BMI and satiety sensitivity, and that the latter mediated the association with 230
BMI. However, in a study conducted by Steinsbeckk et al. within Norwegian children aged 231
from 4 to 6 years at inclusion (15), the BMI-GRS (based on 32 SNPs) was related to BMI 232
from 4 to 8 years, to BMI change from 4 to 6 years and from 6 to 8 years, but was associated 233
only with slowness in eating (negative association) at 6 years and not with other eating 234
behaviours (i.e. food responsiveness, emotional overeating, enjoyment of food or satiety 235
responsiveness). In that study, the association between the BMI-GRS and BMI was not 236
mediated by any appetitive trait assessed at age 6 years. 237
If evidence of a mediating effect of appetitive traits on the association between the BMI-GRS 238
and BMI remains scarce, many studies examined the influence of appetitive traits on BMI. 239
The associations shown in EDEN are in agreement with previous studies in spite of the 240
heterogeneity of ages and methods of investigation. In the GUSTO study (27), food 241
responsiveness at 3 months was related to higher BMI up to 15 months, whereas appetitive 242
traits assessed at 12 months were not related to BMI z-score in toddlers. Moreover, satiety 243
responsiveness in early childhood was found related to lower subsequent BMI (28, 29). 244
Similar results were found in the Gemini study (11), as all appetitive traits measured at 3 245
months of age were related to later weight, with stronger association for general appetite and 246
satiety responsiveness. In that study, the possibility of reverse causality was suggested by the 247
observation that weight at 9 months was also related to appetitive traits in toddlers, with 248
stronger association for food responsiveness, satiety responsiveness and general appetite. 249
Despite the positive associations between infant appetite and subsequent weight gain and also 250
between infant size and subsequent, the prospective influence of appetite on weight appeared 251
to be stronger than the reverse. 252
In our study, energy intake in the first months of life was related to growth throughout early 253
childhood. High energy intake could probably be considered as an indicator of rapid growth 254
during this period and rapid growth in infancy is related to higher risk of overweight later in 255
childhood in this and other cohorts (30). The influence of high energy intake on child’s 5-y 256
BMI is similar to the influence of high genetic predisposition to obesity (data not shown). 257
However, notably energy intake in infancy was not related to the BMI-GRS, and might be 258
more explained by prenatal or early postnatal exposures. We have to acknowledge that energy 259
intake was assessed only among infants who were not breastfed during the three days of the 260
dietary records, given that the amount of breast milk intake could not be measured in 261
breastfed infants. Moreover, from 2 years onwards, the dietary data collection was 262
unfortunately not designed to derive energy intake. 263
264
The main strength of this study is that eating behaviour and BMI were assessed repetitively 265
and prospectively from very early in infancy (as early as birth for BMI and four months for 266
eating behaviour), which permitted us to describe in detail the longitudinal patterns of 267
associations between the BMI-GRS, eating behaviour and BMI. However, appetite was 268
assessed only by one item, whereas other assessments, maybe based on more complex scales, 269
would have allowed us to check for consistency for this trait. Moreover, we have to 270
acknowledge that eating behaviour up to 3 years was not assessed by a validated tool up to 3 271
years as such tools were not developed when the EDEN study was designed. A validated tool 272
became available and was introduced only at the 5-y follow-up. Concerning the item on 273
appetite, a similar item was used by previous studies (10, 11) and associations with this item 274
were similar to those with other appetitive traits, if not stronger. Moreover, in the EDEN 275
study, we found similar associations at 5 years, when appetite was assessed by a validated 276
scale (20). As appetitive traits were reported by parental questionnaires and not assessed by a 277
laboratory tool, this measurement could be influenced by social desirability. Finally, because 278
of the originality and the uniqueness of the collected data, our results yet rely on data from 279
only one cohort. Further studies conducted in other birth cohorts would be necessary to 280
confirm and demonstrate the generalizability of these findings. Ideally, these studies would be 281
designed with repeated use of validated tools throughout early childhood to assess eating 282
behaviour or energy intake and conducted in populations with higher prevalence of 283
overweight. As previous studies have shown that these BMI variants could to be relevant also 284
to other non-Caucasian populations (31, 32), it would be interesting to conduct similar 285
analyses in non-Caucasian populations. 286
287
Conclusion
288
The study provides further support from a prospective study for a partial mediation by 289
appetitive traits on the relationship between genetic susceptibility and BMI. In particular, in 290
the EDEN birth cohort, genetic susceptibility to childhood and adult obesity seems to play a 291
very precocious role by influencing appetitive traits in infants and preschool children and 292
subsequently promote faster growth. Despite the more typically recognised concerns 293
regarding infant feeding difficulties, many parents might benefit from counselling and support 294
to manage high appetitive traits in their infants and young children to prevent later obesity 295
risk. 296
Sources of support
298
The EDEN study is supported by: Fondation pour la Recherche Médicale (FRM), French 299
Ministry of Research: Federative Research Institutes and Cohort Program, INSERM Human 300
Nutrition National Research Program, and Diabetes National Research Program (through a 301
collaboration with the French Association of Diabetic Patients (AFD)), French Ministry of 302
Health, French Agency for Environment Security (AFSSET), French National Institute for 303
Population Health Surveillance (InVS), Paris–Sud University, French National Institute for 304
Health Education (INPES), Nestlé, Mutuelle Générale de l’Education Nationale (MGEN), 305
French speaking association for the study of diabetes and metabolism (ALFEDIAM), 306
National Agency for Research (ANR non thematic program), National Institute for Research 307
in Public health (IRESP: TGIR 2008 cohort in health program). The genotyping was funded 308
by a Collaborative Research Grant from the European Society for Paediatric Endocrinology. 309
KKO is supported by the Medical Research Council (Unit program: MC_UU_12015/2). 310
Acknowledgment section
311
None of the authors have any financial relationships or conflict of interest to disclose. 312
313
BLG and BH designed the research and wrote the manuscript. BLG, YAK, JB, AF and SC 314
analysed the data. BH and MAC oversaw the EDEN study. BH, KC, VP, KKO and MAC 315
were responsible for data collection and genotyping in EDEN. All authors reviewed drafts, 316
provided critical feedback, approved the final manuscript and were responsible for the final 317
content of the paper. BH had full access to all the data in the study and takes responsibility for 318
the integrity of the data and the accuracy of the data analysis. 319
References
1. Locke AE, Kahali B, Berndt SI, et al. Genetic studies of body mass index yield new insights for obesity biology. Nature 2015; 518, 197-206.
2. Speliotes EK, Willer CJ, Berndt SI, et al. Association analyses of 249,796 individuals reveal 18 new loci associated with body mass index. Nat Genet 2010; 42, 937-48.
3. Belsky DW, Moffitt TE, Houts R, et al. Polygenic risk, rapid childhood growth, and the development of obesity: evidence from a 4-decade longitudinal study. Arch Pediatr Adolesc Med 2012; 166, 515-21.
4. Elks CE, Heude B, de Zegher F, et al. Associations between genetic obesity susceptibility and early postnatal fat and lean mass: an individual participant meta-analysis. JAMA Pediatr 2014; 168, 1122-30.
5. Elks CE, Loos RJ, Hardy R, et al. Adult obesity susceptibility variants are associated with greater childhood weight gain and a faster tempo of growth: the 1946 British Birth Cohort Study. Am J Clin Nutr 2012; 95, 1150-6.
6. Elks CE, Loos RJ, Sharp SJ, et al. Genetic markers of adult obesity risk are associated with greater early infancy weight gain and growth. PLoS Med 2010; 7, e1000284.
7. Day FR and Loos RJ. Developments in obesity genetics in the era of genome-wide association studies. J Nutrigenet Nutrigenomics 2011; 4, 222-38.
8. Elder SJ, Neale MC, Fuss PJ, et al. Genetic and Environmental Influences on Eating Behavior - A Study of Twin Pairs Reared Apart or Reared Together. Open Nutr J 2012; 6, 59-70.
9. Llewellyn CH, van Jaarsveld CH, Boniface D, Carnell S and Wardle J. Eating rate is a heritable phenotype related to weight in children. Am J Clin Nutr 2008; 88, 1560-6. 10. Llewellyn CH, van Jaarsveld CH, Plomin R, Fisher A and Wardle J. Inherited behavioral susceptibility to adiposity in infancy: a multivariate genetic analysis of appetite and weight in the Gemini birth cohort. Am J Clin Nutr 2012; 95, 633-9.
11. van Jaarsveld CH, Llewellyn CH, Johnson L and Wardle J. Prospective associations between appetitive traits and weight gain in infancy. Am J Clin Nutr 2011; 94, 1562-7. 12. Emond JA, Tovar A, Li Z, Lansigan RK and Gilbert-Diamond D. FTO genotype and weight status among preadolescents: Assessing the mediating effects of obesogenic appetitive traits. Appetite 2017; 117, 321-329.
13. Wardle J, Carnell S, Haworth CM, Farooqi IS, O'Rahilly S and Plomin R. Obesity associated genetic variation in FTO is associated with diminished satiety. J Clin Endocrinol Metab 2008; 93, 3640-3.
14. Llewellyn CH, Trzaskowski M, van Jaarsveld CH, Plomin R and Wardle J. Satiety mechanisms in genetic risk of obesity. JAMA Pediatr 2014; 168, 338-44.
15. Steinsbekk S, Belsky D, Guzey IC, Wardle J and Wichstrom L. Polygenic Risk, Appetite Traits, and Weight Gain in Middle Childhood: A Longitudinal Study. JAMA Pediatr 2016; 170, e154472.
16. Heude B, Forhan A, Slama R, et al. Cohort Profile: The EDEN mother-child cohort on the prenatal and early postnatal determinants of child health and development. Int J Epidemiol 2016; 45, 353-63.
17. Regnault N, Botton J, Forhan A, et al. Determinants of early ponderal and statural growth in full-term infants in the EDEN mother-child cohort study. Am J Clin Nutr 2010;
18. Betoko A, Charles MA, Hankard R, et al. Infant feeding patterns over the first year of life: influence of family characteristics. Eur J Clin Nutr 2013; 67, 631-637.
19. Li S, Zhao JH, Luan J, et al. Cumulative effects and predictive value of common obesity-susceptibility variants identified by genome-wide association studies. Am J Clin Nutr 2010; 91, 184-90.
20. Rigal N, Chabanet C, Issanchou S and Monnery-Patris S. Links between maternal feeding practices and children's eating difficulties. Validation of French tools. Appetite 2012; 58, 629-37.
21. ANSES. French food composition table [internet] 2015, France: French Agency for Food, Environmental and Occupational Health & Safety (ANSES). 2015.
22. Botton J, Scherdel P, Regnault N, Heude B, Charles MA and Eden Mother-Child Cohort Study Group. Postnatal weight and height growth modeling and prediction of body mass index as a function of time for the study of growth determinants. Ann Nutr Metab 2014; 65, 156-66.
23. Mackinnon DP, Warsi G and Dwyer JH. A Simulation Study of Mediated Effect Measures. Multivariate Behav Res 1995; 30, 41.
24. Sobel ME. Asymptotic intervals for indirect effect in structural equations models. In Sociological methodology, ed. Leinhart S, 1982, pp 290-312 San Francisco: Jossey-Bass.
25. Jasti S, Dudley WN and Goldwater E. SAS macros for testing statistical mediation in data with binary mediators or outcomes. Nurs Res 2008; 57, 118-22.
26. Cole TJ, Bellizzi MC, Flegal KM and Dietz WH. Establishing a standard definition for child overweight and obesity worldwide: international survey. BMJ 2000; 320, 1240-3.
27. Quah PL, Chan YH, Aris IM, et al. Prospective associations of appetitive traits at 3 and 12 months of age with body mass index and weight gain in the first 2 years of life. BMC Pediatr 2015; 15, 153.
28. de Barse LM, Tiemeier H, Leermakers ET, et al. Longitudinal association between preschool fussy eating and body composition at 6 years of age: The Generation R Study. Int J Behav Nutr Phys Act 2015; 12, 153.
29. Mallan KM, Nambiar S, Magarey AM and Daniels LA. Satiety responsiveness in toddlerhood predicts energy intake and weight status at four years of age. Appetite 2014; 74, 79-85.
30. Botton J, Heude B, Maccario J, Ducimetière P and Charles MA. Postnatal weight and height growth velocities at different ages between birth and 5 years and body composition in adolescent boys and girls. Am J Clin Nutr 2008; 87, 1760-8.
31. Dorajoo R, Ong RT, Sim X, et al. The contribution of recently identified adult BMI risk loci to paediatric obesity in a Singaporean Chinese childhood dataset. Pediatr Obes 2017; 12, e46-e50.
32. Zandoná MR, Sangalli CN, Campagnolo PdB, Vitolo MR, Almeida S and Mattevi VS. Validation of obesity susceptibility loci identified by genome-wide association studies in early childhood in South Brazilian children. Pediatric Obesity 2017; 12, 85-92.
Figure 1. Association between obesity risk-allele score and child’s eating behaviour, up to 5 years
R
el
at
iv
e
ri
sk
s
fo
r
h
ig
h
s
co
re
p
er
r
is
k
al
le
le
High appetite (always hungry)High energy intake (highest quintile)
Figure legend. Results are RR [95% CI], adjusted for recruitment’s center, child’s age and sex (n=1081 at 4mo, 1072 at 8 mo, 1024 at 1 year, 940 at 2 years, 892 at 3 years and 790 at 5 years). Energy intake was assessed only on infants who were not breastfed during the 3-d dietary records. (679 at 4 mo, 861 at 8 mo and 822 at 12 mo)
Figure 2. Association between the obesity risk-allele score and child’s WHO z-scores from 2 to 5 years
Weight-for-age
Height-for-age
BMI-for-age
Ef
fe
ct
s
iz
e
o
n
z
-s
co
re
p
er
r
is
k
al
le
le
Figure legend. Results are effect size [95% CI], adjusted for recruitment center and infant’s sex (n=1142). Results are effect size [95% CI], adjusted for recruitment center, infant’s sex, child’s age and high appetite at 2 years (n=940).
S
UPPORTING INFORMATIONTable S1. BMI and eating behaviour traits of children at different assessment steps
SNP Locus Effect allele Other allele SNP reported in GIANT
Evidence for association with childhood BMI LD with GIANT SNP (r2) EAF in EDEN rs10146997 NRXN3 G A rs10150332 Reported in Speliotes et al. 1.0 0.18 rs13107325 SLC39A8 T C rs13107325 Reported in Elks et al. - 0.08 rs1514175 TNNI3K A G rs1514175 Reported in Speliotes et al. - 0.38 rs1555543 PTBP2 C A rs1555543 Reported in Speliotes et al. - 0.55 rs17782313 MC4R C T rs571312 Reported in den Hoed et al. 0.96 0.21 rs2112347 FLJ35779 T G rs2112347 Reported in Elks et al. - 0.61 rs2568958 NEGR1 A G rs2815752 Reported in den Hoed et al. 0.96 0.57 rs4836133 ZNF608 A C/G rs4836133 Reported in Elks et al. - 0.40 rs4929949 RPL27A C T rs4929949 Reported in Speliotes et al. - 0.45 rs6548238 TMEM18 C T rs2867125 Reported in den Hoed et al. 1.0 0.81 rs713586 RBJ/POMC C T rs713586 Reported in Speliotes et al. - 0.44 rs7640855 CADM2 A G rs13078807 Reported in Speliotes et al. 1.0 0.17 rs7647305 TRA2B C T rs9816226 Reported in den Hoed et al. 0.72 0.71 rs925946 BDNF T G rs10767664 Reported in den Hoed et al. 1.0 0.25 rs987237 TFAP2B G A rs987237 Reported in Elks et al. - 0.15 rs9941349 FTO T C rs1558902 Reported in den Hoed et al. 0.84 0.38
Effect allele refers to the allele associated with higher BMI in the Genetic Investigation of Anthropometric Traits (GIANT) consortium (Speliotes et al., Ref. 2).
EAF: Effect allele frequency.
LD: Linkage Disequilibrium; calculated based on 1000 Genomes pilot 1 data using SNAP (https://www.broadinstitute.org/mpg/snap/).
References
Speliotes EK, Willer CJ, Berndt SI, et al. Association analyses of 249,796 individuals reveal 18 new loci associated with body mass index. Nature Genetics. 2010;42(11):937-948. den Hoed M, Ekelund U, Brage S, et al. Genetic susceptibility to obesity and related traits in
childhood and adolescence; influence of loci identified by genome-wide association studies. Diabetes. 2010 2010;59(11):2980-2988.
Elks CE, Heude B, de Zegher F, et al. Associations between genetic obesity susceptibility and early postnatal fat and lean mass: an individual participant meta-analysis. JAMA Pediatr 2014; 168, 1122-30.
Table S2. BMI and eating behaviour traits of children at different assessment steps
4 months 8 months 1 year 2 years 3 years 5 years
N 1081 1072 1024 940 892 790
Age (months) 4.3 (1.0) 8.3 (0.8) 12.1 (0.7) 24.4 (1.3) 37.9 (0.9) 67.7 (1.9) Predicted BMI (kg/m2) 16.9 (1.3) 17.1 (1.3) 16.8 (1.2) 16.2 (1.2) 15.9 (1.2) 15.4 (1.3)
High appetite (always hungry)a 3.7% (40) 1.9% (20) 3.1% (32) 5.1% (48) 7.2% (64) 9.0% (71)
Energy intake (kcal)
among children not receiving breastmilk during the 3-d record
n=680 589 (104) n=861 716 (135) n=822 809 (135) Values are means (sd) or % (n).
a
Table S3. Association between eating behaviour and child’s WHO z-scores after further adjustment on parental height, maternal smoking during pregnancy and breastfeeding duration
Age at WHO z-score assessment
N 1 year 2 years 3 years 4 years 5 years
Outcome: Weight-for-age z-score
High energy intake (highest quintile)
4 months 629 0.39 [0.23 ; 0.55] 0.31 [0.15 ; 0.46] 0.25 [0.09 ; 0.41] 0.21 [0.05 ; 0.36] 0.18 [0.02 ; 0.33]
8 months 791 0.33 [0.19 ; 0.47] 0.29 [0.15 ; 0.43] 0.24 [0.10 ; 0.38] 0.19 [0.05 ; 0.33] 0.15 [0.02 ; 0.29]
12 months 767 0.04 [-0.10 ; 0.19] 0.07 [-0.07 ; 0.22] 0.09 [-0.06 ; 0.23] 0.09 [-0.05 ; 0.23] 0.09 [-0.05 ; 0.23] High appetite (always hungry)
4 months 993 0.32 [0.04 ; 0.59] 0.21 [-0.07 ; 0.48] 0.14 [-0.14 ; 0.42] 0.09 [-0.18 ; 0.37] 0.06 [-0.21 ; 0.34] 8 months 987 0.28 [-0.10 ; 0.66] 0.23 [-0.14 ; 0.61] 0.17 [-0.21 ; 0.55] 0.11 [-0.26 ; 0.49] 0.08 [-0.3 ; 0.45] 1 year 945 0.21 [-0.10 ; 0.51] 0.23 [-0.08 ; 0.53] 0.20 [-0.11 ; 0.51] 0.16 [-0.14 ; 0.47] 0.14 [-0.17 ; 0.44] 2 years 868 0.32 [0.08 ; 0.56] 0.28 [0.04 ; 0.53] 0.24 [0.00 ; 0.48] 0.20 [-0.04 ; 0.44] 3 years 826 0.28 [0.06 ; 0.50] 0.24 [0.02 ; 0.46] 0.21 [-0.01 ; 0.43] 5 years 738 0.41 [0.20 ; 0.61]
Outcome : Length/Height-for-age z-score
High energy intake (highest quintile)
4 months 629 0.25 [0.08 ; 0.42] 0.13 [-0.04 ; 0.29] 0.11 [-0.06 ; 0.28] 0.10 [-0.06 ; 0.26] 0.11 [-0.05 ; 0.27] 8 months 791 0.21 [0.06 ; 0.35] 0.20 [0.05 ; 0.34] 0.18 [0.03 ; 0.33] 0.13 [0.00 ; 0.27] 0.11 [-0.03 ; 0.25] 12 months 767 0.11 [-0.05 ; 0.26] 0.09 [-0.05 ; 0.24] 0.10 [-0.06 ; 0.25] 0.09 [-0.06 ; 0.23] 0.08 [-0.06 ; 0.23] High appetite (always hungry)
4 months 993 0.07 [-0.23 ; 0.37] 0.03 [-0.26 ; 0.32] 0.04 [-0.26 ; 0.34] 0.05 [-0.22 ; 0.33] 0.07 [-0.21 ; 0.35] 8 months 987 0.15 [-0.25 ; 0.55] 0.11 [-0.28 ; 0.50] 0.08 [-0.33 ; 0.48] 0.05 [-0.33 ; 0.42] 0.02 [-0.36 ; 0.40] 1 year 945 -0.27 [-0.59 ; 0.06] -0.22 [-0.53 ; 0.09] -0.18 [-0.50 ; 0.15] -0.12 [-0.42 ; 0.18] -0.07 [-0.38 ; 0.23] 2 years 868 -0.20 [-0.45 ; 0.05] -0.20 [-0.46 ; 0.07] -0.17 [-0.41 ; 0.07] -0.16 [-0.41 ; 0.08] 3 years 826 0.11 [-0.12 ; 0.34] 0.09 [-0.13 ; 0.30] 0.07 [-0.15 ; 0.29]
5 years 738 0.30 [0.09 ; 0.50] Outcome: BMI-for-age z-score
High energy intake (highest quintile)
4 months 629 0.35 [0.18 ; 0.52] 0.33 [0.16 ; 0.51] 0.28 [0.11 ; 0.45] 0.21 [0.04 ; 0.38] 0.16 [-0.01 ; 0.33] 8 months 791 0.29 [0.14 ; 0.44] 0.25 [0.10 ; 0.40] 0.21 [0.05 ; 0.36] 0.16 [0.02 ; 0.31] 0.14 [-0.01 ; 0.28] 12 months 767 -0.02 [-0.18 ; 0.13] 0.03 [-0.13 ; 0.18] 0.05 [-0.11 ; 0.20] 0.06 [-0.10 ; 0.21] 0.06 [-0.09 ; 0.21] High appetite (always hungry)
4 months 993 0.37 [0.08 ; 0.66] 0.27 [-0.03 ; 0.57] 0.17 [-0.13 ; 0.47] 0.09 [-0.20 ; 0.38] 0.03 [-0.26 ; 0.33] 8 months 987 0.27 [-0.13 ; 0.67] 0.25 [-0.16 ; 0.66] 0.19 [-0.22 ; 0.60] 0.14 [-0.26 ; 0.54] 0.11 [-0.29 ; 0.51] 1 year 945 0.49 [0.17 ; 0.81] 0.52 [0.20 ; 0.85] 0.45 [0.12 ; 0.78] 0.35 [0.02 ; 0.67] 0.27 [-0.05 ; 0.59] 2 years 868 0.64 [0.38 ; 0.90] 0.60 [0.34 ; 0.86] 0.52 [0.26 ; 0.78] 0.46 [0.20 ; 0.72] 3 years 826 0.32 [0.08 ; 0.56] 0.29 [0.05 ; 0.52] 0.27 [0.03 ; 0.50] 5 years 738 0.35 [0.13 ; 0.57]
Results are effect size [95% CI] of high level of the considered appetitive trait on WHO z-score, adjusted for recruitment centre, infant’s sex, age at eating behaviour assessment, parental height, maternal smoking during pregnancy and breastfeeding duration. Significant results are highlighted in bold.
a
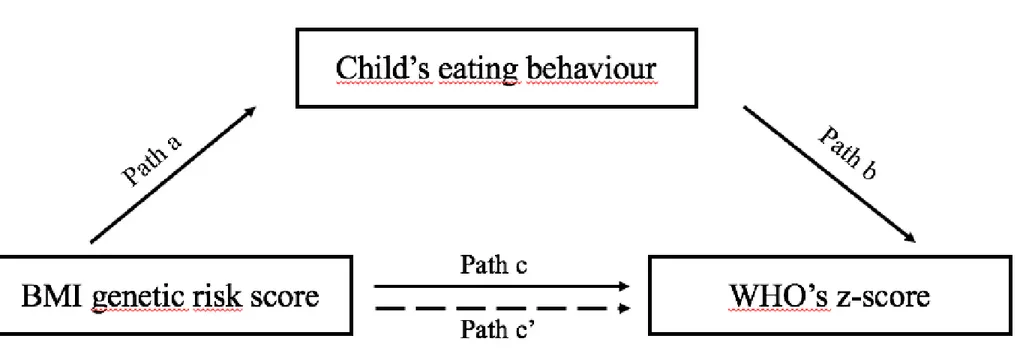
Figure S1. Figure depicting the mediation analyses.
Path a shows the association between the BMI genetic risk score and eating behaviour Path b shows the association between eating behaviour and WHO’s z-score
Path c shows the relationship between the BMI genetic risk score and WHO’s z-score
Path c' shows the relationship between the BMI genetic risk score and WHO’s z-score, adjusted for the considered eating behaviour

![Figure legend. Results are RR [95% CI], adjusted for recruitment’s center, child’s age and sex (n=1081 at 4mo, 1072 at 8 mo, 1024 at 1 year, 940 at 2 years, 892 at 3 years and 790 at 5 years)](https://thumb-eu.123doks.com/thumbv2/123doknet/14665357.555434/21.1263.132.1146.257.748/figure-legend-results-adjusted-recruitment-center-child-years.webp)