HAL Id: hal-03209941
https://hal.archives-ouvertes.fr/hal-03209941
Submitted on 27 Apr 2021HAL is a multi-disciplinary open access archive for the deposit and dissemination of sci-entific research documents, whether they are pub-lished or not. The documents may come from teaching and research institutions in France or abroad, or from public or private research centers.
L’archive ouverte pluridisciplinaire HAL, est destinée au dépôt et à la diffusion de documents scientifiques de niveau recherche, publiés ou non, émanant des établissements d’enseignement et de recherche français ou étrangers, des laboratoires publics ou privés.
French college students? A longitudinal epidemiological
study: the i-Share cohort
Julie Arsandaux, Gregory Michel, Marie Tournier, Christophe Tzourio, Cedric
Galera
To cite this version:
Julie Arsandaux, Gregory Michel, Marie Tournier, Christophe Tzourio, Cedric Galera. Is self-esteem associated with self-rated health among French college students? A longitudinal epidemiological study: the i-Share cohort. BMJ Open, BMJ Publishing Group, 2019, 9 (6), pp.e024500. �10.1136/bmjopen-2018-024500�. �hal-03209941�
Is self-esteem associated with self-rated
health among French college students?
A longitudinal epidemiological study:
the i-Share cohort
Julie Arsandaux, 1 Grégory Michel,1 Marie Tournier,1,2 Christophe Tzourio,1 Cédric Galéra1,2
To cite: Arsandaux J, Michel G,
Tournier M, et al. Is self-esteem associated with self-rated health among French college students? A longitudinal epidemiological study: the i-Share cohort. BMJ Open 2019;9:e024500. doi:10.1136/
bmjopen-2018-024500 ►Prepublication history and additional material for this paper are available online. To view these files, please visit the journal online (http:// dx. doi. org/ 10. 1136/ bmjopen- 2018- 024500).
Received 4 June 2018 Revised 27 March 2019 Accepted 16 April 2019
1Team HEALTHY, UMR 1219,
F-33000, University of Bordeaux, Inserm, Bordeaux Population Health Research Center, Bordeaux, France
2Centre Hospitalier Perrens,
Bordeaux, France
Correspondence to
Julie Arsandaux;
julie. arsandaux@ u- bordeaux. fr © Author(s) (or their employer(s)) 2019. Re-use permitted under CC BY-NC. No commercial re-use. See rights and permissions. Published by BMJ.
AbstrACt
Objectives The aim of the study was to estimate the
association between esteem and subsequent self-rated health during college years, taking into account a wide range of potential confounders.
Design Prospective longitudinal study. setting The French i-Share cohort.
Participants The sample consisted of 1011 college
students.
Primary and secondary outcome measures The
association between self-esteem and later self-rated health was evaluated using multivariate modelling. Data regarding self-rated health, global self-esteem
and demographic, educational, social, behavioural, environmental and financial characteristics were collected through an internet-based questionnaire.
results The 1011 participants had a median age of
21.9 years and 79% (795/1011) were females. Self-rated health was assessed a median of 8 months after the self-esteem measurement. Twenty per cent of the students declared average to very poor health (203/1011). Students with higher levels of self-esteem were more likely to declare good or very good self-rated health (adjusted OR=1.40, 95% CI 1.15 to 1.72, p value=0.001). Other factors associated with good or very good self-rated health were low body mass index, a comfortable financial situation during childhood and three personality traits (low persistence and harm avoidance and high cooperativeness).
Conclusions This study offers novel findings on the
impact of self-esteem on self-rated health among college students. Interventions targeting self-esteem should be experimented during university years in order to improve health outcomes.
IntrODuCtIOn
Self-rated health is considered to be a rele-vant indicator of general health. The high validity, reliability and predictive power of self-rated health make it one of the best predictors of objective health problems (including mortality) and healthcare util-isation.1–5 Collection of self-rated health is
recommended by the WHO as a standard and cost-effective measure in health surveys.6–9
Associations between self-rated health and mortality persist even after objective health adjustment, suggesting that self-rated health could constitute an inclusive and universal predictor alongside clinical examination, medical records or self-reports of medical conditions.10
Determinants of self-rated health prob-lems have attracted interdisciplinary interest. Several studies have investigated demo-graphic, educational, social, behavioural, environmental and financial determinants.11
In addition, a few studies have emphasised the associations between psychosocial resources and self-rated health assessment.12 13 However,
there are important limitations in the litera-ture that should be underlined.
First, despite recent research, psychosocial resources have been insufficiently investi-gated in the literature.13 Among individual
characteristics, the impact of self-esteem (ie, the overall aggregated opinion of oneself at any one time, as defined by Rosenberg) on
strengths and limitations of this study
► The present study is based on a prospective design with a large number of participants.
► A broad adjustment was made for confounders to estimate unbiased association.
► This study investigates self-rated health among col-lege students, a population that has received less attention in the literature.
► Participants were volunteers in the i-Share proj-ect, which may have caused a sampling bias. Extrapolation to other student populations may be limited.
► Reverse causation between self-esteem and self-rated health may exist and could not be investi-gated with our design.
Superieur (ABES). Protected by copyright.
on January 15, 2021 at Agence Bibliographique de l Enseignement
the rating of one’s health remains poorly understood. Yet, it should be noted that self-esteem is a potentially modifi-able factor. If self-esteem is predictive of self-rated health independently of other psychosocial confounders, it could represent a specific target for preventive interventions aimed at improving general health. To our knowledge, only two studies have estimated the association between self-esteem and self-rated health, and none among college students.14 These studies have reported a
signif-icant relationship supporting the hypothesis that high self-esteem is associated with better self-rated health. In addition, a number of studies have evidenced associations between self-esteem and several important health-related outcomes: academic success, well-being and internalised/ externalised mental health problems.15 16
Second, the population of college students has received little attention in this specific domain. Yet this period corresponding to the transition between adolescence and adulthood is crucial for the development of individuals, as well as for constructing and reinforcing self-esteem. Although the student population is in relatively good health, it is noteworthy that mental health and substance use issues are prevalent during the college years.17–19 On
the one hand, self-rated health can serve to evaluate a general health status predicting future health problems before they set in. On the other hand, college is a period of development in which interventions could modify the onset of determinants such as psychosocial resources.
A final limitation is the lack of studies that adjust compre-hensively for various risk factors (ie, the six domains reported above). This implies possible confounding biases that need to be addressed.
The aim of the present study was to estimate the associa-tion between self-esteem and subsequent self-rated health during college years, taking into account a wide range of potential confounders in the i-Share cohort.
MethODs study population
This study is based on the internet-based Students Health Research Enterprise (i-Share, www. i- share. fr) project, a prospective population-based cohort study of students in higher education institutions in France. The i-Share cohort is one of the largest epidemiological studies conducted on European students and constitutes an opportunity to investigate this research question, thanks to its longitudinal collection of multidimensional data on childhood and family history, lifestyle, health infor-mation, living conditions and mental and psychosocial examinations.20 21 The objectives of the i-Share cohort
are to evaluate important health aspects among univer-sity students over the course of 10 years. The eligibility criteria are to be officially enrolled at a university or higher education institution; to be at least 18 years of age; to be able to read and understand French; and to provide informed consent for participation. Recruitment started in February 2013 and is still ongoing. Students are
informed about the objectives of the study through promo-tion campaigns. In particular, a group of trained students inform their peers about the study and initiate the online recruitment process. The baseline inquiry collected infor-mation on students’ health, personal and family medical histories, sociodemographic characteristics and lifestyle habits. Afterwards, students receive an e-mail invitation to complete follow-up questionnaires annually (on each anniversary of the date of the baseline questionnaire) for 10 years and for substudy data collection. As of 6 February 2016, 14 795 participants were included in the cohort, with the average age being 21 years and 74% were female. The response rate for 1 year follow-up was 18% (n=2607). Since December 2015, an optional mental health survey has been conducted to provide data on several dimen-sions of mental and psychological health. For this specific study, we used the data available as of 29 April 2016. We used a longitudinal design to compare self-esteem data collected during the mental health substudy (time 2) with the next planned assessment of self-rated health (ie, during the first follow-up of the cohort, time 3). We used baseline characteristics collected at cohort inclusion for adjustment (time 1). Online supplementary figure S1 in the supplementary material describes the study timeline. Only college students aged between 18 and 30 years old and participating in the mental health substudy before their first follow-up were included. The i-Share project on which this study was based was approved by the Commission Nationale de l'Informatique et des Libertés (DR-2013–019).
Patient and public involvement
No participants were involved in setting the research questions or measurements or in developing plans for the design of the study. No participants were asked to advise on the interpretation or writing up of results. However, there are plans to disseminate the results of the research to study participants via the i-Share website and social media and by means of a quarterly newsletter sent to participants via email. A group of trained students also participated during the recruitment process (ie, informed their peers about the study and initiated the online recruitment process). These students were also involved in the communication campaign, advising the study team about priority messages and communication tools.
Measures and scales
Outcome: self-rated health
Students gauged their current general self-rated health by the question: ‘Do you consider your current health?’ with a five-point response scale ranging from 1 to 5 (1=‘Very
poor’/2=”Poor’/3=‘Average’/4=”Good’/5=‘Very good’). The
variable was dichotomised as follows: ‘Very good/Good’ versus ‘Average/Poor/ Very poor’. Psychometric performance of this assessment has been reported in two papers.7 8
Self-rated health was measured at inclusion of the partic-ipant and in follow-up questionnaires. The first follow-up
Superieur (ABES). Protected by copyright.
on January 15, 2021 at Agence Bibliographique de l Enseignement
self-rated health measure corresponded to the primary outcome of this study (time 3).
Main variable of interest: self-esteem
Self-esteem was assessed using the Self-Esteem Scale,22 a 10-item self-report measure of global self-esteem. Each item is answered on a 4-point Likert type scale ranging from 1=‘Strongly disagree’ to 4=‘Strongly agree’. The score can range from 10 (low level of self-esteem) to 40 (high level of self-esteem). The Rosenberg Self-Esteem Scale is the most widely used instrument for the measurement of global self-esteem.23 It was translated into French,
and its high reliability and validity were confirmed with a French sample.24 Self-esteem measurement was part of
the optional mental health survey (time 2). We used a continuous score for the primary analysis.
Covariates
All the covariates were collected through the self-admin-istered online questionnaire at cohort enrolment (time 1), except for the psychosocial covariates that were part of the mental health substudy (ie, at the same time as self-esteem measurement, time 2). They all preceded the outcome to keep the longitudinal sequence between predictors and outcome. The covariates included in this study covered the six domains of potential determinants of self-rated health described in the literature:11
Demographic covariates
We built the following demographic variables: sex (male/female) and age (in years when the outcome was measured, time 3).
Academic covariates
Education level of student was collected at cohort inclusion
and categorised into: freshman, sophomore, junior and senior. For parental education level, we used the education level of the parents declared by the students (at least one of their parents had a higher education level than bacca-laureate vs not).
Financial covariates
Self-rated economic situation during childhood (‘Very diffi-cult’/‘Difficult’/‘Correct’ vs ‘Comfortable’/‘Very comfortable’)
and self-rated satisfaction about financial resources during
college (‘Very satisfied’/‘Rather satisfied’ vs ‘Satisfied’/‘Rather dissatisfied’/‘Totally unsatisfied’).
Social covariates
Students’ living conditions (cohabitation with parents, flatsharing/couple or alone) and self-rated familial support
during childhood (weak: ‘None at all’/‘A little’/‘Moderate’ vs
high: ‘A lot’/‘Enormous’).
Geographical covariates
Students included in this study were spread over the French territory. To take disparities across college campuses into account we selected the four most constitutive cities of the
registration university in the sample (Bordeaux/Versailles/
Nice/Paris/other).
Behavioural covariates
Tobacco consumption (none, ≤10 cigarettes/day and >10 cigarettes/day). Binge drinking frequency was defined as drinking at least six drinks on the same occasion (evening) (never, rarely if ‘Once a year’, occasionally if ‘several times a
year’/‘once a month’, frequently if ‘once a week or less’/‘2 to 3 times a week’/‘4 to 6 times a week’). Then students declared
whether they consumed psychoactive substances at least once in their life, from cannabis, ecstasy, amphetamines, nitrous oxide, inhalation products and cocaine. To deter-mine physical activity frequency, we combined walking times and sports by summing the count number of duration in minutes per day (<25, between 25 and 35 and >35).
Body mass index (BMI) (<25 vs ≥25 kg/m²). Finally, good nutritional habits was based on adherence to The French National Nutrition and Health Program.25 Each of the
seven nutrition recommendations was coded 0 if not followed and 1 if followed. The sum (seven representing the highest adherence to recommendations and 0 the lowest) was computed.
Psychosocial covariates
Coping was measured by the Student Coping Scale.26 Three
subscores were computed representing social support coping, emotional coping and festive coping (a higher score represented higher coping resources). Aggressiveness was measured by an adaptation of the Brown-Goodwin assessment for Life History of Aggression, translated into French by Bellivier.27 Higher scores represented higher
aggressiveness. Impulsivity was measured by an Adolescent Version of the Barratt Impulsiveness Scale-11 translated into French by Coudrey F and Michel G.28 Higher scores
represented higher impulsivity. Personality traits were measured by the Temperament and Character Inventory translated into French by Pélissolo F.29 30 Six subscores
were computed: novelty seeking, persistence, harm avoid-ance, determination, reward dependence and coopera-tiveness. Higher scores represented greater adherence to the type of personality.
Objective health indicator
Participants with at least one medical diagnosis for mental or physical diseases or disability at cohort inclusion.
study size
We performed a sample size calculation for logistic regression between self-esteem and self-rated health, alpha 0.05 and power 0.90. Based on two French studies among college students, we assumed that the distribution of self-esteem was normal (mean=28.9, SD=5.7).31 32 The
proportion of participants declaring having good or very good health has been estimated in two studies in Sweden and Italy among college students to be 13% and 23%, respectively.33 34 We assumed the OR to be 1.1 based on
the only two studies reported among high school students in South Korea and adults in Canada.14 The minimum
Superieur (ABES). Protected by copyright.
on January 15, 2021 at Agence Bibliographique de l Enseignement
required sample size was between 232 and 344 based on self-rated health proportions (SAS software PROC POWER).
statistical analysis
First, we described the study sample. Then, in order to estimate the association between esteem and self-rated health, we computed a logistic regression model. We modelled the probability of declaring good or very good self-rated health during the first follow-up. The primary explanatory variable was self-esteem. To allow relevant interpretation, we estimated associations for the increase of one SD (ie, 5.696). All the potential confounders described above were entered in the model as covariates. In the modelling process, we first estimated univariate models. Log-linearity of the effect of self-esteem (contin-uous variable) was checked. We tested interactions for gender, age and cities among self-rated health and self-es-teem links by univariate models and performed stratified analysis if the interaction was significant (p<0.05). Then we selected variables if p value <0.25 to compute multivar-iate models. Finally, we performed a stepwise backward selection for a final multivariate model with a threshold of p value=0.05. At every step, we checked the confusion effect and computed the OR, 95% CI and p value (p) of the corresponding Wald test.
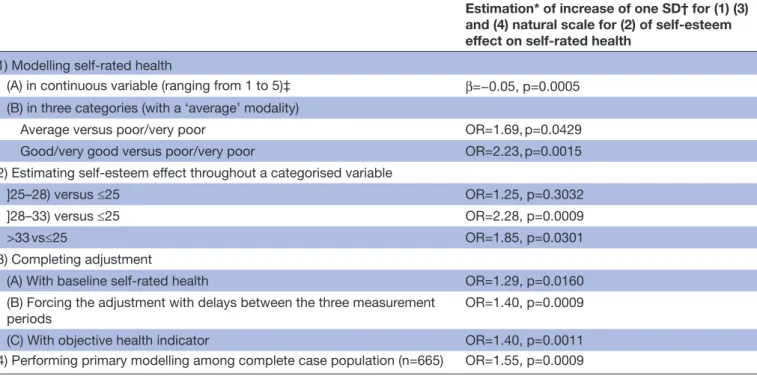
Finally, we conducted sensitivity analyses to test the robustness of the findings: (1) modelling self-rated health: (A) in continuous variable (ranging from 1 to 5) and (B) in three categories (with an ‘average’ modality); (2) esti-mating the self-esteem effect through a categorised vari-able (corresponding to quartiles: ≤25, ]25–28], ]28–33] and >33) to bring to light a potential dose–response effect; (3) completing the adjustment: (A) with baseline
self-rated health; (B) forcing the adjustment with delays between the three measurement periods; and (C) with objective health indicators; and (4) performing primary modelling among the complete case population.
Our missing data analysis procedures used missing at random assumptions. We used the multivariate impu-tation by chained equations method of multiple multi-variate imputation in SAS software (PROC MI and MIANALYZE).35 36 We independently analysed 10 copies
of the data, each with suitably imputed missing values, in the multivariate logistic regression analyses. We averaged estimates of the variables to give a single mean estimate and adjusted standard errors according to Rubin’s rules. We imputed only data from covariates using self-esteem, self-rated health, covariate data and completed the impu-tation process with other data collected in the i-Share cohort (alcohol consumption, walking time per day, sport practice time, stress score, anxiety score, depression score and self-rated quality of sleep).
We performed all analyses using the SAS statistical soft-ware (SAS V.9.3).
results
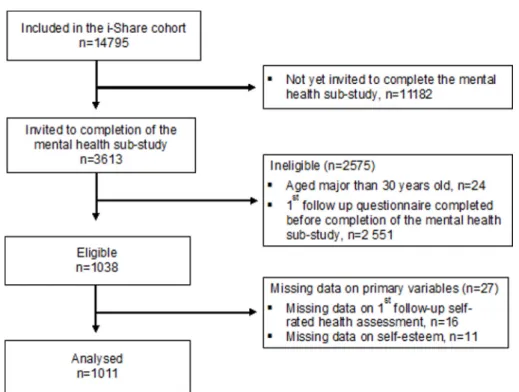
The total sample comprised 1011 participants. Figure 1 shows the flow chart of the study population. Of the 14 795 college students enrolled in the i-Share cohort, 3613 completed the mental health substudy, 1038 were eligible for this study and 1011 were ultimately analysed. Prospective self-rated health assessment (ie, during the first follow-up, time 3) was a median of 13.2 months after enrolment in the cohort and a median of 8.4 months after completion of the mental health substudy (ie, self-esteem
Figure 1 Flow diagram showing participant flow through the study based on the i-Share cohort, France, 2013–2016.
Superieur (ABES). Protected by copyright.
on January 15, 2021 at Agence Bibliographique de l Enseignement
measure, time 2). The baseline characteristics of the study population are presented in table 1. The mean age of participants was 20.8 (SD=2.3) years, 795/1011
Table 1 Characteristics of the study population concerning self-rated health, self-esteem, demographic, educational, financial, social, geographical, follow-up, behavioural and psychological data at time 1: cohort enrolment; time 2: optional mental health survey; time 3: cohort follow-up in the i-Share cohort, France, 2013–2016
Characteristics Participants n=1011 Outcome at time 3 SRH five items, n (%) Very good 225 (22.3) Good 583 (57.7) Average 177 (17.5) Poor 26 (2.6) Very poor 0 (–) SRH dichotomised, n (%)
Very good to good 808 (79.9) Average to very poor 203 (20.1) SRH in continuous*, median (IQR) 2.0 (2.0–2.0) Main exposure at time 2
Self-esteem in continuous variable,
median (IQR) 28 (25–33)
Self-esteem in categorical variable, n (%)
≤25 287 (28.4)
]25–28] 219 (21.7)
]28–33] 277 (27.4)
≥33 228 (22.6)
Demographic data
Age at time 3, mean (STD) 20.8 (2.3)
Female, n (%) 795 (78.6)
Educational data at time 1 University year, n (%)
Freshman 367 (36.5)
Sophomore 218 (21.7)
Junior 154 (15.3)
Senior 267 (26.5)
At least one parent with high education level, n (%)
274 (28.5) Financial data at time 1
Comfortable to very comfortable financial
situation during childhood, n (%) 573 (56.7) Rather satisfied to very satisfied with
financial resources, n (%) 504 (49.8) Social data at time 1
Cohabitation, n (%)
With parents 278 (31.3)
Flatsharing or couple 287 (32.4) No cohabitation/alone 322 (36.3) Strong familial support during childhood,
n (%) 730 (72.9)
Geographical and follow-up data
City of the registration university at time 1, n (%) Continued Characteristics Participants n=1011 Bordeaux 686 (67.9) Versailles 77 (7.6) Nice 22 (2.2) Paris 45 (4.5) Other 181 (17.9)
Delay in months between inclusion and SRH assessment (follow-up), median (IQR)
13.2 (12.3–23.4)
Delay in months between mental health assessment and SRH assessment (follow-up), median (IQR)
8.4 (3.2-12.0)
Behavioural data at time 1 Tobacco consumption, n (%)
None 761 (75.3)
≤10 cigarettes 213 (21.1) >10 cigarettes 37 (3.6) Alcohol consumption frequency during
evening, n (%)
Never 22 (2.3)
Rarely 225 (23.2)
Occasionally 393 (40.5)
Frequently 330 (34.0)
Psychoactive substance consumption at
least once in life, n (%) 603 (59.6) BMI <25 kg/m² at time 1, n (%) 909 (89.9) Compliance with French nutritional
recommendations, median (IQR)
3 (3.4) Physical activity, n (%)
Less than 25 min/day 109 (10.9) Between 25 and 35 min/day 183 (18.3) More than 35 min/day 706 (70.7) Psychological data at time 2, median (IQR)
Coping – social support 11 (8–14) Coping – emotional 20 (17–22) Coping – festive-addictive 11 (9–14)
Impulsivity 61 (56–67)
Aggressiveness 1 (0–3)
Personality – novelty seeking 21 (18–23) Personality – persistence 28 (24–31) Personality – harm avoidance 27 (22–31) Personality – determination 27 (23–31) Personality – reward dependence 28 (23–32) Personality – cooperativeness 32 (29–35) n=1011.
*1=very good, 2=good, 3=average, 4=poor and 5=very poor. BMI, body mass index; SRH, self-rated health.
Table 1 Continued
Superieur (ABES). Protected by copyright.
on January 15, 2021 at Agence Bibliographique de l Enseignement
(79%) were female, 367/1011 (37%) were freshmen and most students were in Bordeaux (686/1011, 68%). 346/1011 (34%) participants had at least one missing data item among covariates. BMI and living situation were the most frequently missing variables (15% and 12%, respectively) and other missing variables accounted for less than 5% of missing data. At inclusion, 18% of the students declared average or poor health (183/1011). At first follow-up, 20% of the students declared average or poor health (203/1011). Online supplementary table S1 in the supplementary material compares participants in the i-Share cohort versus the study sample.
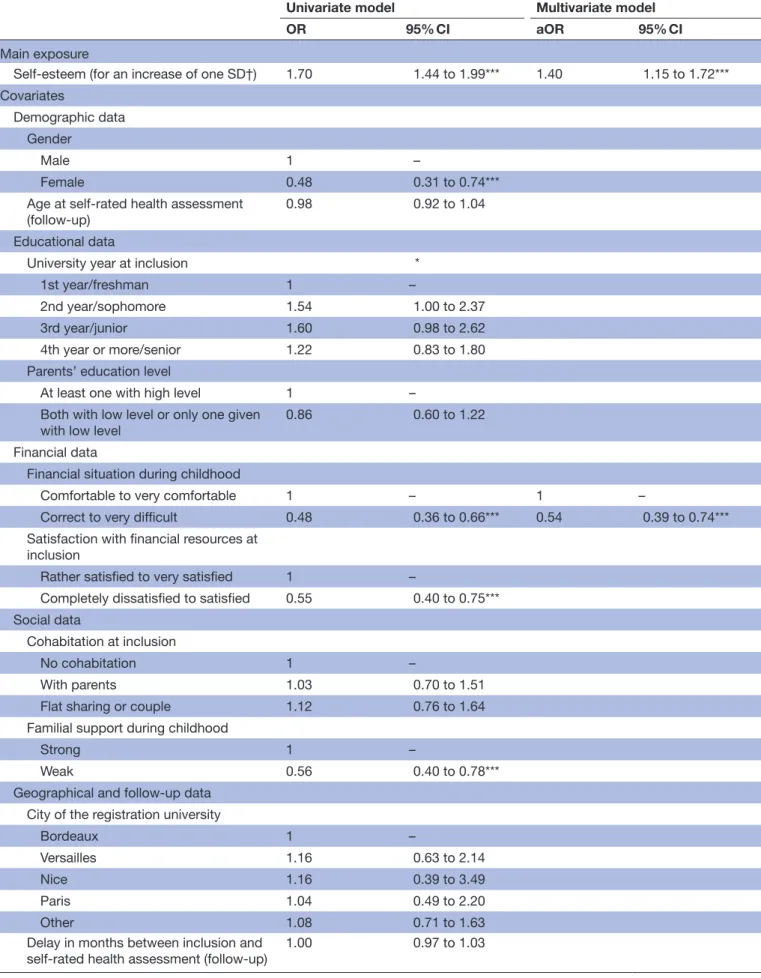
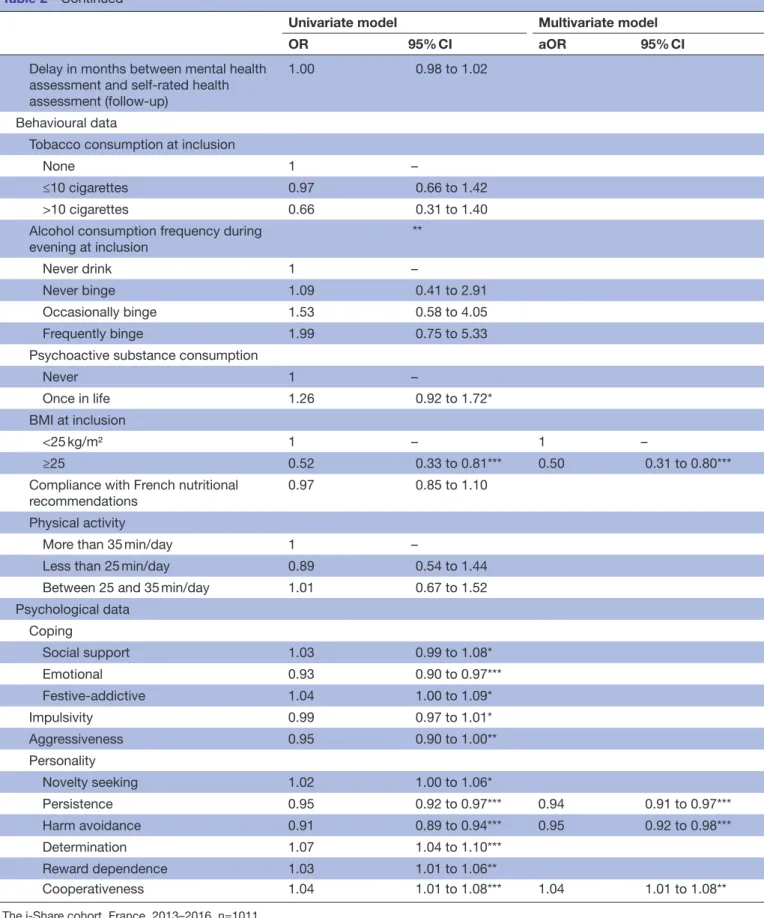
Table 2 presents the whole modelling process after imputation of missing data and table 3 presents the final model with crude and adjusted ORs. The unadjusted esteem effect (for the increase of one SD) on self-rated health was statistically significant (OR=1.70, 95% CI 1.44 to 1.99, p<0.0001). Log-linearity of the self-esteem effect was confirmed, allowing a valid estimation. None of the predefined interactions (gender, cities and age) were statistically significant (all p values >0.10). The final multivariate model was adjusted for BMI, financial situation during childhood and three personality traits (persistence, harm avoidance and cooperativeness). With this final model, the increase of one SD in self-esteem was associated with a 40% increase in the probability of declaring good or very good health versus average to very poor health (adjusted OR=1.40, 95% CI 1.15 to 1.72, p=0.001).
BMI >25 kg/m² and difficult financial situation during childhood decreased the probability of declaring good to very good health by 2. Three personality traits were asso-ciated with self-rated health: low persistence and harm avoidance and high cooperativeness were associated with declaring good to very good health. The restraint model showed acceptable discrimination power (area under curve=0.7205), and the Hosmer-Lemeshow test proved model suitability to data (p value=0.8614).
Table 4 presents sensitivity analysis results showing the robustness of findings. Whatever the modelling choices for self-rated health and self-esteem or adjusting strate-gies, higher self-esteem was persistently associated with better self-rated health. Furthermore, the model with self-esteem in four categories showed a dose–response effect with graduate adjusted OR and a significant global test (p<0.04).
DIsCussIOn
Findings of the study
In this large longitudinal study among college students, higher self-esteem levels were independently associated with better self-rated health, even after complete adjust-ment for known confounders. This association was not modified by gender or age. Additional risk factors such as BMI, financial situation during childhood and person-ality traits (persistence, harm avoidance and cooper-ativeness) were associated with self-rated health. This
original finding opens up an opportunity for interven-tional research targeting psychosocial resources, espe-cially self-esteem, in the university setting.
Interpretation
The association between higher levels of self-esteem and better self-rated health found in the current study corrob-orates previous research. This finding based on a sample of college students supports and extends previous studies on other population samples by showing the same pattern of association between self-esteem and self-rated health.14
Several research works and literature reviews formulate hypotheses on the potential underlying mechanisms that may explain the relationship between self-esteem and health. Good self-esteem may enable individuals to make better choices, including adopting healthy behaviours.16
High self-esteem may increase the ability to put in place appropriate strategies to cope with everyday situations, which in turn increases the capacity to feel well and more generally the capacity of resilience.37 An alternative
hypothesis is based on bodily sensations (ie, information that conveys messages from the organism to the brain). This information is available to the individual conscious-ness, is included in self-rating of health and may reflect important physiological dysregulation, such as inflamma-tory processes.38 In this hypothesis, self-esteem appears to
be a psychosocial ability that allows individuals to cope better with stress and prevents or diminishes these dele-terious inflammatory processes. Throughout the litera-ture, several determinants of self-rated health have been found.11 Our study was consistent with this in finding that
a low BMI, a comfortable financial situation during child-hood and three personality traits were associated with good self-rated health. In contrast to the literature, we did not find gender differences for self-rated health after complete adjustment.39–41 This discordant result could be
due to differences in sampling and adjustment strategies. In particular, fewer males than women participated in the i-Share cohort. Moreover, we found that self-rated health was influenced more by the family’s financial difficulties during childhood than during college years.
strengths and limitations
The strengths of our study include the longitudinal design, standardised assessment tools and broad adjust-ment for confounders. In addition, this study investigates self-rated health among college students, a population that has received less attention in the literature. Although the study sample included only a fraction of the original i-Share cohort, the number of participants was still rela-tively high compared with the available studies in the area. A set of limitations should be taken into consider-ation, however, to interpret the findings properly. First, a sampling bias could have arisen since participants were mainly healthy female students. Since young females usually have lower self-reported health than males, caution should be taken regarding extrapolation of the results to males.42 Further research is needed with a larger
Superieur (ABES). Protected by copyright.
on January 15, 2021 at Agence Bibliographique de l Enseignement
Table 2 Univariate and multivariate logistic model of probability to declare good or very good compared with very poor, poor or average self-rated health after imputation of missing data on covariates
Univariate model Multivariate model
OR 95% CI aOR 95% CI
Main exposure
Self-esteem (for an increase of one SD†) 1.70 1.44 to 1.99*** 1.40 1.15 to 1.72***
Covariates
Demographic data Gender
Male 1 –
Female 0.48 0.31 to 0.74***
Age at self-rated health assessment
(follow-up) 0.98 0.92 to 1.04
Educational data
University year at inclusion *
1st year/freshman 1 –
2nd year/sophomore 1.54 1.00 to 2.37
3rd year/junior 1.60 0.98 to 2.62
4th year or more/senior 1.22 0.83 to 1.80
Parents’ education level
At least one with high level 1 –
Both with low level or only one given
with low level 0.86 0.60 to 1.22
Financial data
Financial situation during childhood
Comfortable to very comfortable 1 – 1 –
Correct to very difficult 0.48 0.36 to 0.66*** 0.54 0.39 to 0.74***
Satisfaction with financial resources at inclusion
Rather satisfied to very satisfied 1 –
Completely dissatisfied to satisfied 0.55 0.40 to 0.75*** Social data
Cohabitation at inclusion
No cohabitation 1 –
With parents 1.03 0.70 to 1.51
Flat sharing or couple 1.12 0.76 to 1.64
Familial support during childhood
Strong 1 –
Weak 0.56 0.40 to 0.78***
Geographical and follow-up data City of the registration university
Bordeaux 1 –
Versailles 1.16 0.63 to 2.14
Nice 1.16 0.39 to 3.49
Paris 1.04 0.49 to 2.20
Other 1.08 0.71 to 1.63
Delay in months between inclusion and
self-rated health assessment (follow-up) 1.00 0.97 to 1.03
Continued
Superieur (ABES). Protected by copyright.
on January 15, 2021 at Agence Bibliographique de l Enseignement
Univariate model Multivariate model
OR 95% CI aOR 95% CI
Delay in months between mental health assessment and self-rated health assessment (follow-up)
1.00 0.98 to 1.02
Behavioural data
Tobacco consumption at inclusion
None 1 –
≤10 cigarettes 0.97 0.66 to 1.42
>10 cigarettes 0.66 0.31 to 1.40
Alcohol consumption frequency during
evening at inclusion **
Never drink 1 –
Never binge 1.09 0.41 to 2.91
Occasionally binge 1.53 0.58 to 4.05
Frequently binge 1.99 0.75 to 5.33
Psychoactive substance consumption
Never 1 –
Once in life 1.26 0.92 to 1.72*
BMI at inclusion
<25 kg/m² 1 – 1 –
≥25 0.52 0.33 to 0.81*** 0.50 0.31 to 0.80***
Compliance with French nutritional
recommendations 0.97 0.85 to 1.10
Physical activity
More than 35 min/day 1 –
Less than 25 min/day 0.89 0.54 to 1.44
Between 25 and 35 min/day 1.01 0.67 to 1.52
Psychological data Coping Social support 1.03 0.99 to 1.08* Emotional 0.93 0.90 to 0.97*** Festive-addictive 1.04 1.00 to 1.09* Impulsivity 0.99 0.97 to 1.01* Aggressiveness 0.95 0.90 to 1.00** Personality Novelty seeking 1.02 1.00 to 1.06* Persistence 0.95 0.92 to 0.97*** 0.94 0.91 to 0.97*** Harm avoidance 0.91 0.89 to 0.94*** 0.95 0.92 to 0.98*** Determination 1.07 1.04 to 1.10***
Reward dependence 1.03 1.01 to 1.06**
Cooperativeness 1.04 1.01 to 1.08*** 1.04 1.01 to 1.08**
The i-Share cohort, France, 2013–2016. n=1011. *P value <0.25; **p value <0.05; ***p value <0.01. †Self-esteem SD: 5.696.
‡Self-rated health description provided before data imputation. BMI, body mass index.
Table 2 Continued
Superieur (ABES). Protected by copyright.
on January 15, 2021 at Agence Bibliographique de l Enseignement
Table 3 Final logistic model of probability to declare good or very good compared with very poor, poor or average self-rated health after imputation of missing data on covariates
Self-rated health* Multivariate model Good/very good,
n=808 Average/poor, n=203 aOR 95% CI
Self-esteem (for the increase of one
SD†), median (IQR) 29 (26–33) 26 (22–30) 1.40 1.15 to 1.72***
BMI at inclusion, n(%)
<25 kg/m² 623 (89.6) 130 (81.3) 2.11 1.26 to 3.53***
≥25 72 (10.4) 30 (18.8) 1 –
Financial situation during childhood, n(%)
Comfortable to very comfortable 487 (60.3) 86 (42.4) 1.87 1.35 to 2.59***
Correct to very difficult 321 (39.7) 117 (57.6) 1 –
Personality, median (IQR)
Persistence 29 (24–31) 29 (25–33) 0.94 0.91 to 0.97***
Harm avoidance 26 (22–30) 29 (25–33) 0.95 0.92 to 0.98***
Cooperativeness 32 (29–35) 32 (28–35) 1.04 1.01 to 1.08**
The i-Share Cohort, France, 2013–2016. n=1011 . *P value <0.25; **p value <0.05; ***p value <0.01.
*Self-rated health description provided before data-imputation. †Self-esteem SD: 5.696.
aOR, adjusted OR; BMI, body mass index.
Table 4 Sensitivity analysis of the effect of self-esteem on self-rated health
Estimation* of increase of one SD† for (1) (3) and (4) natural scale for (2) of self-esteem effect on self-rated health
(1) Modelling self-rated health
(A) in continuous variable (ranging from 1 to 5)‡ β=−0.05, p=0.0005
(B) in three categories (with a ‘average’ modality)
Average versus poor/very poor OR=1.69, p=0.0429
Good/very good versus poor/very poor OR=2.23, p=0.0015
(2) Estimating self-esteem effect throughout a categorised variable
]25–28) versus ≤25 OR=1.25, p=0.3032
]28–33) versus ≤25 OR=2.28, p=0.0009
>33 vs≤25 OR=1.85, p=0.0301
(3) Completing adjustment
(A) With baseline self-rated health OR=1.29, p=0.0160
(B) Forcing the adjustment with delays between the three measurement
periods OR=1.40, p=0.0009
(C) With objective health indicator OR=1.40, p=0.0011
(4) Performing primary modelling among complete case population (n=665) OR=1.55, p=0.0009
The i-Share Cohort, France, 2013–2016. n=1011.
*Models adjusted for body mass index, financial situation during childhood and personality scores (persistence, harm avoidance and cooperativeness).
†Self-esteem SD: 5.696.
‡High score represent better self-rated health.
Superieur (ABES). Protected by copyright.
on January 15, 2021 at Agence Bibliographique de l Enseignement
and more varied sample. Second, we used a longitudinal design with a median follow-up period of 8 months, which is relevant to assess impact on self-rated health in young adults. We do not have any information on the persistency of the self-esteem/self-rated health relationship in the longer term, however, especially after the academic years. Moreover, reverse causation between self-esteem and self-rated health may exist and could not be investigated with our design. However, in sensitivity analyses, when self-rated health measurement prior to self-esteem was entered in the model as a covariate, the result remained similar. Further research should use repeated self-esteem and self-rated health measurements to better explore the bidirectionality assumption.
Implications
From a public health perspective, this study provides a contributive insight for interventional research. It suggests that interventions targeting self-esteem during college years should be experimented. Yet the type of intervention is still to be determined, since most of the previous interventional research on self-esteem has concerned children.43 44 Consequently, further studies
are needed to investigate whether these interventions could be extended or transferred to college students. Self-esteem improvement interventions could focus either on (1) global self-esteem by increasing self-knowl-edge and resilience through an individual intervention, web-based for instance, or (2) a specific dimension such as social self-esteem by using exercise or mento-ring programme.43 44 Furthermore, the university years
represent a relevant period for implementing early inter-ventions, before health behaviours and mental health problems set in.
From a research perspective, we have identified two priority areas. First, it appears necessary to better under-stand the pathways between self-esteem and self-rated health by conducting mediational analyses. Second, the self-reported nature of the two measurements (ie, self-es-teem and self-rated health) might explain why they are linked.38 Considering that self-esteem has been reported
to be linked with health outcomes other than self-rated health, we believe that there are coexisting associations with both the evaluation framework and health.
Acknowledgements The authors are indebted to the participants of the i-Share project for their commitment and cooperation and to the entire i-Share staff for their expert contribution and assistance.
Contributors JA and CG developed the study concept and study design. CT is the principal investigator of the i-Share Cohort. MT and GM participated actively in the creation of the mental health questionnaire and brought psychological and psychiatric expertise to the interpretation of the results. JA performed the data analysis and interpretation under the supervision of CG. JA drafted the manuscript and all the coauthors provided critical revisions. All the authors approved the final version of the manuscript for submission.
Funding The i-Share research project has received funding from the French National Research Agency (Agence Nationale de la Recherche (ANR)) via the ‘Investissements d’Avenir’ programme reference ANR-10- COHO-05. This study was further supported by a grant from the ‘Health Determinants in Societies’ HEADS Excellence Cluster of the University of Bordeaux, managed by the ANR, under the
‘Future Investments’ programme in the framework of the Bordeaux ‘Initiatives d’Excellence’ (IdEx) programme, grant number (ANR-10-IDEX-03-02).
Competing interests None declared.
Patient consent for publication Not required.
Provenance and peer review Not commissioned; externally peer reviewed.
Data sharing statement Data from the study are not available because they are still under analysis for other research questions.
Open access This is an open access article distributed in accordance with the Creative Commons Attribution Non Commercial (CC BY-NC 4.0) license, which permits others to distribute, remix, adapt, build upon this work non-commercially, and license their derivative works on different terms, provided the original work is properly cited, appropriate credit is given, any changes made indicated, and the use is non-commercial. See: http:// creativecommons. org/ licenses/ by- nc/ 4. 0/.
reFerenCes
1. Nielsen TH. The relationship between self-rated health and hospital records. Health Econ 2016;25:497–512.
2. Sajjad A, Freak-Poli RL, Hofman A, et al. Subjective measures of health and all-cause mortality - the Rotterdam Study. Psychol Med 2017;47:1971–80.
3. Breidablik HJ, Meland E, Lydersen S. Self-rated health in adolescence: a multifactorial composite. Scand J Public Health 2008;36:12–20.
4. Breidablik H-J, Meland E, Lydersen S. Self-rated health during adolescence: stability and predictors of change (Young-HUNT study, Norway). Eur J Public Health 2009;19:73–8.
5. Idler EL, Benyamini Y. Self-rated health and mortality: a review of twenty-seven community studies. J Health Soc Behav 1997;38:21–37.
6. Ware J. The assessment of health status. In: Applications of social
science to clinical medicine and health policy. New Brunswick, NJ:
Rutgers University Press:204–28.
7. de Bruin A. Health Interview Surveys: Towards International
Harmonization of Methods and Instruments. WHO Regional Publications, European Series, No. 58 [Internet: Office of
Publications, WHO Regional Office for Europe, Scherfigsvej 8, DK-2100 Copenhagen 0, Denmark (39 Swiss francs), 1996. https:// eric. ed. gov/? id= ED394961 9. R.
8. Robine JM, Jagger C. Euro-REVES Group. Creating a coherent set of indicators to monitor health across Europe: the Euro-REVES 2 project. Eur J Public Health 2003;13(3 Suppl):6–14.
9. DeSalvo KB, Bloser N, Reynolds K, et al. Mortality prediction with a single general self-rated health question. A meta-analysis. J Gen Intern Med 2006;21:267–75.
10. Mossey JM, Shapiro E. Self-rated health: a predictor of mortality among the elderly. Am J Public Health 1982;72:800–8.
11. Mantzavinis GD, Pappas N, Dimoliatis IDK, et al. Multivariate models of self-reported health often neglected essential candidate determinants and methodological issues. J Clin Epidemiol 2005;58:436–43.
12. Bobak M, Pikhart H, Rose R, et al. Socioeconomic factors, material inequalities, and perceived control in self-rated health: cross-sectional data from seven post-communist countries. Soc Sci Med 2000;51:1343–50.
13. Mackenbach JP, Simon JG, Looman CWN, et al. Self-assessed health and mortality: could psychosocial factors explain the association? Int J Epidemiol 2002;31:1162–8.
14. Shields M, Shooshtari S. Determinants of self-perceived health.
Health Rep. déc 2001;13:35–52.
15. Baumeister RF, Campbell JD, Krueger JI, et al. Does high self-esteem cause better performance, interpersonal success, happiness, or healthier lifestyles? Psychol Sci Public Interest 2003;4:1–44. 16. Mann M, Hosman CMH, Schaalma HP, de Vries NK. Self-esteem in a
broad-spectrum approach for mental health promotion. Health Educ Res 2004;19:357–72.
17. Degenhardt L, Coffey C, Carlin JB, et al. Outcomes of occasional cannabis use in adolescence: 10-year follow-up study in Victoria, Australia. Br J Psychiatry 2010;196:290–5.
18. Mota N, Álvarez-Gil R, Corral M, et al. Risky alcohol use and heavy episodic drinking among Spanish University students: a two-year follow-up. Gac Sanit 2010;24:372–7.
19. Van De Ven MOM, Greenwood PA, Engels RCME, et al. Patterns of adolescent smoking and later nicotine dependence in young adults: A 10-year prospective study. Public Health 2010;124:65–70.
Superieur (ABES). Protected by copyright.
on January 15, 2021 at Agence Bibliographique de l Enseignement
20. Montagni I, Guichard E, Kurth T. Association of screen time with self-perceived attention problems and hyperactivity levels in French students: a cross-sectional study. BMJ Open 2016;6:e009089.
21. Galéra C, Salla J, Montagni I, et al. Stress, attention deficit hyperactivity disorder (ADHD) symptoms and tobacco smoking: The i-Share study. Eur Psychiatry 2017;45:221–6.
22. Rosenberg M. Society and the Adolescent Self-Image, NJ: Princeton University Press [Internet]. 1965 [cité 29 avr 2019]. Disponible sur. https://www. docdroid. net/ Vt9xpBg/ society- and- the- adolescent- self- image- morris- rosenberg- 1965. pdf.
23. Blascovich J, Tomaka J. Measures of self-esteem. In: Measures of
personality and social psychological attitudes: measures of social psychological attitudes: Academic Press, 2013:115–23.
24. Chambon O, Cornillon-Jacoudon D, Germain M, et al. Bien-être subjectif et qualité de vie. Définitions, mesures et facteurs déterminants. Implications thérapeutiques. Inf Psychiatr 1992. 25. Hercberg S, Chat-Yung S, Chaulia M. The French National
Nutrition and Health Program: 2001-2006-2010. Int J Public Health 2008;53:68–77.
26. Boujut E, Bruchon-Schweitzer M, Dombrowski S. Coping among Students: Development and Validation of an Exploratory Measure. Psychology 2012;03:562–8.
27. Brown GL, Goodwin FK, Ballenger JC, et al. Aggression in humans correlates with cerebrospinal fluid amine metabolites. Psychiatry Res 1979;1:131–9.
28. Fossati A, Barratt ES, Acquarini E, et al. Psychometric properties of an adolescent version of the Barratt Impulsiveness Scale-11 for a sample of Italian high school students. Percept Mot Skills 2002;95:621–35.
29. Cloninger CR, Bayon C, Svrakic DM. Measurement of temperament and character in mood disorders: a model of fundamental states as personality types. J Affect Disord 1998;51:21–32.
30. Pelissolo A, Mallet L, Baleyte JM, et al. The Temperament and Character Inventory-Revised (TCI-R): psychometric characteristics of the French version. Acta Psychiatr Scand 2005;112:126–33.
31. Estingoy P, Fort E, Normand J-C, et al. Vulnérabilités psychiques chez les étudiants : à propos de deux enquêtes en santé mentale à l’université Lyon 1. Annales Médico-psychologiques, revue psychiatrique 2013;171:392–8.
32. Saleh D, Camart N, Romo L. Predictors of Stress in College Students. Front Psychol 2017;8.
33. von Bothmer MIK, Fridlund B. Self-rated health among university students in relation to sense of coherence and other personality traits. Scand J Caring Sci 2003;17:347–57.
34. de WC, Soffiani V, Virdis A, et al. Italian university students’ self-perceived health and satisfaction of life. Annali dell’Istituto Superiore
di Sanità. juin 2015;51:121–5.
35. Rubin DB, Schenker N. Multiple imputation in health-are databases: An overview and some applications. Stat Med 1991;10:585–98. 36. Schafer JL. Analysis of incomplete multivariate data: CRC Press,
1997:448.
37. Harter S. The construction of the self: a developmental perspective. New York, NY, US: Guilford Press, 1999.
38. Jylhä M. What is self-rated health and why does it predict mortality? Towards a unified conceptual model. Soc Sci Med 2009;69:307–16. 39. Schmidt M. Predictors of self-rated health and lifestyle behaviours in
Swedish university students. Glob J Health Sci 2012;4:1–14. 40. Cullati S, Rousseaux E, Gabadinho A, et al. Factors of change and
cumulative factors in self-rated health trajectories: A systematic review. Adv Life Course Res 2014;19:14–27.
41. El Ansari W, Stock C. Explaining the gender difference in self-rated health among university students in Egypt. Women Health 2016;56:731–44.
42. Kling KC, Hyde JS, Showers CJ, et al. Gender differences in self-esteem: a meta-analysis. Psychol Bull 1999;125:470–500. 43. King KA, Vidourek RA, Davis B, et al. Increasing self-esteem and
school connectedness through a multidimensional mentoring program. J Sch Health 2002;72:294–9.
44. Ekeland E, Heian F, Hagen KB, et al. Exercise to improve self-esteem in children and young people. Cochrane Database Syst Rev 2004;1:CD003683.
Superieur (ABES). Protected by copyright.
on January 15, 2021 at Agence Bibliographique de l Enseignement