Demonstration of reduced airport
congestion through pushback rate control
The MIT Faculty has made this article openly available. Please share how this access benefits you. Your story matters.
Citation Simaiakis, Ioannis et al. “Demonstration of Reduced Airport
Congestion through Pushback Rate Control.” Transportation Research Part A: Policy and Practice 66 (August 2014): 251–267 © 2014 Elsevier Ltd
As Published http://dx.doi.org/10.1016/j.tra.2014.05.014
Publisher Elsevier
Version Author's final manuscript
Citable link http://hdl.handle.net/1721.1/111157
Terms of Use Creative Commons Attribution-NonCommercial-NoDerivs License
Demonstration of Reduced Airport Congestion through
Pushback Rate Control
Ioannis Simaiakis, Harshad Khadilkar,
Hamsa Balakrishnan, T. G. Reynolds and R. J. Hansman Massachusetts Institute of Technology
Cambridge, MA 02139, USA.
Abstract
Airport surface congestion results in significant increases in taxi times, fuel burn and emissions at major airports. This paper describes the field tests of a congestion control strategy at Boston Logan International Airport. The approach determines a suggested rate to meter pushbacks from the gate, in order to prevent the airport surface from entering congested states and to reduce the time that flights spend with engines on while taxiing to the runway. The field trials demonstrated that significant benefits were achiev-able through such a strategy: during eight four-hour tests conducted during August and September 2010, fuel use was reduced by an estimated 12,250-14,500 kg (4,000-4,700 US gallons), while aircraft gate pushback times were increased by an average of only 4.4 minutes for the 247 flights that were held at the gate.
Keywords: Air transportation, Air Traffic Management, Airport surface operations control, Departure taxi-out processes
1. Introduction
Aircraft taxiing on the surface contribute significantly to the fuel burn and emissions at airports. The quantities of fuel burned, as well as different pollutants such as Carbon Dioxide, Hydrocarbons, Nitrogen Oxides, Sulfur Oxides and Particulate Matter, are proportional to the taxi times of aircraft, as well as other factors such as the thrust settings, number of engines that are powered, and pilot and airline decisions regarding engine shutdowns during delays.
Airport surface congestion at major airports in the United States is re-sponsible for increased taxi-out times, fuel burn and emissions (Simaiakis and Balakrishnan, 2010). Similar trends have been noted in Europe, where it is estimated that aircraft spend 10-30% of their flight time taxiing, and that a short/medium range A320 expends as much as 5-10% of its fuel on the ground (Cros and Frings, 2008). Domestic flights in the United States annually emit about 6 million metric tons of carbon dioxide (CO2) taxiing
out for takeoff; almost half of these emissions are at the 20 most congested airports in the country. Recent studies have also shown that low-thrust taxi emissions have significant impacts on the local air quality near major airports (Yu et al., 2004; Carslaw et al., 2006; Miracolo et al., 2011). The purpose of the Pushback Rate Control Demonstration at Boston Logan International Airport (BOS) was to show that a significant portion of these impacts could be reduced through measures to limit surface congestion.
1.1. Related work
While there has been a significant amount of prior research on the climate impacts of transportation, including aviation (Vespermann and Wald, 2011; Schwanen et al., 2011), there has been less focus on the impact of airport operations. Airport congestion management research has typically focused more on administrative policies such as congestion pricing and slot restric-tions, and less on congestion control strategies (Hamzawi, 1992; Madas and Zografos, 2008; Mehndiratta and Kiefer, 2003).
A simple airport congestion control strategy would be a state-dependent pushback policy aimed at reducing congestion on the ground. The N-control strategy is one such approach, and was first considered in the Departure Planner project (Feron et al., 1997); several variants of it have been studied since (Pujet et al., 1999; Carr, 2001; Burgain et al., 2009; Burgain, 2010). This policy is effectively a simple threshold heuristic: if the total number of departing aircraft on the ground exceeds a certain threshold, further push-backs are stopped until the number of aircraft on the ground drops below the threshold. By contrast, the Pushback Rate Control (PRC) strategy pre-sented in this paper does not stop pushbacks once the surface is in a con-gested state, instead it regulates the rate at which aircraft push back from their gates during high departure demand periods so that the airport does not reach undesirable, highly congested states. The main reason to adopt a rate control strategy over a threshold, or on-off, strategy is that of prac-tical feasibility: After conversations with air traffic controllers at Boston, it
became apparent that a recommended pushback rate valid over a period of time (such as 15 min) was much preferred to an on-off strategy, which would require more constant intervention.
There have been other recent surface traffic optimization efforts, such as the metering of departures at New York JFK airport by PASSUR Aerospace, Inc. (Nakahara et al., 2011), the field evaluation of the Collaborative De-parture Queue Management concept at Memphis (MEM) airport (Brinton et al., 2011), and the human-in-the-loop simulations of the Spot and Runway Departure Advisor (SARDA) concept which focused on Dallas Fort Worth (DFW) airport (Jung et al., 2011). In contrast to these approaches, the Pushback Rate Control strategy is an aggregate, centralized approach, fo-cused on metering pushbacks from the gates rather than from the spots (the boundaries between the ramp area and the taxiways), and on the Airport Traffic Control Tower (ATCT) rather than the airline operations centers. It regulates the rate at which aircraft pushback from the gates and maintains the current first-come-first-served pushback sequences, rather than rationing traffic volume or slots at the spots to airlines based on the scheduled de-mand. The Pushback Rate Control strategy was intended to be an easy-to-implement congestion management mechanism that requires few technologi-cal or procedural modifications.
This paper presents, for the first time, the design, field testing, and post-test evaluation of a surface congestion control strategy through both simulations, and the analysis of quantitative surface surveillance data and qualitative tower observations.
1.2. Motivation: Departure throughput analysis
The main motivation for our proposed approach to reduce taxi times is an observation on the behavior of the departure performance of airports. As more aircraft pushback from their gates onto the taxiway system, the take-off rate of the airport initially increases because more aircraft are available to depart. However, as this number, denoted by N , exceeds a threshold, the departure runway capacity becomes the limiting factor, and there is no additional increase in throughput. We denote this threshold by N∗. This be-havior can be further parameterized by the number of arrivals, reflecting the tradeoff between arrival and departure throughput, known as the capacity envelope (Gilbo, 1993). The dependence of the departure throughput on the number of aircraft taxiing out and the arrival rate is illustrated for a partic-ular runway configuration in Figure 1 using 2007 data from FAA’s Aviation
System Performance Metrics (ASPM) database. Beyond the threshold N∗, any additional aircraft that pushback simply increase their taxi-out times without any increase in the departure throughput (Simaiakis and Balakrish-nan, 2009). 0 2 4 6 8 10 12 14 16 18 20 22 24 26 28 0 1 2 3 4 5 6 7 8 9 10 11 12 13 14
Aircraft taxiing out
Departure throughput (aircraft /15 min)
14 Arrivals 7 Arrivals 0 Arrivals
Figure 1: Regression of the departure throughput as a function of the number of aircraft taxiing out, parameterized by the arrival rate for the 22L, 27 | 22L, 22R configuration, under Visual Meteorological Conditions (Simaiakis and Balakrishnan, 2011).
The value of N∗ depends on the airport, arrival demand, runway con-figuration, and meteorological conditions. During periods of high demand, the pushback rate control protocol regulates pushbacks from the gates so that the number of aircraft taxiing out stays close to a specified value, Nctrl,
where Nctrl > N∗, thereby ensuring that the airport is saturated and
main-tains runway utilization, but at the same time, the airport does not reach highly-congested states. While the choice of Nctrl must be large enough to
maintain runway utilization, too large a value will be overly conservative, and will result in a loss of benefits from the control strategy. We note that this problem has parallels in operations management problems such as in-ventory control, and in the design and operation of manufacturing systems. In particular, it is related to strategies that control the rate of production at manufacturing stages in order to maintain target inventory levels in different buffers (Gershwin, 1994, 1997; Lou et al., 1994).
2. Design of the pushback rate control protocol
The main design consideration in developing the pushback rate control protocol for BOS was to incorporate effective control techniques into cur-rent operational procedures with minimal controller workload and procedural modifications. After discussions with the BOS facility, it was decided that suggesting a rate of pushbacks (to the BOS Gate controller) for each 15-min period was an effective strategy that was amenable to current procedures.
The two most important parameters that need to be estimated in order to determine a robust control strategy are the N∗ threshold and the departure throughput of the airport for different values of N . These parameters can potentially vary depending on meteorological conditions, runway configura-tion and arrival demand (as seen in Figure 1), but also on the fleet mix and the data sources we use.
2.1. Runway configurations
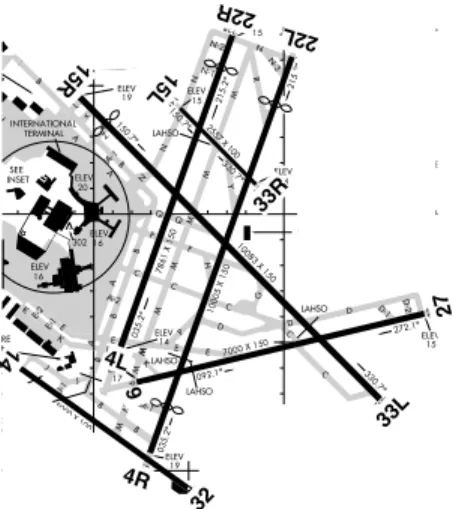
BOS mostly experiences Visual Meteorological Conditions or VMC (over 83% of the time in 2007). It has a complicated runway layout consisting of six runways, five of which intersect with at least one other runway, as shown in Figure 2. As a result, there are numerous possible runway configurations: in 2007, 61 different configurations were reported. The most frequently-used configurations under VMC are 22L, 27 | 22L, 22R; 4L, 4R | 4L, 4R, 9; and 27, 32 | 33L, where the notation ‘R1, R2 | R3, R4’ denotes arrivals on runways R1 and R2, and departures on R3 and R4. The above configurations accounted for about 70% of the time under VMC.
We note that, of these frequently-used configurations, 27, 32 | 33L in-volves taxiing out aircraft across active runways. Due to construction on taxiway November (marked ‘N’ in Figure 2) between runways 15L and 22R throughout the duration of the demo, departures headed to 22R used 15L to cross runway 22R onto taxiway Mike (marked ‘M’ in Figure 2). This resulted in active runway crossings in the 27, 22L | 22L, 22R configuration as well.
During our observations prior to the field tests as well as during the demo periods, we found that under Instrument Meteorological Conditions (IMC), arrivals into BOS are typically metered at the rate of 8 aircraft per 15 minutes by the terminal airspace controllers in the Terminal Radar Approach Control (TRACON). The slower arrival of flights into BOS results in a rather smaller departure demand in subsequent time periods, and there was rarely congestion under IMC at Boston during the evening departure push. For
GENERAL EDWARD LAWRENCE LOGAN INTL (BOS) BOSTON / 09351 BOSTON, MASSACHUSETTS 4R B ELEV15 ELEV 19 035.2^ FIELD ELEV 20 71^01’W 71^00’W 42^21’N AIRPORT DIAGRAM M ALL AIRCRAFT HOLD HERE. (4L-APCH) RWYS 4L-22R, 4R-22L, 9-27, 15R-33L, 15L-33R S200, D200, ST175, DT400, DDT800 RWY 14-32 S75, D200, ST175, DT400, DDT875 E-2 MAIN TERMINAL SATELLITE TERMINAL 09351 NORTH CARGO GENERAL AVIATION RAMP SEE INSET ELEV 16 AIRPORT DIAGRAM 14 ELEV 17 J PAD (PARKING) B K MAIN FIRE STATION 33L M-1 EMAS 158 X 170 INTERNATIONAL TERMINAL 27 9 D-2 D-1 D C 4L C E C M E K B A-2 A K E E-1 7000 X 150 10005 X 150 ELEV 15 272.1^ 330.7^ 092.1^ 035.2^ LAHSO LAHSO LAHSO B J J J-1 A B CONTROL TOWER PIER C TERMINAL B TERMINAL B US CUSTOMS 22R 22L N N-3 R Y 33R 15L N-2 N-1 N N 15R Q F H B A Z L A-1 F Q C B 10083 X 150 7861 X 150 ELEV 15 ELEV 14 ELEV 15 ELEV 14 215.2^ 215.2^ 150.7^ 330.7^ N 150.7^ 42^22’N CAUTION: BE ALERT TO RUNWAY CROSSING CLEARANCES. READBACK OF ALL RUNWAY HOLDING INSTRUCTIONS IS REQUIRED.
VAR 15.5^ W
JANUARY 2005 ANNUAL RATE OF CHANGE
0.1^ E ELEV 20 ELEV 16 A LAHSO EMAS 190 X 170 ELEV 19 302 x 2557 X 100 SATELLITE FIRE STATION M M M PIER B TERMINAL C TERMINAL E
BOSTON / GENERAL EDWARD LAWRENCE LOGAN INTL
AL-58 (FAA) BOSTON, MASSACHUSETTS
(BOS) 42^23’N ELEV 14 M M ELEV 17 P E K M M M D C D G INTERNATIONAL TERMINAL 5000 X 100 ATIS ARR 135.0 DEP 127.875 BOSTON TOWER 128.8 257.8 Helicopters 124.725 GND CON 121.9 CLNC DEL 121.65 257.8
ASDE-X Surveillance System in use. Pilots should operate transponders with Mode C on all twys and rwys.
32
NE-1, 14 JAN 2010 to 11 FEB 2010
NE-1, 14 JAN 2010 to 11 FEB 2010
15R 15L ! 4L! 33L ! 32! 22L! 22R ! 27 ! 33R ! 14 4R! 9!
Figure 2: BOS airport diagram showing alignment of runways, adapted from (Federal Aviation Administration, 2010a). The runways are shown in black, and the taxiways in grey.
this reason, we focus on configurations most frequently used during VMC operations for the control policy design.
2.2. Fleet mix
Qualitative observations at BOS suggest that the departure throughput is significantly affected by the number of propeller-powered aircraft (props) in the departure fleet mix. In order to determine the effect of props, we analyze the tradeoff between takeoff and landing rates at BOS, parameterized by the number of props during periods of high departure demand.
Figure 3 shows that under VMC, the number of props has a significant impact on the departure throughput, resulting in an increase at a rate of nearly one per 15 minutes for each additional prop departure. This obser-vation is consistent with procedures at BOS, since air traffic controllers fan out props in between jet departures, leveraging the smaller size and greater maneuverability of propellor-driven aircraft. As a result, the departure of a prop does not interfere very much with jet departures. The main implication of this observation for the control strategy design at BOS was that props could be exempt from both the pushback control as well as the counts of air-craft taxiing out (N ). Similar analysis also shows that departures of airair-craft in the heavy weight category at BOS do not have a significant impact on departure throughput, in spite of the increased wake-vortex separation that
0 1 2 3 4 5 6 7 8 9 10 11 12 13 14 0 1 2 3 4 5 6 7 8 9 10 11 12 13 14
Arrival throughput (aircraft/15 min)
Departure throughput (aircraft/15 min)
Average Fleet Mix Throughput 0 dep. props/15 min throughput 1 dep. prop/15 min throughput 2 dep. props/15 min throughput 3 dep. props/15 min throughput 4 dep. props/15 min throughput 5 dep. props/15 min throughput
Figure 3: Regression of the departure throughput (takeoff rate) as a function of the landing rate, parameterized by the number of props in a 15-minute interval for 22L, 27 | 22L, 22R configuration, under VMC at BOS (Simaiakis and Balakrishnan, 2011).
is required behind heavy weight category aircraft. This can be explained by the observation that air traffic controllers at BOS use the high wake vor-tex separation requirement between a heavy and a subsequent departure to conduct runway crossings, thereby mitigating the adverse impact of heavy weight category departures (Simaiakis and Balakrishnan, 2011).
Motivated by this finding, we can determine the dependence of the jet (i.e., non-prop) departure throughput as a function of the number of jet aircraft taxiing out, parameterized by the number of arrivals, as illustrated in Figure 4. This figure illustrates that during periods in which arrival demand is high, the jet departure throughput saturates when the number of jets taxiing out exceeds 17 (based on ASPM data).
2.3. Data sources
It is important to note that Figure 1, Figure 3 and Figure 4 are deter-mined using ASPM data. Pushback times in ASPM are deterdeter-mined from the brake release times reported through the ACARS system, and are prone to error because about 40% of the flights departing from BOS do not au-tomatically report these times (Simaiakis, 2009). Another potential source of pushback and takeoff times is the Airport Surface Detection Equipment - Model X (ASDE-X) system, which combines data from airport surface radars, multilateration sensors, ADS-B, and aircraft transponders (Federal Aviation Administration, 2010b). While the ASDE-X data is likely to be
0 2 4 6 8 10 12 14 16 18 20 22 24 0 1 2 3 4 5 6 7 8 9 10 11 12
Number of jet aircraft taxiing out
Departure throughput (jets/15 min)
data1
0 Arrivals 7 Arrivals 14 Arrivals
Figure 4: Regression of the jet departure throughput as a function of the number of departing jets on the ground, parameterized by the number of arrivals for 22L, 27 | 22L, 22R configuration, under VMC at BOS (Simaiakis and Balakrishnan, 2011).
more accurate than the ASPM data, it is still noisy, due to factors such as late transponder capture (the ASDE-X tracks only begin after the pilot has turned on the transponder, which may be before or after the actual push-back time), aborted takeoffs (which may have multiple departure times), flights cancelled after pushback, etc. A comparison of both ASDE-X and ASPM records with live observations made in the tower of BOS on August 26, 2010 revealed that the average difference in the number of pushbacks per 15-minutes as recorded by ASDE-X and visual means was 0.42, while it was -3.25 for ASPM and visual observations, showing that the ASPM records dif-fer considerably from ASDE-X and live observations. The above comparison motivates the recalibration of airport performance curves and parameters using ASDE-X data in addition to ASPM data. This is because ASPM data is not available in real-time and will therefore not be available for use in real-time deployments, and the ASDE-X data is in much closer agreement to the visual observations than ASPM.
We therefore conduct similar analysis to that shown in Figure 4, using ASDE-X data. The results are shown in Figure 5. We note that the qualita-tive behavior of the system is similar to that seen with ASPM data, namely, the jet throughput of the departure runway initially increases because more jet aircraft are available in the departure queue, but as this number exceeds a threshold, the departure runway capacity becomes the limiting factor, and
there is no additional increase in throughput. By statistically analyzing three months of ASDE-X data from BOS using the methodology outlined in (Sima-iakis and Balakrishnan, 2011; Sima(Sima-iakis et al., 2011), we determine that the average number of active jet departures on the ground at which the surface saturates is 12 jet aircraft for the 22L, 27 | 22L, 22R configuration, during periods of moderate arrival demand. This value is close to that deduced from Figure 5, using visual means.
0 1 2 3 4 5 6 7 8 9 10 11 12 13 14 15 16 17 18 19 0 1 2 3 4 5 6 7 8 9 10 11 12
Number of jets taxiing out
Departure throughput (jets/15 min)
14 Arrivals 7 Arrivals 0 Arrivals
Figure 5: Regression of the departure throughput as a function of the number of jets taxiing out, parameterized by the number of arrivals, using ASDE-X data, for the 22L, 27 | 22L, 22R configuration, under VMC at BOS.
2.4. Estimates of N∗ and the take-off rate
Table 1 shows the values of N∗, based on the ASDE-X data analysis of the three main runway configurations under VMC, that were used during the field tests (Simaiakis and Balakrishnan, 2011). For each runway configuration, we use plots similar to Figure 5 to determine the expected take-off rate given different conditions. For example, if the runway configuration is 22L, 27 | 22L, 22R, 11 jets are taxiing out, and the expected arrival rate is 12 aircraft in the next 15 minutes, the expected take-off rate is about 10 aircraft in the next 15 minutes.
3. Implementation of pushback rate control
The pushback rate was determined so as to keep the number of jets taxiing out near a suitable value (Nctrl), where Nctrl is greater than N∗, in order to
mitigate risks such as under-utilizing the runway, facing a large number of gate conflicts, or being unable to meet target departure times. Off-nominal events such as gate-use conflicts and target departure times were carefully monitored and addressed. Figure 6 shows a schematic of the decision process to determine the suggested pushback rate.
Config IMC/VMC Arrival demand Desired Nctrl Current N
Predicted number of departures in next time period
Recommended ground controller pushback rate in next time period
(influences next time period)
+ - Current N remaining on surface
throughout next time period
+ -
No. of departures on ground
D ep art ure ra te
Figure 6: A schematic of the pushback rate calculation.
The determination of the pushback rate is conducted as follows. Prior to the start of each 15-minute period, we:
1. Observe the operating configuration, VMC/IMC, and the predicted number of arrivals in the next 15 minutes (from the Enhanced Traf-fic Management System (ETMS) display) and using these as inputs into the appropriate takeoff curves (such as Figure 5), determine the expected number of jet takeoffs in the next 15 minutes.
2. Using visual observations, count the number of departing jets currently active on the surface. We counted a departure as active once the push-back tug was attached to the aircraft and it was in the process of pushing back.
Table 1: Values of N∗estimated from the analysis of ASDE-X data.
Configuration N∗
22L, 27 | 22L, 22R 12
27, 32 | 33L 12
3. Calculate the difference between the current number of active jet de-partures and the expected jet takeoffs. This difference is the number of currently active jets that are expected to remain on the ground through the next 15 minutes.
4. The difference between Nctrland the result of the previous step provides
us with the additional number of pushbacks to recommend in next 15 minutes. If the difference is zero or negative, a stop in the pushback process would be recommended.
5. Translate the suggested number of pushbacks in the next 15 minutes to an approximate pushback rate in a shorter time interval more appro-priate for operational implementation (for example, 10 aircraft in the next 15 minutes would translate to a rate of “2 per 3 minutes.”). The pushback rate was calculated manually, using a paper spreadsheet and visual inspection of the appropriate takeoff curves. Recent work has explored how the inputs may be automatically determined from surface surveillance data (Sandberg, 2012), as well as designed a prototype decision-support tool using Android tablet computers (Simaiakis et al., 2012).
3.1. Choice of update rate
As mentioned earlier, the suggested pushback rate is updated every 15 minutes, and is valid for the next 15 minute interval. This time-window was determined after conversations with the BOS tower, in order to satisfy sev-eral criteria. Since the control strategy tries to maintain runway throughput by controlling the rate at which aircraft pushback from the gates, the unim-peded taxi-out time (which approximately equals the travel time from the gates to the runway in the absence of any taxiway queuing) plays the role of a time delay between setting an arrival rate for the runway server and the time that the runway sees that rate. By choosing a time horizon that is close to the unimpeded taxi-out time, the flights released from the gate in a given time period will reach the departure queue in the next time period. The average unimpeded taxi-out time at BOS is 12.6 minutes under VMC (Sima-iakis and Balakrishnan, 2009), which makes 15 minutes a suitable choice of time-window. Another factor is the predictability of the arrival demand and departure throughput. Our analysis suggests that these predictions are rea-sonably good at the 15 minute prediction horizon, but that they deteriorate at longer time horizons. Finally, controller workload increases as the update rate increases.
The choice of suitable update rate clearly depends on the airport being considered. For BOS, for the reasons described above, we chose an update rate of once in 15 minutes.
3.2. Communication of recommended pushback rates and gate-hold times During the demo, we used color-coded cards to communicate suggested pushback rates to the air traffic controllers, thereby eliminating the need for verbal communications. We used one of eight 5 in × 7.5 in laminated cards, with pushback rate suggestions that ranged from “1 per 3 minutes” (5 in 15 minutes) to “1 aircraft per minute” (15 in 15 minutes), in addition to “Stop” (zero rate) and “No restriction” cards, as shown in Figure 7 (left). The setup of the suggested rate card in the Boston Gate controllers position is shown in Figure 7 (right).
Figure 7: (Left) Color-coded cards that were used to communicate the suggested pushback rates. (Right) Display of the color-coded card in the Boston Gate controller’s position.
The standard format of the gate-hold instruction communicated by the Boston Gate controller to the pilots included both the current time, the length of the gate-hold, and the time at which the pilot could expect to be cleared. For example:
Boston Gate: “AAL123, please hold push for 3 min. Time is now 2332, expect clearance at 2335. Remain on my frequency, I will contact you.”
In this manner, pilots were made aware of the expected gate-holds, and could inform the controller of constraints such as gate conflicts due to incom-ing aircraft. In addition, ground crews could be informed of the expected gate-hold time, so that they could be ready when push clearance was given.
The post-analysis of the tapes of controller-pilot communications showed that the controllers cleared aircraft for push at the times they had initially stated (i.e., an aircraft told to expect to push at 2335 would be cleared at 2335), and that they also accurately implemented the push rates suggested by the cards.
3.3. Handling of off-nominal events
The implementation plan also called for careful monitoring of off-nominal events and system constraints. Of particular concern were gate conflicts (for example, an arriving aircraft is assigned a gate at which a departure is being held), and the ability to meet controlled departure times (e.g. Expected Departure Clearance Times or EDCTs) and other constraints from Traffic Management Initiatives. After discussions with the Tower and airlines prior to the field tests, the following decisions were made:
1. Flights with controlled departure times would be handled as usual and released First-Come-First-Served. Long delays would continue to be absorbed in the standard holding areas. Flights with controlled de-parture times did not count toward the count of active jets when they pushed back; they counted toward the 15-minute interval in which their departure time fell. An analysis of EDCTs from flight strips showed that the ability to meet the EDCTs was not impacted during the field tests.
2. Pushbacks would be expedited to allow arrivals to use the gate if needed. Simulations conducted prior to the field tests predicted that gate-conflicts would be relatively infrequent at BOS; there were only two reported cases of potential gate-conflicts during the field tests, and in both cases, the departures were immediately released from the gate-hold, allowed to pushback and continued their hold in another approved location.
3.4. Determination of target times-of-the-day for the field trials
The pushback rate control protocol was tested in select evening departure push periods (4-8PM) at BOS between August 23 and September 24, 2010. Figure 8 shows the average number of departures on the ground in each 15-minute interval using ASPM data. There are two main departure pushes each day. The evening departure push differs from the morning one because of the larger arrival demand in the evenings. The morning departure push
presents different challenges, such as a large number of flights with controlled departure times, and a large number of tow-ins for the first flights of the day. Hence the evening push period was selected.
0 1 2 3 4 5 6 7 8 9 10 11 12 13 14 15 16 17 18 19 20 21 22 23 24 0 2 4 6 8 10 12 14 16 18 20 Local time
Avg. no. of aircraft on the ground
Figure 8: Variation of departure demand (average number of active departures on the ground) as a function of the time of day.
4. Results of field tests
Although the pushback rate control strategy was tested at BOS during 16 demo periods, there was very little need to control pushbacks when the airport operated in its most efficient configuration (4L, 4R | 4L, 4R, 9), and in only eight of the demo periods was there enough congestion for gate-holds to be experienced. There was insufficient congestion for recommending re-stricted pushback rates on August 23, September 16, 19, 23, and 24. In addition, on September 3 and 12, there were no gate-holds (although depar-ture demand was high, traffic did not build up, and no aircraft needed to be held at the gate). For the same reason, only one aircraft received a gate-hold of 2 min on September 17. The airport operated in the 4L, 4R | 4L, 4R, 9 configuration on all three of these days. In total, pushback rate control was in effect during the field tests for over 37 hours, with about 24 hours of test periods with significant gate-holds.
4.1. Data analysis examples
In this section, we examine three days with significant gate-holds (Au-gust 26, September 2 and 10) in order to describe the basic features of the pushback rate control strategy.
1730 1800 1830 1900 1930 2000 −20 −10 0 10 20 30 40 50
Local time at pushback (hrs)
Taxi time (minutes)
Taxi−out time Hold time CLT LGA, EDCT LGA, EDCT LGA, EDCT AMS, Intn’l LGA, EDCT
Figure 9: Taxi-out and gate-hold times from the field test on September 2, 2010.
4.1.1. Taxi-out times and gate-hold times
Figure 9 shows taxi-out times from one of the test periods, September 2. Each green bar in Figure 9 represents the actual taxi-out time of a flight (mea-sured using ASDE-X as the duration between the time when the transponder was turned on and the wheels-off time). The red bar represents the gate-hold time of the flight (shown as a negative number). In practice, there is a delay between the time the tug pushes an aircraft from its gate and the time that its transponder is turned on, but statistical analysis showed that this delay was random, similarly distributed for flights with and without gate-holds, and typically about 4 minutes. We note in Figure 9 that as flights start incurring gate-holds (corresponding to flights pushing back at around 1840 hours), there is a corresponding decrease in the active taxi-out times, i.e., the green lines. Visually, we notice that as the length of the gate-hold (red bar) increases, the length of the taxi-out time (green bar) proportionately decreases. There are still a few flights with large taxi-out times, but these typically correspond to flights with EDCTs. These delays were handled as in normal operations (i.e., their gate-hold times were not increased), as was agreed with the tower and airlines. Finally, there are also a few flights with no gate-holds and very short taxi-out times, typically corresponding to props. The impact of the pushback rate control strategy can be further visualized by using ASDE-X data, as can be seen in Figure 10, which shows snapshots of the airport surface at two instants of time, the first before the widespread gate-holds started, and the second during the gate-holds. We notice the sig-nificant decrease in taxiway congestion, in particular the long line of aircraft between the ramp area and the departure runway, due to the activation of
the pushback rate control strategy.
Figure 10: Snapshots of the airport surface, (left) before gate-holds started, and (right) during gate-holding. We note that the line of 15 departures between the ramp area and the departure runway prior to commencement of pushback rate control reduces to 8 departures with gate-holds. The white area on the taxiway near the top of the images indicates the closed portion of taxiway November.
Looking at another day of trials with a different runway configuration, Figure 11 shows taxi-out times from the test period of September 10. We note that as flights start incurring gate-holds, their taxi time stabilizes at around 20 minutes. This is especially evident during the primary departure push between 1830 and 1930 hours. The gate-hold times fluctuate from 1-2 minutes up to 9 minutes, but the taxi-times stabilize as the number of aircraft on the ground stabilizes to the specified Nctrl value. Finally, the flights that
pushback between 1930 and 2000 hours are at the end of the departure push and derive the most benefit from the pushback rate control strategy: they have longer gate holds, waiting for the queue to drain and then taxi to the runway facing a gradually diminishing queue.
4.1.2. Comparison of days with and without pushback rate control
Figure 12 (left) further illustrates the benefits of the pushback rate con-trol protocol, by comparing operations from a day with pushback rate concon-trol (shown in blue) and a day without it (shown in red), under similar demand and the same runway configuration. Both days were under VMC. The upper plot shows the average number of jets taxiing-out, and the lower plot the corresponding average taxi-out time, per 15-minute interval. We note that after 1815 hours on September 10, the number of jets taxiing out stabilized at around 15. As a result, the taxi-out times stabilized at about 16 minutes.
1800 1830 1900 1930 2000 0 10 20 30 40
Local time at pushback (hrs)
Taxi time (minutes)
SLC, EDCT ATL, EDCT LGA, EDCT ATL, EDCT CLT, EDCT
MAD, Int’l AMS, International
LGA, EDCT
LGA, EDCT
Figure 11: Taxi-out and gate-hold times from the field test on September 10, 2010.
Pushback rate control smooths the rate of the pushbacks so as to bring the airport state to the specified state, Nctrl, in a controlled manner. Both
fea-tures of pushback rate control, namely, smoothing of demand and prevention of congestion can be observed by comparing the evenings of September 10 and September 15. We see that on September 15, in the absence of pushback rate control, as traffic started accumulating at 1745 hours, the average taxi-out time grew to over 20 minutes. During the main departure push (1830 to 1930), the average number of jets taxiing out stayed close to 20 and the average taxi-out time was about 25 minutes.
Similarly, Figure 12 (right) compares the results of a characteristic push-back rate control day in runway configuration 27, 22L | 22L, 22R, August 26, to a similar day without pushback rate control. We observe that on Au-gust 26, the number of jets taxiing out during the departure push between 1830 and 1930 hours stabilized at 15 with an average taxi-out time of about 20 minutes. On August 17, when pushback rate control was not in effect, the number of aircraft reached 20 at the peak of the push and the average taxi-out times were higher than those of August 26.
Finally, we compare runway throughput (number of takeoffs/15 minutes) and departure queues (sampled every minute) for these sets of days in Fig-ure 13. Runway performance varies depending on downstream restrictions, fleet mix, arrival demand and human factors, independent of whether or not departure metering is in effect. During the periods with pushback rate con-trol, we see that a positive departure queue was maintained despite the high variation of the departure process (departure rates varied between 9 and 13 AC /15 minutes). We also note that the departure queue is generally more
16 17 18 19 20 0
10 20
30 Avg. taxi−out time (in min, per 15−min interval)
Taxi time (minutes)
Local time at start of taxi
16 17 18 19 20 0 4 8 12 16
20Avg. number of jets taxiing−out (per 15−min interval)
Local time
No. of jets taxiing out
Sep10 Sep15 Sep10 Sep15 16 17 18 19 20 0 10 20
30 Avg. taxi−out time (in min, per 15−min interval)
Taxi time (min)
Local time at start of taxi
Aug26 Aug17 16 17 18 19 20 0 4 8 12 16 20 Local time
No. of jets taxiing out
Avg. number of jets taxiing−out (per 15−min interval)
Aug26 Aug17
Figure 12: Surface congestion (top) and average taxi-out times (bottom) per 15-minutes, for (blue) a day with pushback rate control, and (red) a day with similar demand, same runway configuration and visual weather conditions, but without pushback rate control. The plots on the left correspond to September 10 and September 15, 2010, and the plots on the right correspond to August 26 and August 17, 2010. Delay attributed to EDCTs has been removed from the taxi-out time averages.
stable in the presence of pushback rate control than on non-metered days because of the smoother release of flights for pushback, especially during the major departure push between 1830 and 1930 hours.
4.2. Runway utilization
The overall objective of the field test was to maintain pressure on the departure runways, while limiting surface congestion. By maintaining run-way utilization, it is reasonable to expect that gate-hold times translate to taxi-out time reduction, as suggested by Figure 9. We therefore also care-fully analyze runway utilization during periods of pushback rate control, as illustrated in Figure 14.
In estimating the runway utilization, we determine (using ASDE-X data) what percentage of each 15-min interval corresponded to a departure on takeoff roll, to aircraft crossing the runway, arrivals (that requested landing on the departure runway) on final approach, departures holding for takeoff clearance, etc. We note that between 1745 and 2000 hours, when gate-holds were experienced, the runway utilization was kept at or close to 100%, with a persistent departure queue as well (as was seen in Figure 13 (left)).
16 17 18 19 20 0
5 10
Number of takeoffs (per 15−min interval)
Takeoffs Local time 16 17 18 19 20 0 2 4 6 8
10 Number of jets in queue (sampled every minute)
Local time Number of jets Sep10 Sep15 Sep10 Sep15 16 17 18 19 20 0 5 10
Number of takeoffs (per 15−min interval)
Takeoffs Local time Aug26 Aug17 16 17 18 19 20 0 2 4 6 8 10 Local time Number of jets
Number of jets in queue (sampled every minute)
Aug26 Aug17
Figure 13: Queue sizes sampled every minute (top) and departure throughput per 15-minutes (bottom), for (blue) a day with pushback rate control, and (red) a day with similar demand, same runway configuration and visual weather conditions, but without pushback rate control. The plots on the left correspond to September 10 and September 15, 2010, and the plots on the right correspond to August 26 and August 17, 2010.
4.2.1. Impact of drop in runway utilization
Runway utilization was maintained consistently during the demo periods, with the exception of a brief three-minute interval on the third day of push-back rate control. On this instance, three flights were expected to be at the departure runway, ready for takeoff. Two of these flights received EDCTs as they taxied (and so were not able to takeoff at the originally predicted time), and the third flight was an international departure that had longer than expected pre-taxi procedures.
To better understand the resultant departure runway performance, we vi-sualize the departure sequence around the time that the runway was starved. At Boston, departure operations on runways 22R and 22L take place as on a single runway, because both sets of departures use the same departure fixes. Runway 22R is used as the primary departure runway, with the occasional departure requesting 22L. Figure 15 (top) illustrates the departure sequence, along with the target inter-departure separations (Khadilkar et al., 2011). The local time is shown on the x−axis. Each spike denotes the wheels-off time for a departure, with the height of the spike corresponding to the air-craft type. The spike then tapers off, reaching the ‘release’ line when the target separation interval has elapsed. The bottom plot of Figure 15 shows the size of the queue at the departure runway threshold, as measured using ASDE-X data. We note that the queue sizes are noisy due to the inherent
16000 1700 1800 1900 2000 20 40 60 80 100 Local time (hrs) % Utilization Departures Arrivals Crossings Approach Hold
Figure 14: Runway utilization plot for the primary departure runway (33L) during the field test on September 10, 2010. These metrics are evaluated per 15-minute interval through the analysis of ASDE-X data.
noise in the data source.
In Figure 15, we note a brief, approximately two-minute long interval just past 19:30 when there is a gap in the runway use, accompanied by an absence of any flights in the departure queue. In fact, the low runway utilization begins around 19:29, when the large departure is able to takeoff as soon as it reaches the runway, thereby not encountering a departure queue at all. At 19:32, flights resume reaching the runway, and its utilization increases again. From Figure 15, we estimate that in the presence of a departure queue, there would most likely have been one additional departure in that time period. This hypothesis is further supported by the observation that the controller on duty was allowing aircraft to cross the runway during the gaps in the departures.
Learning from this experience, we were diligent in ensuring that EDCTs were gathered as soon as they were available, preferably while the aircraft were still at the gate. In addition, we incorporated the longer taxi-out times of international departures into our predictions. As a result of these mea-sures, we ensured that runway utilization was maintained over the remaining duration of the trial. It is worth noting that the runway was “starved” in this manner for only 3 minutes in over 37 hours of pushback rate control, demonstrating the ability of the approach to adapt to the uncertainties in the system.
19:17 19:19 19:21 19:23 19:25 19:27 19:29 19:31 19:33 19:35 19:37 19:39 Release Prop Small Large 757 Heavy Local time (hrs) 22R 22L 19:150 19:18 19:21 19:24 19:27 19:30 19:33 19:36 19:39 1 2 3 4 5 Local time (hrs) Queue size 22R threshold
Figure 15: (Top) Departure sequence and (Bottom) departure queue sizes between 19:15 and 19:40 on September 2, 2010, illustrating the drop in runway utilization.
5. Benefits analysis
Having field tested the pushback rate control protocol, the next step is to quantify the benefits of the approach. The main dimensions of the benefits that we address are the taxi-out time and fuel burn reductions. Intuitively, it is reasonable to use the gate-hold times as a surrogate for the taxi-out time reduction, as long as runway throughput is maintained. We test this hypothesis through a simulation of operations with and without metering. 5.1. Simulation set-up
The purpose of these simulations was to estimate the taxi-time savings and to investigate the fairness of the strategy in terms of the distribution of gateholds. In particular, we compare three different sets of outcomes:
1. Data from actual operations: This case corresponds to the system be-havior during the pushback rate control demo periods. The taxi-times and queuing times are measured using ASDE-X data.
2. Model predictions: This case corresponds to the simulated output of pushback rate control demo periods. In this simulation, flights are
cleared for pushback at the same times that they received pushback clearance (after being assigned gateholds) during the demo.
3. Hypothetical (no pushback rate control) simulation: Finally, the model is used to simulate what would have happened if pushback rate control was not in effect, that is, if flights had been cleared for pushback as soon as they called ready to push. In the simulations, the pushback clearance times for flights were set to be equal to the call-ready times, that is, all gate-hold times were set to zero.
The first step is to determine the unimpeded taxi-out times of flights using ASDE-X data, adopting a procedure similar to the one proposed by Simaiakis and Balakrishnan (2009). Given the pushback clearance time, the unimpeded taxi-out time is then used to propagate each flight to the runway, where it is matched to the next available departure slot for that time period, which determines the predicted wheels-off time. The difference between this wheels-off time and the pushback clearance time is the expected taxi-out time.
The use of fixed departure slots that are determined by the wheels-off times in the operational data reflects the fact that there are differences in runway performance across days due to factors not related to the pushback rate control strategy. Such fixed departure slots are a reasonable assumption as long as there is a nonzero queue at the departure threshold. Because of this assumption, the total and mean taxi-out times from the actual data and the model predictions are expected to be similar, since the pushback times and departure slots are the same for both cases. The additional comparison of the actual and predicted runway queue lengths would reflect the ability to predict the travel time from the ramp to the runway queue, and subsequently to compare the impact of the control strategy using the simulations. For the period on September 2, 2010 when there was a drop in runway utilization (Section 4.2.1), we add an additional departure slot at 19:31 in the simulation of the no-control case. This additional slot accounts for the fact that had the runway starvation (which was caused by the control strategy) been avoided, there might have been one more departure in that time period.
The results are summarized in Table 2 for the four days with the most gate-holds. The results pertain to flights that were released for pushback between 1630 and 2030 hours, that is, near and during the metering period. As can be seen in Table 2, the mean taxi-out time and the mean queue length (the number of aircraft ahead of a flight when it enters the departure runway
queue) are generally predicted well by the model.
The differences in the mean queue length between the actual operations and the model predictions can be explained by the difference in the definition of queue lengths. The ASDE-X data analysis uses a static queue box that covers the region of the airport where queues are typically formed, ending at the runway threshold. The ASDE-X analysis may capture a few flights that are in the physical queue box, but are either in the process of passing through it or are being kept in a nearby holding pad. This results in a slightly longer mean queue length in the actual observations, as seen on 8/26, 8/29, and 9/10 in Table 2. On 9/2, however, there was a period of time (between 1800 and 1845 hours) when due to various extraneous factors, the departure throughput was lower than predicted, averaging about 4 flights in 15 minutes. As a result, the departure queue length was longer than usual, and likely exceeded the queue box dimensions at times. As a result, the actual mean queue length on 9/2 (calculated from ASDE-X data) is less than the model predictions.
Table 2: Effect of gate-holding on mean taxi-out times and queue lengths.
Actual operations Model predictions
With PRC With PRC No PRC
# of Taxi-out Queue Gate-hold Taxi-out Queue Taxi-out Queue
Date flts. (min) length time (min) (min) length (min) length
8/26 151 18.5 4.8 257 18.5 4.9 20.2 5.9
8/29 135 17.8 4.1 114 17.8 3.8 18.6 4.3
9/2 146 19.3 4.7 375 19.3 5.3 21.3 6.4
9/10 138 17.0 4.3 210 17.0 3.4 18.5 4.8
We also quantify the impact of the runway starvation incident by simulat-ing what the benefit of the pushback rate control strategy would have been, had runway utilization been maintained. The results are shown in Table 3, which compares the actual average taxi-out time during the September 2 demo period with the loss of a departure slot, the predicted average taxi-out time during that time had there not been a loss of a slot, and the predicted average taxi-out time without the pushback rate control strategy. The table shows that the average taxi-out time on September 2 would have been 18.8 min, had the pushback control strategy been implemented correctly with no drop in runway utilization. Table 3 also shows that despite the 3-minute capacity loss, the average taxi-out time would have still been higher with-out the control strategy (21.3 minutes instead of 19.3 minutes). However,
because of the capacity loss, the full taxi-out time reduction potential of 2.5 min per flight was not achieved.
Table 3: Impact of runway starvation on average taxi-out time.
With PRC No PRC
No runway starvation With runway starvation No runway starvation
18.8 min 19.3 min 21.3 min
5.2. Translating gate-hold times to taxi-out time reductions
The simulations show that the taxi-out time savings are equal to the total gate holding time, as long as runway utilization is maintained. This observation can be made from Table 2, by comparing the total taxi-out time reduction (given by the product of the difference between the model predic-tions with, and without, pushback rate control, and the number of flights in the time-period) with the total gate-hold time. Table 4 presents a summary of the gate-holds and estimated taxi-time savings on the eight demo periods with sufficient congestion for controlling pushback rates. As mentioned ear-lier, we had no significant congestion when the airport was operating in its most efficient configuration (4L, 4R | 4L, 4R, 9). On September 2, due to the runway starvation, the taxi-out time reduction was only 292 minutes, while the total gate-hold time was 375 min.
Table 4: Summary of gate-hold times and taxi-time savings for the eight demo periods with significant gate-holds.
Date Period Configuration Number of Gate-holds (min) Taxi-out time
gate-holds Avg. Total savings (min)
8/26 4.45-8PM 27,22L | 22L,22R 63 4.06 257 257 8/29 4.45-8PM 27,32 | 33L 34 3.24 114 114 8/30 5-8PM 27,32 | 33L 8 4.75 38 38 9/02 4.45-8PM 27,22L | 22L,22R 45 8.33 375 295 9/06 5-8PM 27,22L | 22L,22R 19 2.21 42 42 9/07 5-7.45PM 27,22L | 22L,22R 11 2.09 23 23 9/09 5-8PM 27,32 | 33L 11 2.18 24 24 9/10 5-8PM 27,32 | 33L 56 3.8 210 210 Total 247 4.38 1083 1003
A total of 247 flights were held, with an average gate-hold of 4.4 min. During the most congested days of the demo, up to 44% of flights experienced
gate-holds. While maintaining runway utilization, we traded taxi-out time for time spent at the gate with engines off, as illustrated in Figures 9 and 11. For the day that runway utilization was lost, the actual taxi-out time savings were less than the total gate-holding time. Overall, the total taxi-out time reduction is estimated to be 1003 minutes (16.7 hours).
5.3. Fuel burn savings
We use the analysis presented in Section 5.2 to determine the reduction in fuel burn due to the pushback rate control strategy. Using the tail number of the gate-held flights, we determine the aircraft and engine type and hence its ICAO taxi fuel burn index (International Civil Aviation Organization, 2010b). The product of the fuel burn rate index, the number of engines, and the taxi-time reduction for a given flight gives us an estimate of the fuel burn savings for that flight from the pushback rate control strategy. Single-engine taxi procedures, in which aircraft taxi with some of their engines off, are more prevalent among arrivals than departures. A survey of pilots at BOS in 2009 found that a majority of them used single-engine taxiing for departures less that 10% of the time (Clewlow et al., 2010). Therefore, this analysis assumes that all aircraft taxi with all their engines on.
We can also account for the fuel use of Auxiliary Power Units (APUs) at the gate by using the appropriate fuel burn rates (Energy and Environmental Analysis, Inc., 1995). Since a flight may have used the APUs for only part of its gate-hold time and a Ground Power Unit (GPUs, which are not powered by jet fuel) for the remainder of it, there is a range of possible values for the fuel burn savings. The lower-bound corresponds to all the gate-hold time being APU-powered, and the upper bound corresponds to all gate-hold time being GPU-powered. This analysis (not accounting for benefits from reduced departure queue sizes) estimates that the jet fuel savings were between 11,940 and 14,190 kg.
In previous work, we have shown that the second-order fuel burn impact is proportional to the number of times that a taxiing aircraft accelerates (Khadilkar and Balakrishnan, 2011). We therefore analyzed ASDE-X trajec-tories from BOS to determine, for each configuration, the additional number of times that an aircraft accelerated for each additional aircraft ahead of it in the departure queue. Using these analyses, we compute the second-order fuel saving benefits from reduced departure queue sizes. The net estimate of the fuel savings from the pushback rate control demo is found to be 12,250-14,500 kg or 4,000-4,700 US gallons. Using the ICAO estimate of 3.16 kg
of carbon dioxide emissions per kg of jet fuel burn (International Civil Avi-ation OrganizAvi-ation, 2010a), the total CO2 emissions reduction is estimated
to be 38,700-45,800 kg. Similarly, since the average price of jet fuel in the US was $2.1/gallon (U.S. Department of Transportation, accessed October 2013), the total fuel cost savings from the demonstration were estimated to be $8,800-$10,400.
The above estimates translate to average fuel savings of 50-59 kg or 16-19 US gallons for each gate-held flight, which suggests that there are significant benefits to be gained from implementing control strategies during periods of congestion. It is worth noting that the per-flight benefits of the pushback rate control strategy are of the same order-of-magnitude as those of Continuous Descent Approaches in the presence of congestion (Cao et al., 2011), but do not require the same degree of automation, or modifications to arrival procedures.
5.4. Fairness of the pushback rate control strategy
Equity is an important factor in evaluating potential congestion man-agement or metering strategies. The pushback rate control approach, as implemented in these field tests, invoked a First-Come-First-Serve policy in clearing flights for pushback. As such, we would expect that there would be no bias toward any airline with regard to gate-holds incurred, and that the number of flights of a particular airline that were held would be commensu-rate with the contribution of that airline to the total departure traffic during demo periods. We confirm this hypothesis through a comparison of gate-hold share and total departure traffic share for different airlines, as shown in Figure 16. Each data-point in the figure corresponds to one airline, and we note that all the points lie close to the 45-degree line, thereby showing no bias toward any particular airline.
The simulations also show that the first-order benefits get allocated to the flights that are held at the gates, and do not spill over to other flights. Such an objective was part of the strategy design, and this verification is an important step for the actual implementation of the protocol. Airlines will be more positively inclined to participate in such a scheme if they are assured that they capture all the benefits from their contribution to reduced congestion.
We note, however, that while the number of gate-holds and the taxi-out time savings that an airline receives are proportional to the number of its flights, the actual fuel burn benefit depends on its fleet mix. Figure 17 shows
0% 5% 10% 15% 20% 25% 0% 5% 10% 15% 20% 25% Pe rc en ta g e o f g ate h el d fl ig h ts
Percentage of traffic during demo periods Percentage of Gateheld Flights
45 deg line 0% 5% 10% 15% 20% 25% 0% 5% 10% 15% 20% 25% Pe rc en ta g e
Percentage of traffic during demo periods Percentage taxi-out time savings
Percentage gate-hold time 45 deg line
Figure 16: Comparison of share of gate-hold times and taxi-out time savings in terms of the total departure traffic share for different airlines.
that while the gate-hold times and taxi-out time reductions are similar to the number of gate-holds, some airlines (for example, Airlines 3, 4, 5, 19 and 20) benefit from a greater proportion of fuel savings. These airlines are typically ones with several heavy jet departures during the evening push.
0% 2% 4% 6% 8% 10% 12% 14% 16% Ai rli ne 1 Ai rli ne 2 Ai rli ne 3 Ai rli ne 4 Ai rli ne 5 Ai rli ne 6 Ai rli ne 7 Ai rli ne 8 Ai rli ne 9 Ai rli ne 10 Ai rli ne 11 Ai rli ne 12 Ai rli ne 13 Ai rli ne 14 Ai rli ne 15 Ai rli ne 16 Ai rli ne 17 Ai rli ne 18 Ai rli ne 19 Ai rli ne 20 Ai rli ne 21 Ai rli ne 22 Ai rli ne 23 Ai rli ne 24 Ai rli ne 25 Ai rli ne 26
Percentage of Total Aircraft Held Percentage of Total Gate-hold Minutes Percentage of Taxi-out Time Savings Percentage of Fuel Burn Savings
Figure 17: Percentage of gate-held flights, taxi-out time reduction and fuel burn savings incurred by each airline.
6. Observations and lessons learned
We learned many important lessons from the field tests of the pushback rate control strategy at BOS, and also confirmed several hypotheses through the analysis of surveillance data and qualitative observations. Firstly, as one would expect, the proposed control approach is an aggregate one, and requires a minimum level of traffic to be effective. This hypothesis is further borne by the observation that there was very little control of pushback rates in the most efficient configuration (4L, 4R | 4L, 4R, 9). The field tests also showed that the proposed technique is capable of handling target departure times (e.g., EDCTs), but that it is preferable to get EDCTs while still at gate. While many factors drive airport throughput, the field tests showed that the pushback rate control approach could adapt to variability. In particular, the approach was robust to several perturbations to runway throughput, caused by heavy weight category landings on departure runway, controllers’ choice of runway crossing strategies, birds on runway, etc. We also observed that when presented with a suggested pushback rate, controllers had different strategies to implement the suggested rate. For example, for a suggested rate of 2 aircraft per 3 minutes, some controllers would release a flight every 1.5 minutes, while others would release two flights in quick succession every three minutes. We also noted the need to consider factors such as ground crew constraints, gate-use conflicts, and different pre-flight procedures for international flights. By accounting for these factors, the pushback rate control approach was shown to have significant benefits in terms of taxi-out times and fuel burn.
6.1. Potential for widespread implementation
The aggregate nature of the pushback rate control approach suggests that it will be effective only at airports with significant surface congestion. As has been shown for BOS in this paper, the algorithm will have to be tailored to specific configurations and operating conditions at any new airport be-ing considered. The airport layout, tower procedures, ground infrastructure (such as ramp areas, aprons and gates) and airline operations will also affect the algorithms (Sandberg et al., 2013).
6.2. Impact on airline performance metrics
The proposed Pushback Rate Control strategy does not change the takeoff time for a flight, but merely replaces a portion of the active taxi-out time with
a gate-hold. As a result, the wheels-off and wheels-on times of a flight are not impacted. However, the US Department of Transportation (DOT) defines the departure delays of flights as the difference between the actual and scheduled pushback times; a flight is considered to be delayed only if the departure delay exceeds 15 min. Crew compensation rates are also affected by pushback times. During the demo at BOS in 2010, the average gate-hold was 4.4 min, which was sufficiently lower than the 15 min threshold used by the US DOT. However, it is likely that at more congested airports, the gate-holds would be large enough to have a significant impact on the on-time performance. A broader policy discussion on meaningful system performance metrics will be needed before gate-hold strategies are implemented on a permanent basis. 7. Summary
This paper presented the results of the demonstration of a pushback rate control strategy at Boston Logan International Airport. Sixteen demonstra-tion periods between August 23 and September 24, 2010 were conducted in the initial field trial phase, resulting in over 37 hours of research time in the BOS tower. Results show that during eight demonstration periods (about 24 hours) of controlling pushback rates, over 1083 minutes (nearly 17 hours) of gate holds were experienced during the demonstration period across 247 flights, at an average of 4.4 minutes of gate hold per flight (which correlated well to the observed decreases in taxi-out time). Fuel burn savings from gate-holds with engines off were estimated to be between 12,250-14,500 kg (depending on whether APUs were on or off at the gate).
Acknowledgments
We would like to acknowledge the cooperation and support of the fol-lowing individuals who made the demo at BOS possible: Brendan Reilly, Deborah James, Pat Hennessy, John Ingaharro, John Melecio, Michael Nel-son and Chris Quigley at the BOS Facility; Vincent Cardillo, Flavio Leo and Robert Lynch at Massport; and George Ingram and other airline repre-sentatives at the ATA. Alex Nakahara provided assistance in computing the preliminary fuel burn savings from the gate-hold data, and Regina Clewlow, Alex Donaldson and Diana Michalek Pfeil helped with tower observations before and during the trials. We are also grateful to Steve Urlass (FAA), Lourdes Maurice (FAA), and Ian Waitz (MIT) for insightful feedback on the
research, and James Kuchar, Jim Eggert and Daniel Herring of MIT Lincoln Laboratory for their support and help with the ASDE-X data.
Appendix: Regressions of departure throughput
Figures 1, 4-5 represent the departure throughput as functions of the departure demand and the arrival throughput. The departure throughput, T (t), is measured as the number of aircraft that take off during the 15-min interval [t, t + 15), the arrival throughput, A(t), is defined to be the number of landings in the 15-min interval [t, t + 15), and the departure demand, N (t), is defined as the number of aircraft taxiing out at that time.
The following assumptions are made: (1) For a fixed departure demand, the departure throughput is assumed to be a monotonically non-increasing, concave function of the arrival throughput (de Neufville and Odoni, 2003); (2) the rate of increase of the departure throughput (as a function of departure demand) for any value of arrival throughput is assumed to be less than or equal to the rate for a lower value of arrival throughput; (3) for any value of departure demand, the departure throughput, as a function of arrival throughput, is assumed not to decrease at a lower rate than for a lower value of departure demand.
Given m triplets of measurements (N (t), A(t), T (t)), denoted (u1, v1, y1), . . . ,
(um, vm, ym), the function g : R2 → R estimates the mean value of T = g(N, A(t)).
Since both N (t) and A(t) take natural number values, only g(0, 0), g(0, 1), . . . , g(n, l), where n = max(N (t)) and l = max(A(t)), need to be estimated. Therefore, g is a piecewise linear function of A(t) and T (t), and is given by the solution to
min m X i=1 ( ˆyi− yi)2 (1) subject to: ˆ yi= g(ui, vi), i = 1, . . . , m (2) g(i + 1, j) ≥ g(i, j), i = 0, . . . (n − 1), ∀j (3)
g(i + 1, j) − g(i, j) ≤ g(i, j) − g(i − 1, j), i = 1, . . . (n − 1), ∀j (4)
g(i, j + 1) ≤ g(i, j), j = 0, . . . (l − 1), ∀i (5)
g(i, j + 1) − g(i, j) ≤ g(i, j) − g(i, j − 1), j = 1, . . . (l − 1), ∀i (6) g(i + 1, j) − g(i, j) ≥ g(i + 1, j + 1) − g(i, j + 1), i = 0, . . . (n − 1), j = 0, . . . (l − 1) (7) g(i, j) − g(i, j + 1) ≤ g(i + 1, j) − g(i + 1, j + 1), i = 0, . . . (n − 1), j = 0, . . . (l − 1) (8)
The desired regressions are given by the solution to (1). Figure 3 is derived
using a similar formulation. Details of the formulations and analyses of their
References
Brinton, C., Provan, C., Lent, S., Prevost, T., Passmore, S., June 2011. Col-laborative Departure Queue Management: An Example of ColCol-laborative Decision Making in the United States. In: 9th USA/Europe Air Traf-fic Management Research and Development Seminar (ATM2011). Berlin, Germany.
Burgain, P., 2010. On the control of airport departure processes. Ph.D. thesis, Georgia Institute of Technology.
Burgain, P., Feron, E., Clarke, J.-P., 2009. Collaborative Virtual Queue: Fair Management of Congested Departure Operations and Benefit Analysis. Air Traffic Control Quarterly 17 (2).
Cao, Y., Kotegawa, T., Sun, D., DeLaurentis, D., Post, J., June 2011. Eval-uation of continuous descent approach as a standard terminal airspace operation. In: 9th USA/Europe Air Traffic Management Research and Development Seminar (ATM2011). Berlin, Germany.
Carr, F., 2001. Stochastic modeling and control of airport surface traffic. Master’s thesis, Massachusetts Institute of Technology.
Carslaw, D. C., Beevers, S. D., Ropkins, K., Bell, M. C., 2006. Detecting and quantifying aircraft and other on-airport contributions to ambient nitrogen oxides in the vicinity of a large international airport. Atmospheric Environment 40 (28), 5424–5434.
Clewlow, R., Balakrishnan, H., Reynolds, T. G., June 2010. A survey of airline pilots regarding fuel conservation procedures for taxi operations. International Airport Review, 10–13.
Cros, C., Frings, C., 2008. Alternative taxiing means – Engines stopped. Presented at the Airbus workshop on Alternative taxiing means – Engines stopped.
de Neufville, R., Odoni, A., 2003. Airport Systems: Planning, Design and Management. McGraw-Hill.
Energy and Environmental Analysis, Inc., September 1995. Technical data to support FAA’s circular on reducing emissions for commercial aviation.
Federal Aviation Administration, 2010a. FAA airport diagrams. http://www.faa.gov/airports/runway safety/diagrams/.
Federal Aviation Administration, October 2010b. Fact Sheet Airport Surface Detection Equipment, Model X (ASDE-X).
Feron, E. R., Hansman, R. J., Odoni, A. R., Cots, R. B., Delcaire, B., Hall, W. D., Idris, H. R., Muharremoglu, A., Pujet, N., 1997. The Departure Planner: A conceptual discussion. Tech. rep., Massachusetts Institute of Technology.
Gershwin, S. B., 1994. Manufacturing systems engineering. Prentice Hall. Gershwin, S. B., June 1997. Design and operation of manufacturing
systems-control-and system-theoretical models and issues. In: American Control Conference.
Gilbo, E., 1993. Airport capacity: Representation, estimation, optimization. IEEE Transactions on Control Systems Technology 1 (3), 144–154.
Hamzawi, S. G., 1992. Lack of airport capacity: Exploration of alternative solutions. Transportation Research Part A: Policy and Practice 26 (1), 47–58.
International Civil Aviation Organization, August 2010a. ICAO Carbon Emissions Calculator, Version 3.
International Civil Aviation Organization, July 2010b. ICAO Engine Emis-sions Databank.
Jung, Y., Hoang, T., Montoya, J., Gupta, G., Malik, W., Tobias, L., June 2011. Performance Evaluation of a Surface Traffic Management Tool for Dallas/Fort Worth International Airport. In: 9th USA/Europe Air Traf-fic Management Research and Development Seminar (ATM2011). Berlin, Germany.
Khadilkar, H., Balakrishnan, H., August 2011. Estimation of aircraft taxi-out fuel burn using Flight Data Recorder archives. In: AIAA Guidance, Navigation, and Control Conference. Portland, OR.
Khadilkar, H., Balakrishnan, H., Reilly, B., September 2011. Analysis of air-port performance using surface surveillance data: A case study of BOS. In: AIAA Aviation Technology, Integration and Operations (ATIO) Con-ference. Virginia Beach, VA.
Lou, S., Sethi, S., Zhang, Q., 1994. Optimal feedback production planning in a stochastic two-machine flowshop. European Journal of Operational Research 73 (2), 331–345.
Madas, M. A., Zografos, K. G., 2008. Airport capacity vs. demand: Mismatch or mismanagement? Transportation Research Part A: Policy and Practice 42 (1), 203–226.
Mehndiratta, S. R., Kiefer, M., 2003. Impact of slot controls with a market-based allocation mechanism at San Francisco International Airport. Trans-portation Research Part A: Policy and Practice 37 (7), 47–58.
Miracolo, M. A., Hennigan, C. J., Ranjan, M., Nguyen, N. T., Gordon, T. D., Lipsky, E. M., Presto, A. A., Donahue, N. M., Robinson, A. L., 2011. Secondary aerosol formation from photochemical aging of aircraft exhaust in a smog chamber. Atmospheric Chemistry and Physics 11 (9), 4025–4610.
Nakahara, A., Reynolds, T., White, T., Dunsky, R., September 2011. Anal-ysis of a surface congestion management technique at New York JFK air-port. In: AIAA Aviation Technology, Integration and Operations (ATIO) Conference. Virginia Beach, VA.
Pujet, N., Delcaire, B., Feron, E., 1999. Input-output modeling and control of the departure process of congested airports. AIAA Guidance, Navigation, and Control Conference and Exhibit, Portland, OR, 1835–1852.
Sandberg, M., 2012. Applications of ASDE-X Data to the Analysis of Airport Surface Operations. Master’s thesis, Massachusetts Institute of Technology. Sandberg, M., Reynolds, T. G., Khadilkar, H., Balakrishnan, H., 2013. Air-port Characterization for the Adaptation of Surface Congestion Manage-ment Approaches. In: 10th Eurocontrol/FAA ATM R&D Seminar.
Schwanen, T., Banister, D., Anable, J., 2011. Scientific research about cli-mate change mitigation in transport: A critical review. Transportation Research Part A: Policy and Practice 45 (10), 993–1006.
Simaiakis, I., 2009. Modeling and control of airport departure processes for emissions reduction. Master’s thesis, Massachusetts Institute of Technol-ogy.
Simaiakis, I., 2012. Analysis, Modeling and Control of the Airport Departure Process. Ph.D. thesis, Massachusetts Institute of Technology.
Simaiakis, I., Balakrishnan, H., 2009. Queuing Models of Airport Departure Processes for Emissions Reduction. In: AIAA Guidance, Navigation and Control Conference and Exhibit.
Simaiakis, I., Balakrishnan, H., 2010. Analysis and control of airport depar-ture processes to mitigate congestion impacts. Transportation Research Record: Journal of the Transportation Research Board, 22–30.
Simaiakis, I., Balakrishnan, H., 2011. Departure throughput study for Boston Logan International Airport. Tech. rep., Massachusetts Institute of Tech-nology, No. ICAT-2011-1.
Simaiakis, I., Balakrishnan, H., Sandberg, M., Hansman, R., 2012. Design, Testing and Evaluation of a Pushback Rate Control Strategy. In: 5th International Conference on Research in Air Transportation.
Simaiakis, I., Donaldson, A. D., Balakrishnan, H., September 2011. Impact of heavy aircraft operations on airport capacity at EWR. In: AIAA Aviation Technology, Integration, and Operations Conference. VIrginia Beach, VA. U.S. Department of Transportation, accessed October 2013. Airline Fuel Cost
and Consumption. http://www.transtats.bts.gov/fuel.asp.
Vespermann, J., Wald, A., 2011. Much Ado about Nothing? An analysis of economic impacts and ecologic effects of the EU-emission trading scheme in the aviation industry. Transportation Research Part A: Policy and Practice 45 (10), 10661076.
Yu, K. N., Cheung, Y. P., Cheung, T., Henry, R. C., 2004. Identifying the impact of large urban airports on local air quality by nonparametric re-gression. Atmospheric Environment 38 (27), 4501–4507.