HAL Id: hal-02161416
https://hal.archives-ouvertes.fr/hal-02161416
Submitted on 20 Jun 2019
HAL is a multi-disciplinary open access
archive for the deposit and dissemination of
sci-entific research documents, whether they are
pub-lished or not. The documents may come from
teaching and research institutions in France or
abroad, or from public or private research centers.
L’archive ouverte pluridisciplinaire HAL, est
destinée au dépôt et à la diffusion de documents
scientifiques de niveau recherche, publiés ou non,
émanant des établissements d’enseignement et de
recherche français ou étrangers, des laboratoires
publics ou privés.
Cu-Ag core-shell nanoparticles: A direct correlation
between micro-Raman and electron microscopy
M Cazayous, Cyril Langlois, T. Oikawa, Christian Ricolleau, A Sacuto
To cite this version:
M Cazayous, Cyril Langlois, T. Oikawa, Christian Ricolleau, A Sacuto. Cu-Ag core-shell
nanopar-ticles: A direct correlation between micro-Raman and electron microscopy. Physical Review B:
Condensed Matter and Materials Physics (1998-2015), American Physical Society, 2006, 73 (11),
�10.1103/PhysRevB.73.113402�. �hal-02161416�
Cu-Ag core-shell nanoparticles: A direct correlation between micro-Raman
and electron microscopy
M. Cazayous,1,2,*C. Langlois,1,2T. Oikawa,1,3C. Ricolleau,1,2 and A. Sacuto1,2
1Laboratoire Matériaux et Phénoménes Quantiques (UMR 7162), Université Denis-Diderot (Paris 7), 2 place Jussieu,
75251 Paris, France
2Laboratoire de Physique des Solides (UPR5 CNRS), Ecole Superieure de Physique et de Chimie Industrielle, 10 rue Vauquelin,
75231 Paris, France
3Application and Research Center, JEOL Ltd., 3-1-2 Musashino, Akishima, Tokyo 196-8558, Japan
共Received 5 December 2005; revised manuscript received 17 January 2006; published 15 March 2006兲
Vibration modes of metal core-shell nanoparticles have been measured by confocal micro-Raman spectros-copy. Compared to a standard macroscopic scale, the number of analyzed nanoparticles is reduced to 103– 104.
We observed two distinct contributions in the same Raman spectrum originating from Cu-Ag core-shell and pure Ag nanoparticles. The nanoparticle sizes are calculated and successfully compared to the ones obtained by electron microscopy on the same micron-scale area. The bond matching between Cu core and Ag shell is pointed out from a conjugated Raman and transmission electron microscopy study.
DOI:10.1103/PhysRevB.73.113402 PACS number共s兲: 78.30.Fs, 81.07.Ta, 68.35.Iv
Core-shell nanoparticles have attracted much attention over the past decade due to their unique electronic proper-ties, and their potential use in a wide panel of applications ranging from optical switches to biological labels. The surface-enhanced Raman scattering共SERS兲 takes advantage of the electron confinement in metallic nanoparticles for resonantly coupling the incident light to the plasmons and generate intense localized fields.1,2In particular, the
interac-tion with a plasmon induces a strong Raman scattering by acoustic phonons.3 The electron-phonon coupling and the
properties of phonons in nanoparticles play an important role in the full understanding of SERS. The reliable interpretation of Raman spectra requires a complete characterization of nanoparticles at the finest scale. It is well known that the density of states of acoustic vibrations in isolated nanopar-ticles is discrete and that the low frequency Raman scattering is a powerful and suitable tool for studying their vibration modes.4–6 In the case of a spherical nanoparticle, normal
vibrations can be divided into torsional and spheroidal modes. Torsional modes are purely transversal and have no radial displacement. Spheroidal modes have a mixed charac-ter of radial and tangential motions. Among these vibrations, a purely radial mode is known as a breathing mode. The quadrupolar vibrations corresponding to spheroidal vibra-tions with two deformation axes are usually observed whereas radial modes appear only in systems with narrow size distributions.7Moreover, it has been shown recently that
self-organized silver nanoparticles linked to organic chains can also establish coherent vibrations.8,9To predict the local
responses and to be able to discriminate among different the-oretical and numerical approaches, the knowledge of the lo-cal nanoparticle structure and its environment has to be as-sociated with the vibration modes. However, until now, Raman scattering from confined acoustic phonons has been limited to a macroscopic scale. The reduction of the Raman probed area allows us to directly compare the structural data deduced from the quadrupolar mode to the ones obtained from transmission electron microscopy共TEM兲 images on the identical area.
This paper presents a micro-Raman study of Cu-Ag core-shell nanoparticles elaborated on a carbon thin film evapo-rated on a TEM microscopy grid. The confined vibration modes related to Cu-Ag core-shell and pure Ag nanoparticles have been identified in the same spectrum. Several TEM techniques and analysis methods have been used to charac-terize the same area probed by micro-Raman measurements. The nanoparticle sizes, forms, and compositions deduced from the vibrational Raman and the electron microscopy are in good agreement. Two components in the Raman spectra, depending on the acoustic mismatch between Cu core and Ag shell, have been discerned and correlated to their respec-tive crystallographic orientations.
Nanoparticles are prepared by thermal evaporation under ultrahigh vacuum. The substrate is heated at 400 ° C. After deposition, the nanoparticles are annealed for .5 h at the same temperature. The evaporation rates for Cu and Ag were approximately 0.25 nm/ min. Sample A contains Cu nanopar-ticles obtained by a 2 nm Cu deposition on a thin amorphous carbon film and supported by a microscopy grid with mi-cronumerated square holes. This sample was then covered by a 1.5 nm aluminum layer in order to avoid oxidation of the Cu particles. Sample B has been elaborated with the same Cu deposition as sample A followed by 1 nm of Ag without additional aluminum film.
The structural characterizations of samples A and B were performed using several TEM techniques: high resolution imaging 共HRTEM兲, energy filtered imaging 共EFTEM兲, and scanning high angle dark field imaging 共HAADF-STEM兲 共for details see Refs. 10 and 11兲. The microscope used for this study was a JEM-2100F field-emission TEM operated at 200 keV. The Raman scattering spectra were recorded at room temperature using a triple spectrometer Jobin Yvon T64000 with the high rejection rate in order to measure the low frequency Raman signal closed to the Rayleigh scatter-ing. We used several excitation lines from a Ar+-Kr+mixed
gas laser. The laser beam was guided into a microscope and focused through a 50⫻ long working distance objective with a numerical aperture of 0.4. The scattered light was collected
by the same objective. Samples were kept in vacuum in order to avoid Raman lines arising from air molecules at low fre-quencies and tilted at 40° from the incident light direction to reject its reflection out of the objective. The initial spot di-ameter is about 1.5m and was reduced to 0.7m by the confocal setup. A better spot size cannot be achieved due to the tilt angle of the samples. The number of particles ana-lyzed under the Raman spot is of the order of 103– 104 as
deduced from the nanoparticle density of 104 m−2 mea-sured by TEM. This value has to be compared to macro-scopic values closed to 108contained within a standard spot
diameter of 100m. The Raman and TEM measurements have been performed on the same area. The area of interest was the channel formed by the letter R of the numeration items and the rods of the microscopy grid关see inset in Fig. 1共a兲兴. Therefore Raman spectra are directly correlated to the exact nanoparticle distribution obtained by TEM on the same area.
Figure 2 shows Stokes and anti-Stokes Raman spectra re-corded at low frequencies around the Rayleigh scattering 共centered at 0 cm−1兲 on sample A in the R channel. Since no
changes have been observed for sample A along the channel, only one spectrum is presented for each wavelength. The observed Raman peak is associated with quadrupolar mode of the nanoparticle.4–6 This peak has been shown to come
from a modulation of surface polarization charges via a de-formation potential mechanism. The modulation is due to a modification of the nanoparticle surface orientation during the nanoparticle oscillation.12,13 A complete description of
the Raman peak, in particular the intensity ratios between the
different torsional and spheroidal modes, needs to take into account the various coupling mechanisms between the sur-face plasmon-polaritons and the confined vibrations. Here, we limit our interest to the vibrational properties classically described by Lamb theory.14For an elastic sphere of a
diam-eter D with a free surface, the vibration frequenciescan be written in the following simplified form:
=vt
D , 共1兲
whereis the smallest positive root of an eigenvalue equa-tion depending on the vibraequa-tion mode considered 共torsional or spheroidal兲 and on the ratio between longitudinal vl and
transversalvt sound velocities.15
The diameter D is calculated from Eq.共1兲 using the fre-quency at the maximum intensity of the low frefre-quency peak recorded at 2.7 eV on Cu nanoparticles. At this energy, nano-particles with more spherical shape are selected共see below兲. As can be seen in Table I, the Raman calculated diameter is in agreement with the one measured by TEM using conven-tional image analysis. In Fig. 2 the Stokes peak shifts from 7.2 cm−1 to 6.5 cm−1 when the energy decreased from
2.7 eV to 1.65 eV. To interpret the frequency shift of the quadrupolar mode with the incident wavelength, the mor-phology of the nanoparticle has to be taken into account. When the excitation is shifted to red it has already been shown that the observed nanoparticles tend to an ellipsoidal shape due to the tuning of the plasmon resonance.6Our TEM
measurements show the ellipsoidal shape of the Cu nanopar-ticles with a mean minor and major axis diameter of 8.3 and
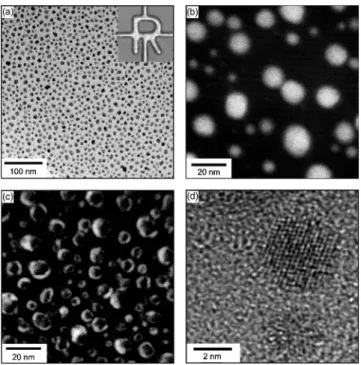
FIG. 1. Images of Cu-Ag core-shell nanoparticles共sample B兲 obtained by 共a兲 bright field TEM, 共b兲 HAADF microscopy 共the enhanced contrast compared to conventional TEM allows an effi-cient particle recognition and to distinguish two size distributions兲, 共c兲 EFTEM showing the core-shell structure of the nanoparticles, and共d兲 HRTEM pointing out the lattice fringes corresponding to a pure Ag nanoparticle.
FIG. 2. Low frequency Raman spectra of Cu nanoparticles 共sample A兲 excited at 共a兲 2.7 eV, 共b兲 2.41 eV, 共c兲 1.65 eV.
TABLE I. Nanoparticle sizes共nm兲 measured by -Raman and TEM on Cu, Cu-Ag and Ag nanoparticles. Ag shell thickness and pure Ag nanoparticle size have been obtained from EFTEM and HAADF images, respectively.
Cu Ag shell Ag
-Raman 9 1.6 4.6
TEM 9.6 1.8 5.4
BRIEF REPORTS PHYSICAL REVIEW B 73, 113402共2006兲
11.5 nm, respectively. In the approximation of a sphere shape, the diameters deduced from Raman spectra are 9, 9.7, and 10.5 nm for 2.7, 2.41, and 1.65 eV excitation energies, respectively. The mean nanoparticle diameter measured with the three excitation lines corresponds closely to the value of the mean major axis obtained by TEM. This selection based on the shape of the nanoparticles allowed us to reduce the number of nanoparticles probed. For the nanoparticles with a mean diameter of 9 nm selected at 2.7 eV, the number of observed nanoparticles can be estimated at 40% of the total distribution determined by TEM under the laser spot.
Figure 3 displays Raman spectra of Cu-Ag core-shell nanoparticles at different energies. In contrast to those of Fig. 2, the spectra of Fig. 3 present two low frequency peaks despite only one associated with the quadrupolar mode of Cu-Ag core-shell nanoparticles is expected. The lower fre-quency peak shifts towards the Rayleigh line, from 5.8 cm−1 to 4.9 cm−1, with the decreasing excitation energy. This behavior is the same as the one witnessed in Cu par-ticles. The frequency of the upper peak is quite constant with a variation of only 0.4 cm−1 between the extreme
wave-lengths. This additional peak may be attributed to the par-ticles’ radial modes, or yet another unidentified nanoparticle specie. The latter is suspected because the observed two peaks are close in intensity whereas the radial mode’s peak intensity is generally found to be weaker than that of qua-drupolar modes.7,12 Moreover, radial modes are only
ob-served with a narrow size distribution of particles.7To
deter-mine the origin of the peak, TEM images have been performed using EFTEM and HRTEM techniques. The EFTEM image of Fig. 1共c兲 shows the Cu-Ag core shell struc-ture of the nanoparticles. The contrast is obtained by the image reconstruction exclusively with the electrons that have lost characteristic energy by inelastic interactions with silver. One extra nanoparticle specie is also visible: small white dots which may be interpreted as pure Ag nanoparticles or core-shell nanostructures beyond the spatial resolution of EFTEM images. HRTEM analysis has been done on these small particles 关Fig. 1共d兲兴. The crystallographic analysis of
the lattice fringes corresponds to pure Ag nanoparticles. Ag atoms cannot escape from local energy minima imposed by the available nucleation sites on the amorphous carbon film leading to the formation of small Ag nanoparticles.
In order to interpret the origin of the higher Raman peak of Fig. 3, the frequencies of the quadrupolar modes have been calculated for both species. Equation共1兲 can be directly used to compute the vibration frequencies of pure Ag par-ticles. The deduced Ag particle diameter for an excitation at 2.7 eV is reported in Table I in agreement with the mean diameter measured by TEM. The quadrupolar modes of Cu-Ag core-shell nanoparticles can be calculated with the Lamb’s approach including the Navier equation.16 We
as-sume the displacement and the stress continuities at the core-shell interface and internal total reflection of the acoustic
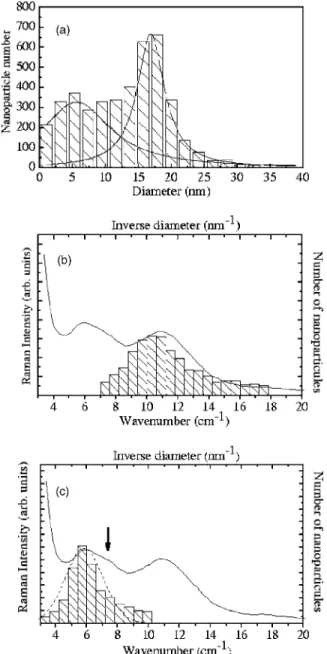
FIG. 4.共a兲 The diameter distribution of nanoparticles of sample
B 共the full lines are the Lorentzian fits兲. Superpositions of the
Stokes Raman spectrum关Fig. 3共a兲兴 on the inverse diameter distri-bution for 共b兲 Ag and 共c兲 Cu-Ag core-shell nanoparticles 共the dashed line is a Gaussian fit on the maximum of the Raman peak兲. FIG. 3. Low frequency Raman spectra on Cu-Ag core-shell
nanoparticles共sample B兲 recorded at 共a兲 2.7 eV, 共b兲 2.41 eV, 共c兲 1.65 eV. Dashed lines are guides for the eyes.
waves at the shell-air interface.17 Further, we used the mean
diameter deduced from Cu nanoparticles of sample A as the core diameter to calculate the Ag shell thickness共Table I兲. The calculated quadrupolar mode frequencies for the differ-ent excitation energies show that the frequency shift ob-served for the Cu-Ag core-shell is mainly due to the ellipsoi-dal shape of the Cu core whereas the small shift measured for the Ag nanoparticles shows the spherical shape of these particles. In a previous Raman study of Ni-Ag core-shell nanoparticles, only the Ag shell vibration has been observed, leading to the conclusion of a weak bonding between Ag and Ni atoms.16The presence of a Raman peak associated with
the Cu-Ag core-shell particles in our spectra indicates that there is a good phase matching of the acoustic wave between the shell and the core. Thus the bonding seems to be stronger between Ag and Cu than between Ag and Ni.
The diameter distribution measured using high contrast HAADF images关Fig. 1共b兲兴 contains two components related to Cu-Ag core shell and Ag nanoparticles 关Fig. 4共a兲兴. The reduction of the Raman probe to ascale allows a compari-son of the Raman spectra with the size distributions of nano-particles measured on the same area. It has already been found that the Raman intensity peak of nanoparticles is pro-portional to the inverse size distribution.9,18Figures 4共b兲 and
4共c兲 exhibit the inverse diameter deduced from TEM super-imposed to the Raman spectrum of sample B measured at 2.7 eV. The Raman intensity of Ag nanoparticle peak matches the inverse diameter distribution关Fig. 4共b兲兴 well. In Fig. 4共c兲, one can notice a discrepancy between Raman and TEM measurements on Cu-Ag core-shell nanoparticles. The Rayleigh scattering prevents us to compare Raman and TEM distribution at low frequencies. Nevertheless, a Gaussian fit
to the Raman peak shows a difference at higher wave num-bers共around 7–8 cm−1兲 due to a slower decrease of the Ra-man intensity关which can be seen more clearly in the spec-trum Fig. 3共c兲兴 compared to the TEM nanoparticle size distribution. First, the discrepancy is located at the same wave number as the Cu nanoparticle peak of Fig. 2. The additional Raman contribution can originate from Cu-Ag nanoparticles with a weak bonding between Cu and Ag lead-ing to a Raman signal from the free Cu core and Ag shell. The latter is hidden in the high wave-number signal. This interpretation is also suggested by nanobeam diffraction on individual Cu-Ag nanoparticles. Few particles present only one crystallographic axis oriented along the same direction for Cu and Ag reducing the sound phase matching between Ag and Cu atoms.19
The reduction of the Raman probe toscale has enabled direct comparison of the nanoparticle sizes, forms, and com-positions to those obtained from TEM on the same area. Two different nanoparticle species have been detected with Ra-man and TEM probes: Cu-Ag core-shell and pure Ag. For Cu-Ag core-shell particles, two components in the Raman spectra can be distinguished depending on the sound phase matching between Cu core and Ag shell. It can be originated from the different orientations of the crystallographic axis between both materials. The direct correlation between Ra-man and TEM reveals the key role played by acoustic pho-non properties at the scale of few particles that can aid to further understand the SERS effect.
The authors thank B. Capelle and E. Larquet for giving access to the TEM of the IMPMC 共Paris兲 and Sawako Na-kamae for a critical reading of the manuscript.
*Electronic address: [email protected]
1M. Moskovits, Rev. Mod. Phys. 57, 783共1985兲. 2J. I. Gersten and A. Nitzan, Surf. Sci. 158, 165共1985兲. 3D. A. Weitz, T. J. Gramila, A. Z. Genack, and J. I. Gersten, Phys.
Rev. Lett. 45, 355共1980兲.
4E. Duval, A. Boukenter, and B. Champagnon, Phys. Rev. Lett.
56, 2052共1986兲.
5M. Fujii, T. Nagareda, S. Hayashi, and K. Yamamoto, Phys. Rev.
B 44, 6243共1991兲.
6B. Palpant, H. Portales, L. Saviot, J. Lermé, B. Prével, M.
Pel-larin, E. Duval, A. Perez, and M. Broyer, Phys. Rev. B 60, 17107共1999兲.
7H. Portales, L. Saviot, E. Duval, M. Fujii, S. Hayashi, N. Del
Fatti, and F. Valle, J. Chem. Phys. 115, 3444共2001兲.
8E. Duval, A. Mermet, A. Courty, P. A. Albouy, and M. P. Pileni,
Phys. Rev. B 72, 085439共2005兲.
9A. Courty, A. Mermet, P. A. Albouy, E. Duval, and M. P. Pileni,
Nat. Mater. 4, 395共2005兲.
10W. Grogger, M. Varela, R. Ristau, B. Shaffer, F. Hofer, and K. M.
Krishnan, J. Electron Microsc. 143, 139共2005兲.
11C. Ricolleau, L. Audinet, M. Gandais, and T. Gacoin, Thin Solid
Films 336, 213共1998兲.
12G. Bachelier and A. Mlayah, Phys. Rev. B 69, 205408共2004兲. 13L. Saviot and D. B. Murray, Phys. Rev. B 72, 205433共2005兲. 14H. Lamb, Proc. London Math. Soc. 13, 187共1882兲.
15The used sound velocities are v
l关Cu兴=4760 m/s, vl关Ag兴
= 3650 m / s, vt关Cu兴=2300 m/s and vt关Ag兴=1660 m/s. The
values for Ag and Cu nanoparticles are 2.89⫻10−2 and 2.82 ⫻10−2m−1s, respectively.
16H. Portales, L. Saviot, E. Duval, M. Gaudry, E. Cottancin, M.
Pellarin, J. Lermé, and M. Broyer, Phys. Rev. B 65, 165422 共2002兲.
17The Ag and Cu density used in the calculation of the continuity
conditions are, respectively, 10.63 and 8.93 g cm−3.
18E. Duval, H. Portales, L. Saviot, M. Fujii, K. Sumitomo, and S.
Hayashi, Phys. Rev. B 63, 075405共2001兲.
19C. Langlois, T. Oikawa, C. Ricolleau, M. Cazayous, and A.
Sacuto共unpublished兲.
BRIEF REPORTS PHYSICAL REVIEW B 73, 113402共2006兲