HAL Id: hal-03007022
https://hal.archives-ouvertes.fr/hal-03007022
Preprint submitted on 16 Nov 2020
HAL is a multi-disciplinary open access archive for the deposit and dissemination of sci-entific research documents, whether they are pub-lished or not. The documents may come from teaching and research institutions in France or abroad, or from public or private research centers.
L’archive ouverte pluridisciplinaire HAL, est destinée au dépôt et à la diffusion de documents scientifiques de niveau recherche, publiés ou non, émanant des établissements d’enseignement et de recherche français ou étrangers, des laboratoires publics ou privés.
multi-cohort study
Grégory Beaudet, Ami Tsuchida, Laurent Petit, Christophe Tzourio, Jan
Schreiber, Zdenka Pausova, Yash Patel, Tomas Paus, Lukas Pirpamer,
Perminder Sachdev, et al.
To cite this version:
Grégory Beaudet, Ami Tsuchida, Laurent Petit, Christophe Tzourio, Jan Schreiber, et al.. Age-related changes of Peak width Skeletonized Mean Diffusivity (PSMD) across the adult life span: a multi-cohort study. 2020. �hal-03007022�
Age-related changes of Peak width Skeletonized Mean Diffusivity
(PSMD) across the adult life span: a multi-cohort study
Grégory Beaudet1, Ami Tsuchida1, Laurent Petit1, Christophe Tzourio2, Svenja
1
Caspers3, 4, Jan Schreiber3, Zdenka Pausova5, Yash Patel5, Tomas Paus6, Reinhold
2
Schmidt7, Lukas Pirpamer7, Perminder S. Sachdev8, Henry Brodathy8, Nicole Kochan8,
3
Julian Trollor8, Wei Wen8, Nicola J. Armstrong9, Ian J. Deary10, Mark E. Bastin10,11,
4
Joanna M. Wardlaw10,11, Susana Munõz Maniega10,11, A. Veronica Witte12, Arno
5
Villringer12, Marco Duering13, Stéphanie Debette2,14, and Bernard Mazoyer1
6
1Institute of Neurodegenerative Diseases (IMN), CNRS, CEA, & University of Bordeaux,
7
Bordeaux, France 8
2Bordeaux Population Health Research Center, Inserm U1219 & University of Bordeaux,
9
Bordeaux, France 10
3Institute of Neuroscience and Medicine (INM-1), Research Centre Juelich, Juelich, Germany
11
4Institute for Anatomy I, Medical Faculty, Heinrich Heine University Dusseldorf, Dusseldorf,
12
Germany 13
5The Hospital for Sick Children and Department of physiology and Nutritional Sciences,
14
University of Toronto, Toronto, ON, Canada 15
6Bloorview Research Institute, Holland Bloorview Kids Rehabilitation Hospital and
16
Departments of Psychology & Psychiatry, University of Toronto, Toronto, ON, Canada 17
7Department of Neurology, Medical University of Graz, Graz, Austria
18
8Centre for Healthy Brain Ageing (CHeBA), School of Psychiatry, UNSW Medicine, University
19
of New South Wales, Sydney, NSW, Australia & Neuropsychiatric Institute Prince of Wales 20
Hospital, Randwick, NSW, Australia 21
9Mathematics and Statistics, Murdoch University, Perth, WA, Australia
10Centre for Cognitive Ageing and Cognitive Epidemiology, Department of Psychology,
23
University of Edinburgh, Edinburgh, United Kingdom 24
11Brain Research Imaging Centre, Division of Clinical Neurosciences, MRC Institute for
25
Dementia Research, University of Edinburgh, Edinburgh, United Kingdom 26
12Max Planck Institute for Human Cognitive and Brain Sciences, Leipzig, Germany
27
13Institute for Stroke and Dementia Research (ISD), University Hospital, LMU Munich,
28
Munich, Germany 29
14Department of Neurology, Bordeaux University Hospital, Bordeaux, France
30 31 * Correspondence: 32 Bernard Mazoyer 33 [email protected] 34
Keywords: ageing, white matter, neurodegeneration, MRI, diffusion, PSMD
35 36
Abstract
37
Parameters of water diffusion in white matter derived from diffusion-weighted imaging (DWI), 38
such as fractional anisotropy (FA), mean, axial, and radial diffusivity (MD, AD and RD), and 39
more recently, peak width of skeletonized mean diffusivity (PSMD), have been proposed as 40
potential markers of normal and pathological brain ageing. However, their relative evolution 41
over the entire adult lifespan in healthy individuals remains partly unknown during early and 42
late adulthood, and particularly for the PSMD index. Here, we gathered and meta-analyzed 43
cross-sectional diffusion tensor imaging (DTI) data from 10 population-based cohort studies 44
in order to establish the time course of white matter water diffusion phenotypes from post-45
adolescence to late adulthood. DTI data were obtained from a total of 20,005 individuals aged 46
18.1 to 92.6 years and analyzed with the same pipeline for computing DTI metrics. For each 47
individual MD, AD, RD, and FA mean values were computed over their FA volume skeleton, 48
PSMD being calculated as the 90% peak width of the MD values distribution across the FA 49
skeleton. Mean values of each DTI metric were found to strongly vary across cohorts, most 50
likely due to major differences in DWI acquisition protocols as well as pre-processing and DTI 51
model fitting. However, age effects on each DTI metric were found to be highly consistent 52
across cohorts. RD, MD and AD variations with age exhibited the same U-shape pattern, first 53
slowly decreasing during post-adolescence until the age of 30, 40 and 50, respectively, then 54
progressively increasing until late life. FA showed a reverse profile, initially increasing then 55
continuously decreasing, slowly until the 70’s, then sharply declining thereafter. By contrast, 56
PSMD constantly increased, first slowly until the 60’s, then more sharply. These results 57
demonstrate that, in the general population, age affects PSMD in a manner different from that 58
of other DTI metrics. The constant increase in PSMD throughout the entire adult life, including 59
during post-adolescence, indicates that PSMD could be an early marker of the ageing 60
process. 61
1 Introduction
62
Parameters of water diffusion in white matter derived from diffusion-weighted imaging (DWI), 63
such as fractional anisotropy (FA), mean, axial, and radial diffusivity (MD, AD and RD) are 64
well-established markers of normal brain maturation(1)(2)(3)(4)(5) and ageing 65
(6)(7)(8)(9)(10)(11)(12) and have been proposed as potential tools for the investigation of 66
various brain disorders (13)(14)(15)(16)(17)(18)(19). 67
More recently, peak width of skeletonized mean diffusivity (PSMD, (20)), a new phenotype of 68
white matter microstructure that can be derived from DWI, has been proposed as an imaging 69
biomarker of small vessel disease (SVD, (20)(21)) and a correlate of cognitive impairment, 70
particularly processing speed (20)(22)(21). So far, our knowledge of the PSMD distribution in 71
healthy individuals has been limited to these three previously mentioned studies that all 72
included people aged over 50 years. In addition, none of these studies addressed the issue 73
of changes in PSMD across lifespan, which is critical for establishing whether PSMD could 74
be used as an imaging marker of brain aging as well as an early predictor of age-related 75
disorders or to serve as a tool to monitor outcomes in clinical trials. Here, we gathered and 76
meta-analyzed cross-sectional diffusion tensor imaging (DTI) data from 10 population-based 77
cohort studies in order to establish the time course, from post-adolescence to late adulthood, 78
of the PSMD distribution and compare it with that of more commonly used white matter water 79
diffusion phenotypes in white matter. 80
2 Materials and Methods
81
2.1 Participants
82
Ten independent datasets coming from cross-sectional cohort studies were gathered in the 83
present study, namely MRi-Share, BIL&GIN, SYS, LIFE-Adult, 1000 BRAINS, UKBiobank, 84
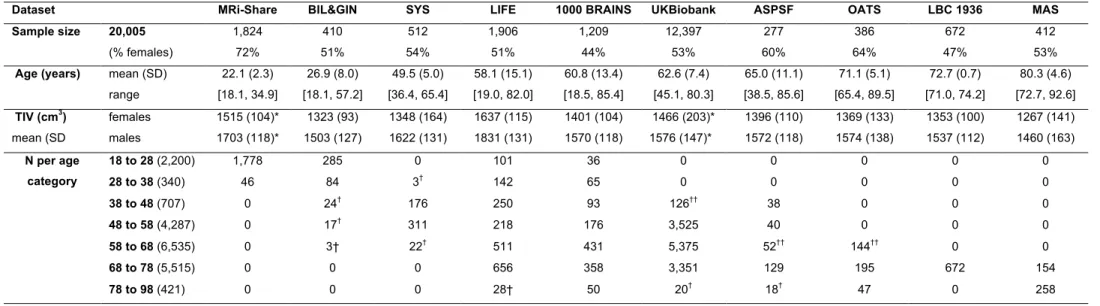
ASPSF, OATS, LBC1936, MAS; (see acronym definition in Table 1 caption). All but three 85
(LIFE-Adult, 1000BRAINS, and UKBiobank) were part of the BRIDGET Consortium (BRain 86
Imaging, cognition, Dementia and next generation GEnomics: a Transdisciplinary approach 87
to search for risk and protective factors of neurodegenerative disease), supported by EU-88
JPND (European Union Joint Programme – Neurodegenerative Disease Research). The 10 89
datasets included a total of 20,005 individuals (age range: 18.1 to 92.6 years, 10,807 women 90
and 9,198 men). Tables 1 and 2 detail sample size and age distribution for the 10 cohorts that 91
were all of cross. 92
2.2 Diffusion-weighted image acquisition and preprocessing
93
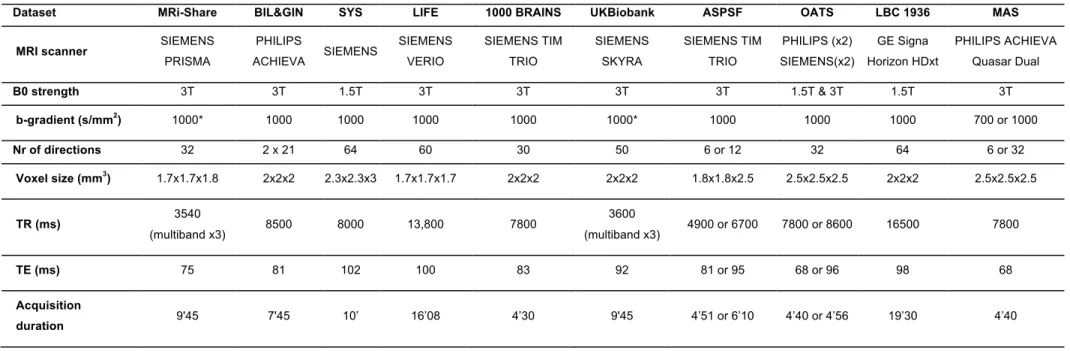
Tables 3 and 4 summarize the main characteristics of the DWI acquisition and preprocessing 94
for the 10 cohorts. Overall, there was considerable variability between studies regarding 95
almost all acquisition parameters, including scanner manufacturer, field strength, gradient 96
strength, diffusion pulse sequence, resolution and number of directions. For the present work, 97
it was not possible to access raw DWI data at different sites in order to harmonize processing 98
from the initial DICOM data. For this reason, DWI datasets were pre-processed with 99
procedures specific to each site, including exclusion of data upon visual detection of major 100
artifacts due to eddy current distortions or head motion. AD, RD, MD and FA maps were 101
computed by fitting the DTI model parameters in each voxel from these preprocessed DWI 102
volumes. Additional details on DWI preprocessing and DTI parameter map computation for 103
each dataset are provided in the Supplementary Material section. 104
2.3 Derivation of DTI metrics
105
Various metrics were derived from the DTI data using a script developed by Baykara et al. 106
(http://www.psmd-marker.com, (20)). This original script was designed to extract PSMD, an
107
index of the dispersion of MD values across the white matter skeleton. Briefly, the 108
computation included two steps: 1-WM skeletonizing using the FA map, and 2- analyzing the 109
voxel value distribution histogram in the MD volume masked by the WM-FA skeleton. The FA 110
volume of each individual was skeletonized using the FSL-TBSS software, part of the FMRIB 111
Software Library (FSL) (23)(24), using the FMRIB 1mm FA template and applying a 0.2 112
threshold on FA maps. Then the MD volume of the same individual was masked, keeping 113
only voxels within the FA skeleton. Furthermore, in order to reduce contamination of the 114
skeleton by CSF voxels, the FA-masked MD volumes were further masked by both a standard 115
FA skeleton with a threshold of 0.3 on FA values and a custom mask (provided with the PSMD 116
software tool) designed so as to exclude regions adjacent to the ventricles, such as the fornix. 117
Finally, PSMD was computed as the difference between the 95th and 5th percentiles of the so-118
masked MD volume voxel value distribution. Here, we extended this script in order to obtain, 119
in addition to PSMD values, estimates of the mean values of axial, radial, and mean diffusivity 120
(AD, RD, MD, respectively) as well as of fractional anisotropy (FA) over the same customized 121
skeleton. All 10 cohorts were processed separately with this customized script and the results 122
sent to the Bordeaux site where they were combined for further statistical analysis. 123
2.4 Statistical analyses
124
2.4.1 Age category definition
125
Due to previously reported non-linear effects of age on DTI metrics (1)(3)(8), we divided each 126
cohort sample into subsamples of 10-years age range starting at 18 years of age, the last 127
subsample (i.e. [78 to 98]) including all subjects aged over 78 years, as there was only a small 128
number of individuals aged over 88 years. Table 1 and Figure 1 detail the contribution of each 129
cohort to each age category. Because we planned running analyses at the age category by 130
cohort by sex level, we discarded subsamples of small sizes, namely containing less than 30 131
individuals. 132
2.4.2 Assessing age-related changes of PSMD and other DTI metrics
133
For each of the five DTI metrics and each age category, we performed an analysis of variance 134
including “Age” as the main effect, and “Sex”, “TIV” (total intracranial volume), and “Cohort” 135
as confounding factors. The Cohort effect was included in order to account for apparent large 136
differences in DTI metric average values across cohorts contributing to the same age 137
category dataset (see Figure 2). In order to document differences of age effects between 138
cohorts contributing to the same age category, we also performed an analysis of variance for 139
each age category and each cohort, including “Age”, “Sex” and “TIV” as effects. Moreover, 140
we analyzed the effects of age on DTI metrics in men and women separately. 141
2.4.3 Assessing the effects of Sex and TIV on PSMD and other DTI metrics
142
For each of the five DTI metrics and each age category, we also performed an analysis of 143
variance including “Sex” and “TIV” as main factors and “Cohort” as confounding factors. 144
All statistical analyses were performed using the JMP Pro Software (version 14.3.0, SAS 145 Institute Inc.). 146 3 Results 147 3.1 Descriptive statistics 148
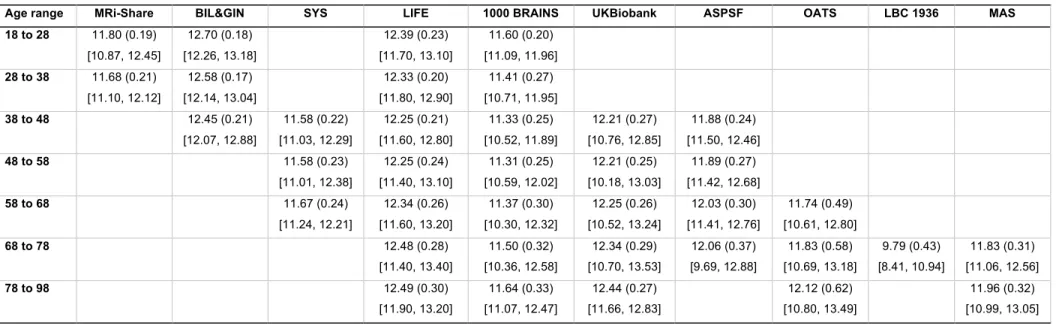
Tables 3a to 3e provide basic statistics across age categories and cohorts for PSMD and the 149
four other DTI metrics, while Figure 2 illustrates their respective profiles across the adult 150
lifespan. From both Table 3 and Figure 2 it is apparent that there is considerable variability in 151
all five DTI parameter values, and that within a given age category the variability across 152
cohorts is larger than the variability between individuals of the same cohort (see the extreme 153
case of AD and FA values for the LBC1936 study performed at 1.5T, for example). 154
Figure 3 compares the inter-individual variability of PSMD (in terms of its coefficient of 155
variation, CV in %) within each cohort to those of the other DTI metrics, again for each age 156
category and each cohort, revealing that PSMD CV’s is in the order of 10 to 15% (with values 157
as high as 20% for later ages) while those for AD, RD, MD and FA are in the order of 2 to 5%. 158
Note also that the CV’s of all DTI metrics increase with age, more for PSMD than for the other 159
parameters. 160
3.2 Effects of age on PSMD and other DTI metrics
161
The evolution of PSMD across the adult life is different from that of the other metrics (Figure 162
2). Indeed, PSMD seems to increase monotonically with age whereas AD, RD, and MD exhibit 163
a similar J-shape profile, initially slightly decreasing during post-adolescence before later 164
increasing during adulthood. As for FA, it shows a reverse profile to that of AD, RD and MD, 165
with an initial small increase followed by a later decrease. 166
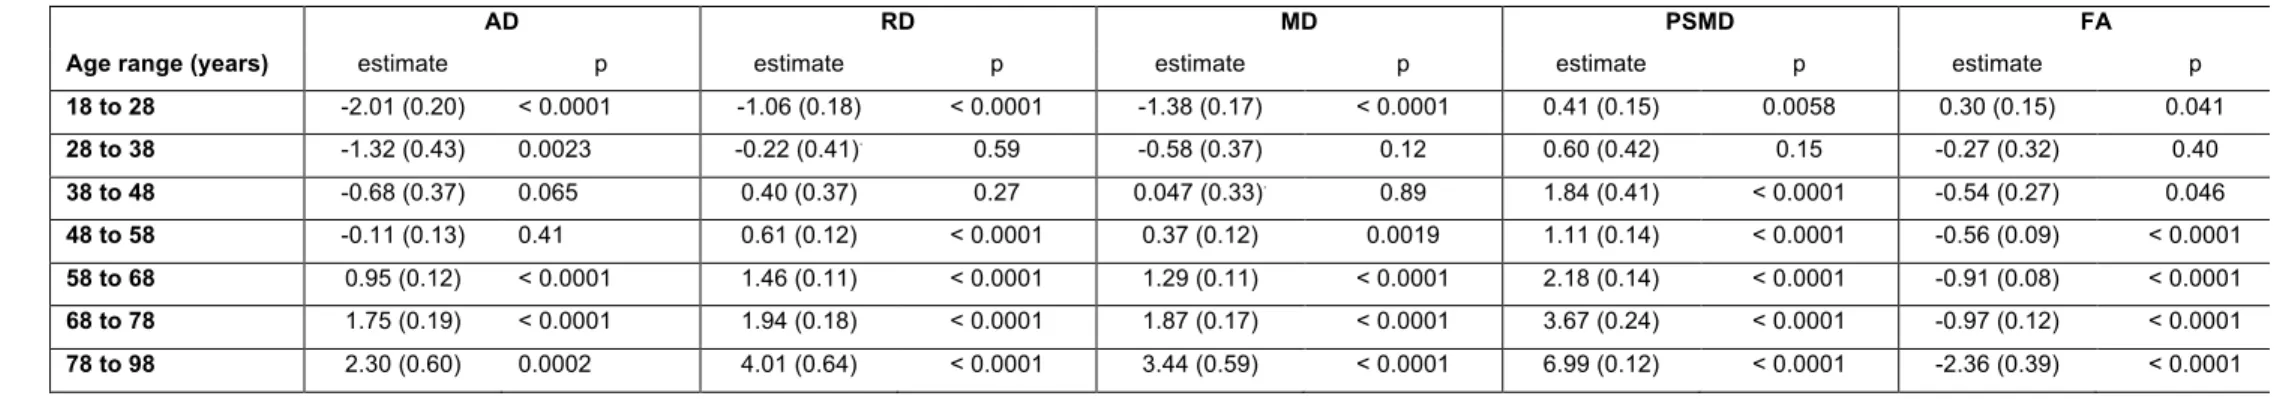
This apparent specific lifespan profile of PSMD was confirmed by the quantitative estimates 167
of the effects of age on PSMD and other DTI metrics provided by the between-cohort ANOVA 168
(see Table 4) and their profiles of evolution across age categories as shown in Figure 4. 169
Estimates of the age effect on PSMD were indeed positive for all age categories and 170
significant for all but the [28 to 38] age period. This increase in PSMD accelerated during late 171
life periods, its value being multiplied by a factor of 3 between the [58 to 68] and the [78 to 172
98] periods. By contrast, AD, RD, and MD age variation profiles were characterized by an 173
initial small but significant decrease (negative age effect), followed by a stable period (non-174
significant age effect) and a final significant increase (positive age effect). What distinguished 175
AD, RD and MD profiles was their respective timings, the initial decrease in RD and MD being 176
significant only for the [18 to 28] subsample, while it extended over the [38 to 48] period for 177
AD. Note that since the stable period covered two periods of 10 years for all three metrics, 178
the increase in AD was delayed by 10 years compared with RD and MD. At the same time, 179
FA exhibited the reverse contrast consisting of an initial increase during the [18 to 28] period 180
followed by a stable period ([28 to 38]) before an accelerated decrease during the rest of the 181
adult life course. The age effects on DTI metrics were not significantly different between men 182
and women as revealed by the separate sex-specific analyses of age effects. 183
3.3 Effects of Sex and TIV on DTI
184
Amplitude of sex effects on DTI metric average values were found to be quite variable across 185
the various cohorts for the different age categories (see Figure 5). When pooling all datasets, 186
we found that sex had significant effects on all DTI parameters except on FA. Women had 187
higher mean AD and MD values than men, who conversely had higher PSMD values than 188
women (see Table 5). As for TIV, we found that it had positive effects on all DTI parameters 189
(see Table 5), including PSMD, these effects being very significant (p < 10-4) in all cases but 190
RD (p=0.53). 191
4 Discussion
192
We will first discuss methodological issues and potential limitations in interpreting results of 193
our study. Second, we will discuss what the present study adds to the already existing 194
literature on age effects on classical DTI parameters. In the third part, we will focus on the 195
original findings regarding PSMD distribution and evolution over the adult life. 196
4.1 Methodological issues and potential limitations of the present study
197
In order to study the effects of age over the entire adult lifespan, we gathered DTI data from 198
20,005 individuals scanned at 10 different sites with the major objective of maximizing 199
statistical power. By so doing, we were aware that the variability of DTI parameters derived 200
from the entire dataset would be much larger than for a single site study because of between-201
site differences in data acquisition protocols such as scanner manufacturer, field strength, 202
number and strength of diffusion-encoding gradients, image voxel size, and post-processing 203
of raw DWI data, and so on (23)(24)(25)(26)(27)(28). Accordingly, a key issue was to reduce 204
as much as possible the variability due to sources that were controllable so that we could 205
maximize benefits of the very large sample size. 206
Concerns with DTI data meta-analysis have been emphasized by several authors (29)(30) 207
and strategies have been proposed for harmonizing DWI data before proceeding to statistical 208
analysis of DTI parameter maps. However, it has also been reported that DTI parameters 209
estimated over the whole white matter or large regions of interest actually exhibit high intra- 210
and inter-scanner reproducibility, making them suitable for multisite studies without extensive 211
harmonization (17)(31)(32). This is the approach that we implemented here as it was not 212
possible to access raw DWI data at different sites in order to harmonize processing from the 213
very earliest stages (see Supplementary Materials). In our study, harmonization was limited 214
to the post-processing of DTI maps pre-computed by each site using the same script for 215
generating individual skeletons and computing individual DTI parameter values across these 216
skeletons. However, our findings indicate that it is possible to draw meaningful conclusions 217
from such minimal harmonization by focusing on the effects of interest (age in our case) rather 218
than the absolute values of the measurements, an approach previously used by others (33). 219
Multi-site studies do have some advantages as compared with single-site investigations, 220
namely statistical power due to very large sample size, and the ability to recruit a sufficient 221
number of individuals over the entire life or adult lifespan. As emphasized by others, these 222
are important features in the context of clinical studies that are often multisite in nature 223
(17)(31). In fact, there have been several previous reports of multisite studies on DTI 224
parameters in adults but they dealt with issues other than age effects such as methodology 225
(26)(17)(29) and genetic effects (34)(35), for example. 226
In this study, we focused on the mean DTI metrics over a white matter skeleton, rather than 227
over the entire white-matter compartment, since our primary metric of interest was PSMD, 228
which is defined over the FSL-TBSS white matter skeleton derived from FA data. This 229
approach should in theory minimize any partial volume effects by limiting the measurement 230
over the core of white matter tracts. Indeed, when we compared the mean DTI metrics over 231
the white matter skeleton with those measured over the whole white-matter compartment in 232
two cohorts of the study (MRi-Share and BIL&GIN), mean FA values were higher and 233
diffusivity values lower when averaged over the white matter skeleton than when averaged 234
over the entire white-matter compartment. However, the cross-subject variability measured 235
as the CV of the mean DTI metrics decreased only marginally (a fraction of a percent for CVs 236
ranging from 2% to 4%) when mean values were computed over the white matter skeleton 237
rather than the whole white matter. In contrast, the CV of PSMD decreased markedly (on 238
average from 24% to 8%) when its computation was performed on the white matter skeleton 239
rather than on than the global white-matter mask. This demonstrates the importance of 240
choosing a measure of MD dispersion values over a white matter skeleton for controlling 241
between subject variability. 242
In the present work, we restricted the analysis to classical DTI metrics as only two of the 243
contributing cohorts had high angular resolution and/or multi-shell acquisition schemes that 244
could be used for estimating advanced white-matter microstructural parameters with more 245
sophisticated models (25). Here, DWI data processing was solely based on the classical DTI 246
model. The DTI model limitations are well-known (24) and it has been shown, for example, 247
that correction for free water has a major impact on classical DTI parameter values (36)(37). 248
However, although investigating advanced white-matter microstructural parameters is highly 249
desirable, it was beyond the scope of our study: it would require additional datasets with multi-250
shell acquisition, especially for individuals aged 30 to 50 years or over 70 years, in order to 251
supplement existing data (8) on the adult lifespan trajectory of these microstructural 252
parameters. 253
We included “Sex” and “TIV” as covariates in our statistical analyses. Mixed results have been 254
reported regarding the impact of sex on DTI measures ((38)(39)(40)(12)(41), see review in 255
(3)). Here we also observed mixed results across the different cohorts, although very 256
significant sex effects on all DTI parameters, except FA, were uncovered when combining the 257
entire dataset. Note, however, these sex effects were of very small size (for PSMD, for 258
example, omega2=6.7x10⁻³ for the sex effect to be compared with 7.6x10⁻² for the age effect), 259
which could explain the mixed findings in the literature, and suggests further investigations 260
are required in order to understand their biological origins. TIV effects on DTI parameters are 261
not well established in the literature. In our study, we found that TIV was positively correlated 262
with all DTI parameters except for RD. Similar to sex, TIV effects when significant were very 263
small (for PSMD again, omega2=1.5x10⁻³ for the TIV effect). Here again additional 264
investigations are needed to understand the origins of these effects. 265
Finally, and importantly, it should be stressed that interpretation of the results of the present 266
study should be taken with caution because of the cross-sectional nature of the data that we 267
analyzed. Numerous reports have indeed pointed out the caveats of cross-sectional design 268
for assessing effects of age and demonstrated how such design may lead to spurious findings 269
when compared to those obtained with longitudinal data ((12)(42)(43)). In the present work, 270
there was no attempt to use a single model to describe the variation of DTI parameters with 271
age over the entire adulthood period. Rather, we selected a piecewise linear model to 272
examine/compare age-related changes in 10-year duration consecutive time bins, thereby 273
minimizing the generation bias between cohorts of nearby categories. Understandably, such 274
an approach does not eradicate the intrinsic limits of our cross-sectional study. But it should 275
be reminded that a fully longitudinal design is quasi impossible to implement in the context of 276
lifespan research, since, in practice, measures in an individual can be repeated only a few 277
times and at short duration intervals. As a consequence, such longitudinal studies suffer from 278
some of the limitations of cross-sectional ones. This may explain why the results of the 279
present study are compatible with those a previously published longitudinal study (12) in 280
which individuals aged between 20 and 84 years were observed twice 3 years apart. 281
4.2 Adult life span profiles of variation of classical DTI parameters AD, RD, MD and
282
FA
283
Effects of age on white-matter microstructure assessed with DTI have been intensively 284
investigated over the past decade from a developmental perspective (4) as well as in a 285
lifespan/ageing framework (1)(11)(40)(3)(12)(11)(5)(8)(36). Briefly, and considering only DTI 286
metrics estimated at the global level, AD, RD and thus MD were reported to follow similar U- 287
or better J-shape age variation patterns, initially decreasing during childhood and 288
adolescence (see (4) for review) then exhibiting an accelerated increase during the adult life 289
(12)(8), while FA followed a reverse profile. Our own findings agree with this body of results 290
during the adult life course. Raw data plots show J-shape profiles for AD, RD and MD, and 291
the reverse profile for FA, as well as acceleration of these changes during late life. 292
Maximum global FA values and minimum global MD, RD, and AD values have been reported 293
to occur before the age of 40 (1)(40)(11)(5)(12), although large variations were found when 294
considering individual tracts (44)(39)(45)(5). Here, we found extreme values for RD, MD and 295
FA occurring between 28 and 38 years, well in line with these previous findings. In addition, 296
we found that the decrease of AD in the post-adolescence period extended into adulthood by 297
about 10 years more than for RD and MD, thereby uncovering heterochrony of AD and RD 298
variations during adulthood. Such a heterochrony during adulthood was not detected in a 299
previous longitudinal study (12) possibly due to an insufficient sample size and large DTI 300
metric variability between individuals (as can be seen in Fig. 7 of the mentioned report). Note 301
that two recent studies (46)(47) have reported opposite age effects for AD (decrease) and 302
RD (increase) with stable MD during the 18 to 55 year age period; however, as both studies 303
used simple linear modeling due to small sample sizes, no age at extreme value could be 304
observed. Rather, our findings are compatible with the AD-RD variation heterochrony that has 305
been noticed earlier during childhood and adolescence at the individual tract level with 306
stronger decrease for RD than for AD (44)(30). According to these and our findings, the AD 307
decrease / RD increase profile (6) would occur only during mid-adulthood. 308
4.3 PSMD is a diffusion imaging phenotype with a profile of variation across the adult
309
life span that differs from that of other DTI parameters
310
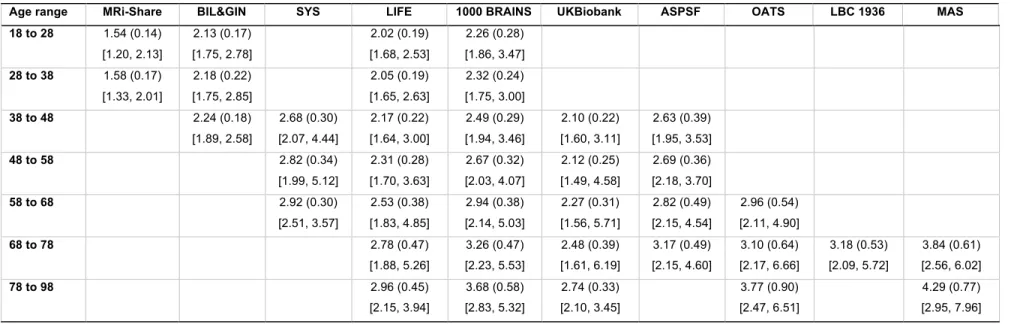
The distribution of PSMD values observed for the different cohorts and age categories of the 311
present study are consistent with the few comparable data reported in the literature for older 312
participants (no data are available in young adults). For example, Baykara et al. reported in 313
their pioneering article a PSMD median value around 3.0 (in mm2s-1 x10⁻⁴, range [2.5, 4.9])
314
in a sample of healthy individuals aged 60 to 80 years drawn from the ASPF cohort (see Table 315
2 of Baykara et al (20)), values that are comparable to those reported in Table 3d of our study 316
in subsamples of other cohorts of similar age category. Similarly, Wei et al (21) recently 317
reported a PSMD average value of 2.4 x 10⁻⁴ mm2s-1 in a sample of healthy controls aged
318
around 60 years. In both studies, PSMD CVs were close to 10%, a value again similar to 319
those observed in our own study. That the CV of PSMD is 2 to 3 times larger than the CVs of 320
other DTI metrics could be expected since PSMD is a dispersion rather than a central 321
tendency statistic. Moreover, the larger increase in PSMD CV as age advances (as compared 322
to the other DTI metrics) indicates that this phenotype should be used with caution especially 323
during the late life period. However, it is important to note that the CV of PSMD was found to 324
be quite stable across cohorts with similar age ranges. 325
The main goal of the present study was to document the profile of PSMD evolution across 326
age bands during adulthood. In this respect, and the proviso that the data we gathered were 327
not longitudinal, our results show that PSMD increases continuously from post-adolescence 328
to late adult life, that this increase is accelerating at later ages, and that this acceleration is 329
larger than for the other DTI metrics. As there are no available data of PSMD in childhood 330
and adolescence, it is not possible to decide whether the lifetime PSMD evolution profile is 331
similar to those of AD, RD, MD, i.e. with a decrease during childhood that reaches the 332
minimum value before adulthood, or if it shows continuous increase throughout the lifespan. 333
Nevertheless, it remains the case that the continuous and accelerating increase of PSMD 334
during adulthood is an indication that it is an adequate and potentially valuable marker of 335
white matter ageing. In particular, it is notable that PSMD increases during early adulthood 336
when the other DTI metrics variations appear to be still undergoing late maturational 337
processes. 338
The biological mechanisms of the origin of PSMD evolution with age are at present unknown, 339
but one can think of several reasons why PSMD may be more prone to increase with age as 340
compared with the other metrics. First, it is important to remember that PSMD is a measure 341
of MD values dispersion across a skeleton of white matter. As such, it will be directly affected 342
by differences across MD values of the individual tracts. Consequently, regional 343
heterogeneity as well as heterochrony in MD values of the fiber tracts will result in higher 344
PSMD values more than in average MD values. Second, MD itself is a weighted average of 345
AD (1/3) and RD (2/3) values, and thus MD value dispersion will also be affected by 346
heterochrony in AD and RD variations with age. Overall, what possibly makes PSMD an early 347
and sensitive imaging marker of ageing is that it captures multiple sources of heterogeneity 348
in white matter water diffusion parameters. With this regard, it would be interesting to 349
investigate variations in the pattern of MD dispersion at the regional level using tract-based 350
DTI metrics since it is well established that heterochrony is a major feature of the development 351
and aging of the different fiber tracts (see for example (44)(39)(8)(5)). Accordingly, variations 352
of PSMD value provide only a gross and possibly biased estimate of the white matter-353
microstructure dynamics. We did not implement regional analysis as our study focused on 354
PSMD that is by definition a dispersion statistic over the entire white matter skeleton. 355
Nevertheless, a regional approach would certainly be interesting and feasible since peak 356
width of MD values could be measured on a white-matter skeleton at the tract level in the 357
same manner as it has been done for other DTI metrics (see (30)(46) for example). 358
5 Acknowledgments
359
Gregory Beaudet has been supported by an EU-ERC starting grant (SEGWAY, PI S Debette, 360
with funding from the European Union’s Horizon 2020 research and innovation program under 361
grant agreement No 640643). Ami Tsuchida is supported by a grant from the Fondation pour 362
la Recherche Médicale (DIC202161236446). Svenja Caspers was supported by the Initiative 363
and Networking Fund of the Helmholtz Association and the European Union’s Horizon 2020 364
Research and Innovation Program under Grant Agreement 785907 (Human Brain Project 365
SGA2). The BRIDGET project is supported by the Fondation Leducq (Transatlantic Network 366
of Excellence on the Pathogenesis of SVD of the Brain) and is an EU Joint Program -367
Neurodegenerative Disease Research (JPND) project. The project is supported through the 368
following funding organizations under the aegis of JPND -www.jpnd.eu: Australia, National 369
Health and Medical Research Council, Austria, Federal Ministry of Science, Research and 370
Economy; Canada, Canadian Institutes of Health Research; France, French National 371
Research Agency; Germany, Federal Ministry of Education and Research; Netherlands, The 372
Netherlands Organization for Health Research and Development; United Kingdom, Medical 373
Research Council. This project has received funding from the European Union’s Horizon 2020 374
research and innovation program under grant agreement No 643417. This project has also 375
received funding from the European Research Council (ERC) under the European Union's 376
Horizon 2020 research and innovation program under grant agreement No 640643. 377
6 Author Contributions
378
Study conception (BM, SD), data collection (GB, CT, SC, ZP, TP, RS, PS, HB, NK, JT, ID, 379
VW, AV, BM), data analysis (GB, LP, SC, JS, YP, LP, PS, WW, NA, MB, SMM, VW, MD, 380
BM), drafting (GB, AT, BM), revising the manuscript (LP, CT, SC, JS, ZP, YP, TP, R, LP, PS, 381
WW, NA, ID, MB, JW, SMM, VW, AV, MD, SD, BM). 382
7 References
383
1. Hasan KM, Sankar A, Halphen C, Kramer LA, Brandt ME, Juranek J, Cirino PT, 384
Fletcher JM, Papanicolaou AC, Ewing-Cobbs L. Development and organization of the human 385
brain tissue compartments across the lifespan using diffusion tensor imaging. Neuroreport 386
(2007) 18:1735-1739. 387
2. Giorgio A, Watkins KE, Chadwick M, James S, Winmill L, Douaud G, De Stefano N, 388
Matthews PM, Smith SM, Johansen-Berg H, et al. Longitudinal changes in grey and white 389
matter during adolescence. NeuroImage (2010) 49:94–103.
390
doi:10.1016/j.neuroimage.2009.08.003 391
3. Lebel C, Gee M, Camicioli R, Wieler M, Martin W, Beaulieu C. Diffusion tensor imaging 392
of white matter tract evolution over the lifespan. NeuroImage (2012) 60:340–352. 393
doi:10.1016/j.neuroimage.2011.11.094 394
4. Lebel C, Treit S, Beaulieu C. A review of diffusion MRI of typical white matter 395
development from early childhood to young adulthood. NMR Biomed (2019) 32:e3778. 396
doi:10.1002/nbm.3778 397
5. Yeatman JD, Wandell BA, Mezer AA. Lifespan maturation and degeneration of human 398
brain white matter. Nat Commun (2014) 5:4932. doi:10.1038/ncomms5932 399
6. Bennett IJ, Madden DJ, Vaidya CJ, Howard DV, Howard JH. Age-related differences 400
in multiple measures of white matter integrity: A diffusion tensor imaging study of healthy 401
aging. Hum Brain Mapp (2010) 31:378-390. doi:10.1002/hbm.20872 402
7. Bartzokis G, Lu PH, Heydari P, Couvrette A, Lee GJ, Kalashyan G, Freeman F, 403
Grinstead JW, Villablanca P, Finn JP, et al. Multimodal Magnetic Resonance Imaging 404
Assessment of White Matter Aging Trajectories Over the Lifespan of Healthy Individuals. Biol 405
Psychiatry (2012) 72:1026–1034. doi:10.1016/j.biopsych.2012.07.010
406
8. Cox SR, Ritchie SJ, Tucker-Drob EM, Liewald DC, Hagenaars SP, Davies G, Wardlaw 407
JM, Gale CR, Bastin ME, Deary IJ. Ageing and brain white matter structure in 3,513 UK 408
Biobank participants. Nat Commun (2016) 7:13629. doi:10.1038/ncomms13629 409
9. de Lange A-MG, Bråthen ACS, Rohani DA, Fjell AM, Walhovd KB. The temporal 410
dynamics of brain plasticity in aging. Cereb Cort (2018) 28:1857-1865. doi: 411
10.1093/cercor/bhy003 412
10. Rathee R, Rallabandi VPS, Roy PK. Age-related differences in white matter integrity 413
in healthy human brain: evidence from structural MRI and diffusion tensor imaging. Magn 414
Reson Insights (2016) 9:9-20. doi:10.4137/MRI.S39666
415
11. Westlye LT, Walhovd KB, Dale AM, Bjornerud A, Due-Tonnessen P, Engvig A, 416
Grydeland H, Tamnes CK, Ostby Y, Fjell AM. Life-Span Changes of the Human Brain White 417
Matter: Diffusion Tensor Imaging (DTI) and Volumetry. Cereb Cortex (2010) 20:2055–2068. 418
doi:10.1093/cercor/bhp280 419
12. Sexton CE, Walhovd KB, Storsve AB, Tamnes CK, Westlye LT, Johansen-Berg H, 420
Fjell AM. Accelerated Changes in White Matter Microstructure during Aging: A Longitudinal 421
Diffusion Tensor Imaging Study. J Neurosci (2014) 34:15425–15436.
422
doi:10.1523/JNEUROSCI.0203-14.2014 423
13. for the Alzheimer’s Disease Neuroimaging Initiative, Chandra A, Dervenoulas G, Politis 424
M. Magnetic resonance imaging in Alzheimer’s disease and mild cognitive impairment. J 425
Neurol (2019) 266:1293–1302. doi:10.1007/s00415-018-9016-3
426
14. Tae W-S, Ham B-J, Pyun S-B, Kang S-H, Kim B-J. Current clinical applications of 427
diffusion-tensor imaging in neurological disorders. J Clin Neurol (2018) 14:129. 428
doi:10.3988/jcn.2018.14.2.129 429
15. Shen X, Adams MJ, Ritakari TE, Cox SR, McIntosh AM, Whalley HC. White matter 430
microstructure and its relation to longitudinal measures of depressive symptoms in mid- and 431
late life. Biol Psychiatry (2019) 86:759-768. doi:10.1016/j.biopsych.2019.06.011 432
16. Suzuki H, Gao H, Bai W, Evangelou E, Glocker B, O’Regan DP, Elliott P, Matthews 433
PM. Abnormal brain white matter microstructure is associated with both pre-hypertension and 434
hypertension. PLOS ONE (2017) 12:e0187600. doi:10.1371/journal.pone.0187600 435
17. Croall ID, Lohner V, Moynihan B, Khan U, Hassan A, O’Brien JT, Morris RG, Tozer 436
DJ, Cambridge VC, Harkness K, et al. Using DTI to assess white matter microstructure in 437
cerebral small vessel disease (SVD) in multicentre studies. Clin Sci (2017) 131:1361–1373. 438
doi:10.1042/CS20170146 439
18. Dekkers IA, Jansen PR, Lamb HJ. Obesity, Brain volume, and white matter 440
microstructure at MRI: A Cross-sectional UK Biobank Study. Radiology (2019) 291:763–771. 441
doi:10.1148/radiol.2019181012 442
19. Zavaliangos-Petropulu A, Nir TM, Thomopoulos SI, Reid RI, Bernstein MA, Borowski 443
B, Jack Jr. CR, Weiner MW, Jahanshad N, Thompson PM. Diffusion MRI Indices and their 444
relation to cognitive impairment in brain aging: the updated multi-protocol approach in ADNI3. 445
Front Neuroinformatics (2019) 13:2. doi:10.3389/fninf.2019.00002
446
20. Baykara E, Gesierich B, Adam R, Tuladhar AM, Biesbroek JM, Koek HL, Ropele S, 447
Jouvent E, Alzheimer’s Disease Neuroimaging Initiative, Chabriat H, et al. a novel imaging 448
marker for small vessel disease based on skeletonization of white matter tracts and diffusion 449
histograms. Ann Neurol (2016) 80:581–592. doi:10.1002/ana.24758 450
21. Wei N, Deng Y, Yao L, Jia W, Wang J, Shi Q, Chen H, Pan Y, Yan H, Zhang Y, et al. 451
A Neuroimaging marker based on diffusion tensor imaging and cognitive impairment due to 452
cerebral white matter lesions. Front Neurol (2019) 10:81. doi:10.3389/fneur.2019.00081 453
22. Deary IJ, Ritchie SJ, Muñoz Maniega S, Cox SR, Valdés Hernández MC, Luciano M, 454
Starr JM, Wardlaw JM, Bastin ME. Brain Peak Width of Skeletonized Mean Diffusivity (PSMD) 455
and cognitive function in later life. Front Psychiatry (2019) 10:524.
456
doi:10.3389/fpsyt.2019.00524 457
23. Barrio-Arranz G, de Luis-García R, Tristán-Vega A, Martín-Fernández M, Aja-458
Fernández S. Impact of MR acquisition parameters on DTI scalar indexes: a tractography 459
based approach. PLOS ONE (2015) 10:e0137905. doi:10.1371/journal.pone.0137905 460
24. Curran KM, Emsell L, Leemans A. “Quantitative DTI Measures,” in Diffusion Tensor 461
Imaging, eds. W. Van Hecke, L. Emsell, S. Sunaert (New York, NY: Springer New York), 65–
462
87. doi:10.1007/978-1-4939-3118-7_5 463
25. Alexander DC, Dyrby TB, Nilsson M, Zhang H. Imaging brain microstructure with 464
diffusion MRI: practicality and applications. NMR Biomed (2019) 32:e3841. 465
doi:10.1002/nbm.3841 466
26. Helmer KG, Chou M-C, Preciado RI, Gimi B, Rollins NK, Song A, Turner J, Mori S. 467
Multi-site study of diffusion metric variability: characterizing the effects of site, vendor, field 468
strength, and echo time using the histogram distance. in Proc SPIE Int Soc Opt Eng (2016), 469
eds. B. Gimi, A. Krol (San Diego, California, United States), 9788. doi:10.1117/12.2217449 470
27. Qin W, Shui Yu C, Zhang F, Du XY, Jiang H, Xia Yan Y, Cheng Li K. Effects of echo 471
time on diffusion quantification of brain white matter at 1.5T and 3.0T. Magn Reson Med 472
(2009) 61:755–760. doi:10.1002/mrm.21920 473
28. Hutchinson EB, Avram AV, Irfanoglu MO, Koay CG, Barnett AS, Komlosh ME, 474
Özarslan E, Schwerin SC, Juliano SL, Pierpaoli C. Analysis of the effects of noise, DWI 475
sampling, and value of assumed parameters in diffusion MRI models: Cross-Model Analysis 476
of Noise and DWI Sampling. Magn Reson Med (2017) 78:1767–1780. 477
doi:10.1002/mrm.26575 478
29. Fortin J-P, Parker D, Tunç B, Watanabe T, Elliott MA, Ruparel K, Roalf DR, 479
Satterthwaite TD, Gur RC, Gur RE, et al. Harmonization of multi-site diffusion tensor imaging 480
data. NeuroImage (2017) 161:149–170. doi:10.1016/j.neuroimage.2017.08.047 481
30. Pohl KM, Sullivan EV, Rohlfing T, Chu W, Kwon D, Nichols BN, Zhang Y, Brown SA, 482
Tapert SF, Cummins K, et al. Harmonizing DTI measurements across scanners to examine 483
the development of white matter microstructure in 803 adolescents of the NCANDA study. 484
NeuroImage (2016) 130:194–213. doi:10.1016/j.neuroimage.2016.01.061
485
31. Grech-Sollars M, Hales PW, Miyazaki K, Raschke F, Rodriguez D, Wilson M, Gill SK, 486
Banks T, Saunders DE, Clayden JD, et al. Multi-centre reproducibility of diffusion MRI 487
parameters for clinical sequences in the brain: Multi-centre reproducibility of diffusion MRI 488
using clinical sequences. NMR Biomed (2015) 28:468–485. doi:10.1002/nbm.3269 489
32. Prohl AK, Scherrer B, Tomas-Fernandez X, Filip-Dhima R, Kapur K, Velasco-Annis C, 490
Clancy S, Carmody E, Dean M, Valle M, et al. Reproducibility of Structural and Diffusion 491
Tensor Imaging in the TACERN Multi-Center Study. Front Integr Neurosci (2019) 13:24. 492
doi:10.3389/fnint.2019.00024 493
33. Jockwitz C, Mérillat S, Liem F, Oschwald J, Amunts K, Caspers S, Jäncke L. 494
Generalizing age effects on brain structure and cognition: A two-study comparison approach. 495
Hum Brain Mapp (2019) 40:2305–2319. doi:10.1002/hbm.24524
496
34. Jahanshad N, Kochunov PV, Sprooten E, Mandl RC, Nichols TE, Almasy L, Blangero 497
J, Brouwer RM, Curran JE, de Zubicaray GI, et al. Multi-site genetic analysis of diffusion 498
images and voxelwise heritability analysis: A pilot project of the ENIGMA–DTI working group. 499
NeuroImage (2013) 81:455–469. doi:10.1016/j.neuroimage.2013.04.061
500
35. Kochunov P, Jahanshad N, Sprooten E, Nichols TE, Mandl RC, Almasy L, Booth T, 501
Brouwer RM, Curran JE, de Zubicaray GI, et al. Multi-site study of additive genetic effects on 502
fractional anisotropy of cerebral white matter: Comparing meta and megaanalytical 503
approaches for data pooling. NeuroImage (2014) 95:136–150.
504
doi:10.1016/j.neuroimage.2014.03.033 505
36. Chad JA, Pasternak O, Salat DH, Chen JJ. Re-examining age-related differences in 506
white matter microstructure with free-water corrected diffusion tensor imaging. Neurobiol 507
Aging (2018) 71:161–170. doi:10.1016/j.neurobiolaging.2018.07.018
508
37. Wu Y-C, Field AS, Whalen PJ, Alexander AL. Age- and gender-related changes in the 509
normal human brain using hybrid diffusion imaging (HYDI). NeuroImage (2011) 54:1840– 510
1853. doi:10.1016/j.neuroimage.2010.09.067 511
38. Sullivan EV, Adalsteinsson E, Hedehus M, Ju C, Moseley M, Lim KO, Pfefferbaum A. 512
Equivalent disruption of regional white matter microstructure in ageing healthy men and 513
women: Neuroreport (2001) 12:99–104. doi:10.1097/00001756-200101220-00027 514
39. Hasan KM, Kamali A, Abid H, Kramer LA, Fletcher JM, Ewing-Cobbs L. Quantification 515
of the spatiotemporal microstructural organization of the human brain association, projection 516
and commissural pathways across the lifespan using diffusion tensor tractography. Brain 517
Struct Funct (2010) 214:361–373. doi:10.1007/s00429-009-0238-0
518
40. Kochunov P, Glahn DC, Lancaster J, Thompson PM, Kochunov V, Rogers B, Fox P, 519
Blangero J, Williamson DE. Fractional anisotropy of cerebral white matter and thickness of 520
cortical gray matter across the lifespan. NeuroImage (2011) 58:41–49.
521
doi:10.1016/j.neuroimage.2011.05.050 522
41. Hsu J-L, Leemans A, Bai C-H, Lee C-H, Tsai Y-F, Chiu H-C, Chen W-H. Gender 523
differences and age-related white matter changes of the human brain: A diffusion tensor 524
imaging study. NeuroImage (2008) 39:566–577. doi:10.1016/j.neuroimage.2007.09.017 525
42. Fjell AndersM, Walhovd KB, Westlye LT, Østby Y, Tamnes CK, Jernigan TL, Gamst 526
A, Dale AM. When does brain aging accelerate? Dangers of quadratic fits in cross-sectional 527
studies. NeuroImage (2010) 50:1376–1383. doi:10.1016/j.neuroimage.2010.01.061 528
43. Pfefferbaum A, Sullivan EV. Cross-sectional versus longitudinal estimates of age-529
related changes in the adult brain: overlaps and discrepancies. Neurobiol Aging (2015) 530
36:2563–2567. doi:10.1016/j.neurobiolaging.2015.05.005
531
44. Lebel C, Walker L, Leemans A, Phillips L, Beaulieu C. Microstructural maturation of 532
the human brain from childhood to adulthood. NeuroImage (2008) 40:1044–1055. 533
doi:10.1016/j.neuroimage.2007.12.053 534
45. Lebel C, Beaulieu C. Longitudinal Development of Human Brain Wiring Continues from 535
Childhood into Adulthood. J Neurosci (2011) 31:10937–10947.
536
doi:10.1523/JNEUROSCI.5302-10.2011 537
46. Kodiweera C, Alexander AL, Harezlak J, McAllister TW, Wu Y-C. Age effects and sex 538
differences in human brain white matter of young to middle-aged adults: A DTI, NODDI, and 539
q-space study. NeuroImage (2016) 128:180–192. doi:10.1016/j.neuroimage.2015.12.033 540
47. Tian L, Ma L. Microstructural Changes of the Human Brain from Early to Mid-541
Adulthood. Front Hum Neurosci (2017) 11:393. doi:10.3389/fnhum.2017.00393 542
8 Tables
544
Table 1. Basic statistics for the 10 contributing datasets. MRi-Share: Magnetic Resonance imaging subcohort of Internet-based Students HeAlth Research Enterprise;
545
BIL&GIN: Brain Imaging of Lateralization study at Groupe d’Imagerie Neurofonctionnelle; SYS cohort: Saguenay Youth Study; ASPSF: Austrian Stroke Prevention
546
Study Family; OATS: Older Australian Twin Study; LBC 1936: Lothian Birth Cohort; MAS: Memory and Ageing Study. TIV: total intracranial volume estimated with
547
Freesurfer 5.3 version except “*” with FreeSurfer 6.0 version. † data subsample size < 30 (not included in the age category statistical analysis)
548
Dataset MRi-Share BIL&GIN SYS LIFE 1000 BRAINS UKBiobank ASPSF OATS LBC 1936 MAS
Sample size 20,005 1,824 410 512 1,906 1,209 12,397 277 386 672 412
(% females) 72% 51% 54% 51% 44% 53% 60% 64% 47% 53%
Age (years) mean (SD) range 22.1 (2.3) [18.1, 34.9] 26.9 (8.0) [18.1, 57.2] 49.5 (5.0) [36.4, 65.4] 58.1 (15.1) [19.0, 82.0] 60.8 (13.4) [18.5, 85.4] 62.6 (7.4) [45.1, 80.3] 65.0 (11.1) [38.5, 85.6] 71.1 (5.1) [65.4, 89.5] 72.7 (0.7) [71.0, 74.2] 80.3 (4.6) [72.7, 92.6] TIV (cm3) mean (SD females males 1515 (104)* 1703 (118)* 1323 (93) 1503 (127) 1348 (164) 1622 (131) 1637 (115) 1831 (131) 1401 (104) 1570 (118) 1466 (203)* 1576 (147)* 1396 (110) 1572 (118) 1369 (133) 1574 (138) 1353 (100) 1537 (112) 1267 (141) 1460 (163) N per age category 18 to 28 (2,200) 1,778 285 0 101 36 0 0 0 0 0 28 to 38 (340) 46 84 3† 142 65 0 0 0 0 0 38 to 48 (707) 0 24† 176 250 93 126†† 38 0 0 0 48 to 58 (4,287) 0 17† 311 218 176 3,525 40 0 0 0 58 to 68 (6,535) 0 3† 22† 511 431 5,375 52†† 144†† 0 0 68 to 78 (5,515) 0 0 0 656 358 3,351 129 195 672 154 78 to 98 (421) 0 0 0 28† 50 20† 18† 47 0 258 549 550
PSMD changes across adult life Table 2. Diffusion-weighted imaging acquisition the 10 contributing datasets. (see Table1 legend for the meaning of dataset abbreviated names and supplementary
551
material section for a more detailed description of these datasets). *: multi-shell acquisition.
552
Dataset MRi-Share BIL&GIN SYS LIFE 1000 BRAINS UKBiobank ASPSF OATS LBC 1936 MAS
MRI scanner SIEMENS
PRISMA PHILIPS ACHIEVA SIEMENS SIEMENS VERIO SIEMENS TIM TRIO SIEMENS SKYRA SIEMENS TIM TRIO PHILIPS (x2) SIEMENS(x2) GE Signa Horizon HDxt PHILIPS ACHIEVA Quasar Dual B0 strength 3T 3T 1.5T 3T 3T 3T 3T 1.5T & 3T 1.5T 3T b-gradient (s/mm2) 1000* 1000 1000 1000 1000 1000* 1000 1000 1000 700 or 1000 Nr of directions 32 2 x 21 64 60 30 50 6 or 12 32 64 6 or 32 Voxel size (mm3) 1.7x1.7x1.8 2x2x2 2.3x2.3x3 1.7x1.7x1.7 2x2x2 2x2x2 1.8x1.8x2.5 2.5x2.5x2.5 2x2x2 2.5x2.5x2.5 TR (ms) 3540 (multiband x3) 8500 8000 13,800 7800 3600 (multiband x3) 4900 or 6700 7800 or 8600 16500 7800 TE (ms) 75 81 102 100 83 92 81 or 95 68 or 96 98 68 Acquisition duration 9'45 7'45 10’ 16’08 4’30 9'45 4’51 or 6’10 4’40 or 4’56 19’30 4’40 553 554
PSMD changes across adult life
Table 3a. Basic statistics of axial diffusivity (AD, in mm2sec-1 x 10⁻⁴) average across a white matter skeleton for each age category and each contributing dataset.
555
Values are mean (S.D. and range [min, max] across the age category sample). See Table1 legend for the meaning of dataset abbreviated names
556
Age range MRi-Share BIL&GIN SYS LIFE 1000 BRAINS UKBiobank ASPSF OATS LBC 1936 MAS
18 to 28 11.80 (0.19) [10.87, 12.45] 12.70 (0.18) [12.26, 13.18] 12.39 (0.23) [11.70, 13.10] 11.60 (0.20) [11.09, 11.96] 28 to 38 11.68 (0.21) [11.10, 12.12] 12.58 (0.17) [12.14, 13.04] 12.33 (0.20) [11.80, 12.90] 11.41 (0.27) [10.71, 11.95] 38 to 48 12.45 (0.21) [12.07, 12.88] 11.58 (0.22) [11.03, 12.29] 12.25 (0.21) [11.60, 12.80] 11.33 (0.25) [10.52, 11.89] 12.21 (0.27) [10.76, 12.85] 11.88 (0.24) [11.50, 12.46] 48 to 58 11.58 (0.23) [11.01, 12.38] 12.25 (0.24) [11.40, 13.10] 11.31 (0.25) [10.59, 12.02] 12.21 (0.25) [10.18, 13.03] 11.89 (0.27) [11.42, 12.68] 58 to 68 11.67 (0.24) [11.24, 12.21] 12.34 (0.26) [11.60, 13.20] 11.37 (0.30) [10.30, 12.32] 12.25 (0.26) [10.52, 13.24] 12.03 (0.30) [11.41, 12.76] 11.74 (0.49) [10.61, 12.80] 68 to 78 12.48 (0.28) [11.40, 13.40] 11.50 (0.32) [10.36, 12.58] 12.34 (0.29) [10.70, 13.53] 12.06 (0.37) [9.69, 12.88] 11.83 (0.58) [10.69, 13.18] 9.79 (0.43) [8.41, 10.94] 11.83 (0.31) [11.06, 12.56] 78 to 98 12.49 (0.30) [11.90, 13.20] 11.64 (0.33) [11.07, 12.47] 12.44 (0.27) [11.66, 12.83] 12.12 (0.62) [10.80, 13.49] 11.96 (0.32) [10.99, 13.05] 557 558
PSMD changes across adult life
Table 3b. Basic statistics of radial diffusivity (RD, in mm2sec-1 x 10⁻⁴) average across a white matter skeleton for each age category and each contributing dataset.
559
Values are mean (S.D. and range [min, max] across the age category sample. (see Table1 legend for the meaning of dataset abbreviated names)
560
Age range MRi-Share BIL&GIN SYS LIFE 1000 BRAINS UKBiobank ASPSF OATS LBC 1936 MAS
18 to 28 4.74 (0.18) [4.15, 5.53] 4.81 (0.19) [4.26, 5.44] 4.83 (0.19) [4.33, 5.29] 4.66 (0.18) [4.26, 5.19] 28 to 38 4.72 (0.21) [4.35, 5.10] 4.79 (0.20) [4.45, 5.56] 4.83 (0.20) [4.42, 5.36] 4.60 (0.18) [4.20, 5.17] 38 to 48 4.83 (0.22) [4.49, 5.27] 5.45 (0.24) [4.88, 6.36] 4.87 (0.22) [4.35, 5.59] 4.64 (0.20) [4.28, 5.27] 4.95 (0.22) [4.19, 5.64] 5.11 (0.29) [4.54, 5.79] 48 to 58 5.51 (0.25) [4.93, 6.54] 4.99 (0.24) [4.47, 6.01] 4.72 (0.22) [4.21, 5.38] 4.97 (0.23) [4.17, 6.22] 5.22 (0.30) [4.57, 6.05] 58 to 68 5.58 (0.31) [5.02, 6.27] 5.13 (0.29) [4.29, 6.36] 4.84 (0.25) [4.21, 5.57] 5.08 (0.26) [4.34, 6.40] 5.47 (0.37) [4.73, 6.59] 5.27 (0.38) [4.36, 6.05] 68 to 78 5.31 (0.33) [4.48, 6.73] 4.99 (0.31) [4.16, 6.29] 5.21 (0.29) [4.29, 7.10] 5.49 (0.35) [4.85, 6.69] 5.40 (0.46) [4.44, 6.77] 5.21 (0.38) [4.28, 8.87] 5.66 (0.34) [5.05, 6.78] 78 to 98 5.37 (0.33) [4.87, 6.31] 5.19 (0.37) [4.69, 5.99] 5.36 (0.20) [5.03, 5.69] 5.75 (0.48) [4.80, 7.08] 5.81 (0.40) [4.88, 7.17] 561 562
PSMD changes across adult life
Table 3c. Basic statistics of mean diffusivity (MD, in mm2sec-1 x 10⁻⁴) average across a white matter skeleton for each age category and each contributing dataset.
563
Values are mean (S.D. and range [min, max] across the age category sample. (see Table1 legend for the meaning of dataset abbreviated names)
564
Age range MRi-Share BIL&GIN SYS LIFE 1000 BRAINS UKBiobank ASPSF OATS LBC 1936 MAS
18 to 28 7.09 (0.16) [6.54, 7.76] 7.44 (0.17) [7.02, 7.98] 7.35 (0.18) [6.89, 7.75] 6.97 (0.17) [6.54, 7.34] 28 to 38 7.04 (0.18) [6.64, 7.38] 7.39 (0.17) [7.08, 7.97] 7.33 (0.18) [6.92, 7.78] 6.87 (0.19) [6.43, 7.39] 38 to 48 7.37 (0.20) [7.05, 7.80] 7.50 (0.21) [6.98, 8.17] 7.33 (0.20) [6.81, 7.84] 6.87 (0.19) [6.42, 7.39] 7.37 (0.22) [6.38, 8.05] 7.37 (0.25) [6.97, 8.01] 48 to 58 7.53 (0.23) [6.97, 8.45] 7.41 (0.22) [6.89, 8.31] 6.92 (0.21) [6.35, 7.58] 7.39 (0.22) [6.17, 8.42] 7.45 (0.27) [6.91, 8.26] 58 to 68 7.61 (0.27) [7.09, 8.20] 7.53 (0.26) [6.82, 8.64] 7.01 (0.25) [6.35, 7.78] 7.47 (0.24) [6.41, 8.67] 7.66 (0.34) [6.98, 8.58] 7.43 (0.41) [6.55, 8.18] 68 to 78 7.70 (0.30) [6.93, 8.92] 7.16 (0.29) [6.30, 8.39] 7.59 (0.27) [6.43, 9.23] 7.68 (0.33) [6.51, 8.74] 7.54 (0.48) [6.57, 8.91] 6.74 (0.35) [5.79, 7.86] 7.72 (0.31) [7.14, 8.71] 78 to 98 7.74 (0.31) [7.23, 8.61] 7.34 (0.34) [6.84, 8.15] 7.72 (0.20) [7.34, 8.01] 7.87 (0.51) [6.92, 9.21] 7.86 (0.36) [6.96, 9.06] 565 566
PSMD changes across adult life
Table 3d. Basic statistics of peak width skeletonized mean diffusivity (PSMD, in mm2sec-1 x 10⁻⁴) for each age category and each contributing dataset. Values are
567
mean (S.D. and range [min, max] across the age category sample. (see Table1 legend for the meaning of dataset abbreviated names.
568
Age range MRi-Share BIL&GIN SYS LIFE 1000 BRAINS UKBiobank ASPSF OATS LBC 1936 MAS
18 to 28 1.54 (0.14) [1.20, 2.13] 2.13 (0.17) [1.75, 2.78] 2.02 (0.19) [1.68, 2.53] 2.26 (0.28) [1.86, 3.47] 28 to 38 1.58 (0.17) [1.33, 2.01] 2.18 (0.22) [1.75, 2.85] 2.05 (0.19) [1.65, 2.63] 2.32 (0.24) [1.75, 3.00] 38 to 48 2.24 (0.18) [1.89, 2.58] 2.68 (0.30) [2.07, 4.44] 2.17 (0.22) [1.64, 3.00] 2.49 (0.29) [1.94, 3.46] 2.10 (0.22) [1.60, 3.11] 2.63 (0.39) [1.95, 3.53] 48 to 58 2.82 (0.34) [1.99, 5.12] 2.31 (0.28) [1.70, 3.63] 2.67 (0.32) [2.03, 4.07] 2.12 (0.25) [1.49, 4.58] 2.69 (0.36) [2.18, 3.70] 58 to 68 2.92 (0.30) [2.51, 3.57] 2.53 (0.38) [1.83, 4.85] 2.94 (0.38) [2.14, 5.03] 2.27 (0.31) [1.56, 5.71] 2.82 (0.49) [2.15, 4.54] 2.96 (0.54) [2.11, 4.90] 68 to 78 2.78 (0.47) [1.88, 5.26] 3.26 (0.47) [2.23, 5.53] 2.48 (0.39) [1.61, 6.19] 3.17 (0.49) [2.15, 4.60] 3.10 (0.64) [2.17, 6.66] 3.18 (0.53) [2.09, 5.72] 3.84 (0.61) [2.56, 6.02] 78 to 98 2.96 (0.45) [2.15, 3.94] 3.68 (0.58) [2.83, 5.32] 2.74 (0.33) [2.10, 3.45] 3.77 (0.90) [2.47, 6.51] 4.29 (0.77) [2.95, 7.96] 569 570
PSMD changes across adult life Table 3e. Basic statistics of fractional anisotropy (FA, unitless) average across individual FA skeleton for each age range category and each contributing dataset.
571
Values are mean (S.D. and range [min, max] across the age category sample. (see Table1 legend for the meaning of dataset abbreviated names)
572
Age range MRi-Share BIL&GIN SYS LIFE 1000 BRAINS UKBiobank ASPSF OATS LBC 1936 MAS
18 to 28 0.53 (0.01) [0.47, 0.58] 0.56 (0.01) [0.51, 0.60] 0.54 (0.02) [0.49, 0.58] 0.54 (0.01) [0.49, 0.56] 28 to 38 0.53 (0.02) [0.49, 0.56] 0.55 (0.02) [0.50, 0.58] 0.54 (0.02) [0.50, 0.58] 0.54 (0.01) [0.49, 0.57] 38 to 48 0.55 (0.02) [0.52, 0.57] 0.46 (0.02) [0.39, 0.50] 0.54 (0.02) [0.48, 0.58] 0.53 (0.02) [0.48, 0.56] 0.53 (0.01) [0.49, 0.56] 0.51 (0.02) [0.46, 0.55] 48 to 58 0.45 (0.02) [0.40, 0.50] 0.53 (0.02) [0.46, 0.57] 0.52 (0.02) [0.47, 0.58] 0.52 (0.02) [0.44, 0.57] 0.49 (0.02) [0.42, 0.54] 58 to 68 0.45 (0.02) [0.41, 0.49] 0.52 (0.02) [0.44, 0.58] 0.51 (0.02) [0.46, 0.57] 0.52 (0.02) [0.44, 0.57] 0.48 (0.02) [0.41, 0.53] 0.48 (0.02) [0.43, 0.55] 68 to 78 0.51 (0.02) [0.40, 0.56] 0.51 (0.02) [0.44, 0.56] 0.51 (0.02) [0.37, 0.57] 0.48 (0.02) [0.41, 0.53] 0.48 (0.03) [0.38, 0.54] 0.41 (0.03) [0.31, 0.47] 0.45 (0.02) [0.36, 0.49] 78 to 98 0.50 (0.02) [0.45, 0.54] 0.50 (0.02) [0.44, 0.53] 0.50 (0.01) [0.48, 0.52] 0.46 (0.02) [0.40, 0.51] 0.45 (0.03) [0.34, 0.51] 573 574 575
PSMD changes across adult life Table 4. ANOVA effect of age (estimate (standard error) and significance p-value) on five DTI metrics (AD, RD, MD, PSMD, and FA evaluated across individual FA
576
skeletons). Values are in mm2s-1year-1 x10⁻⁶ for AD, RD and MD, in mm2s-1year-1 x10⁻⁷ for PSMD, and in year-1 x10⁻³ for FA.
577
AD RD MD PSMD FA
Age range (years) estimate p estimate p estimate p estimate p estimate p
18 to 28 -2.01 (0.20) < 0.0001 -1.06 (0.18) < 0.0001 -1.38 (0.17) < 0.0001 0.41 (0.15) 0.0058 0.30 (0.15) 0.041 28 to 38 -1.32 (0.43) 0.0023 -0.22 (0.41). 0.59 -0.58 (0.37) 0.12 0.60 (0.42) 0.15 -0.27 (0.32) 0.40 38 to 48 -0.68 (0.37) 0.065 0.40 (0.37) 0.27 0.047 (0.33). 0.89 1.84 (0.41) < 0.0001 -0.54 (0.27) 0.046 48 to 58 -0.11 (0.13) 0.41 0.61 (0.12) < 0.0001 0.37 (0.12) 0.0019 1.11 (0.14) < 0.0001 -0.56 (0.09) < 0.0001 58 to 68 0.95 (0.12) < 0.0001 1.46 (0.11) < 0.0001 1.29 (0.11) < 0.0001 2.18 (0.14) < 0.0001 -0.91 (0.08) < 0.0001 68 to 78 1.75 (0.19) < 0.0001 1.94 (0.18) < 0.0001 1.87 (0.17) < 0.0001 3.67 (0.24) < 0.0001 -0.97 (0.12) < 0.0001 78 to 98 2.30 (0.60) 0.0002 4.01 (0.64) < 0.0001 3.44 (0.59) < 0.0001 6.99 (0.12) < 0.0001 -2.36 (0.39) < 0.0001 578 579
PSMD changes across adult life Table 5. ANOVA effect of sex and TIV (estimate (standard error) and significance p-value) on five DTI metrics (AD, RD, MD, PSMD, and FA evaluated across
580
individual FA skeletons). TIV: total intracranial volume. Values for the effects of sex are in mm2s-1 x10⁻⁶ for AD, RD, MD, and PSMD and in x10-3 for FA, and for the
581
effects of TIV are in mm2s-1cm-3 x10⁻⁶ for AD, RD MD, and PSMD and in cm-3 x10⁻⁵ for FA.
582
AD RD MD PSMD FA
Effect estimate p estimate p estimate p estimate p estimate p
Sex (F-M) 1.13 (0.21) < 0.0001 0.45 (0.21) 0.032 0.68 (0.19) 0.0005 -5.34 (0.26) < 0.0001 0.04 (0.14). 0.74
TIV 1.41 (0.12) < 0.0001 0.07 (0.12). 0.53 0.52 (0.01) < 0.0001 1.43 (0.15) < 0.0001 0.54 (0.08) < 0.0001
583 584
9 Figure legends
585
Figure 1. Box-plots and histogram distribution of the age of the participants of the 10
586
contributing datasets. 587
Figure 2. Mean and standard deviation (bars) of the five DTI metrics for each age
588
subcategory and each dataset. The dotted lines connect values for the different age 589
categories of the same dataset. 590
Figure 3. Coefficients of variation of the five DTI metrics for each age subcategory and each
591
dataset. 592
Figure 4. ANOVA estimates and 95% confidence intervals of the effects of age on the five
593
DT metrics for each age subcategory. Units are mm2/s/year x10-3 for AD, RD and MD, 594
mm2/s/year x10-4 for PSMD, /year x10-3 for FA. 595
Figure 5. ANOVA estimates and 95% confidence intervals of the effects of age on the five
596
DT metrics for each age subcategory and each dataset. 597
10 Conflict of Interest
599
The authors declare that the research was conducted in the absence of any commercial or 600
financial relationships that could be construed as a potential conflict of interest. 601
11 Data Availability Statement
602
Requests to access these datasets should be directed to: 603
MRi-Share B Mazoyer [email protected]
BIL&GIN B Mazoyer [email protected]
LIFE A Villringer [email protected]
SYS T Paus [email protected]
1000BRAINS S Caspers [email protected]
UKBIOBANK www.ukbiobank.ac.uk
ASPSF R Schmidt [email protected]
OATS P Sachdev [email protected]
LBC1936 I Deary [email protected]
MAS P Sachdev [email protected]
18 28 38 48 58 68 78 88 98 01_MRi-Share 02_BIL&GIN 03_SYS 04_LIFE 05_1000BRAINS 06_UKBB 07_ASPSF 08_OATS 09_LBC1936 10_MAS 18 28 38 48 58 68 78 88 98 300 600 900 100 50
The copyright holder for this preprint
this version posted January 8, 2020.
;
https://doi.org/10.1101/2020.01.07.896951