HAL Id: hal-00165381
https://hal.archives-ouvertes.fr/hal-00165381
Submitted on 25 Jul 2007
HAL is a multi-disciplinary open access
archive for the deposit and dissemination of
sci-entific research documents, whether they are
pub-lished or not. The documents may come from
teaching and research institutions in France or
L’archive ouverte pluridisciplinaire HAL, est
destinée au dépôt et à la diffusion de documents
scientifiques de niveau recherche, publiés ou non,
émanant des établissements d’enseignement et de
recherche français ou étrangers, des laboratoires
Noise in Vortex Matter
G. Jung, Y. Paltiel, E. Zeldov, Y. Myasoedov, M.L. Rappaport, M. Ocio, S.
Bhattacharya, M.J. Higgins
To cite this version:
G. Jung, Y. Paltiel, E. Zeldov, Y. Myasoedov, M.L. Rappaport, et al.. Noise in Vortex Matter. SPIE
Conference: Fluctuations and Noise (Noise as a Tool for Studying Materials), 2003, Santa Fe, New
Mexico, United States. pp.5112, 222-235. �hal-00165381�
Noise in Vortex Matter
G. Jung
a,b, Y. Paltiel
b, E. Zeldov
b, Y. Myasoedov
b, M. L. Rappaport
b, M. Ocio
c,
S. Bhattacharya
d, M. J. Higgins
da
Department of Physics, Ben Gurion University of the Negev, 84105 Beer Sheva, Israel
bWeizmann Institute of Science, Rehovot 76100, Israel
c
CEA Saclay, 91191 Gif Sur Yvette, Cedex, France
dNEC Research Institute, Princeton, New Jersey 08540, USA
ABSTRACT
The large increase in the flux-flow voltage noise, commonly observed in the vicinity of the peak-effect in super-conductors, is ascribed to a novel noise mechanism. The mechanism consists in random injection of the strongly pinned metastable disordered vortex phase through the sample edges and its subsequent random annealing into the weakly pinned ordered phase in the bulk. This results in large critical current fluctuations causing strong vortex velocity fluctuations. The excess noise due to this dynamic admixture of two vortex phases is found to dis-play pronounced reentrant behavior. In the Corbino geometry the injection of the metastable phase is prevented and, accordingly, the excess noise disappears. Excess flux-flow noise in the peak effect regime is dominated by vortex velocity fluctuations while the density fluctuations, frequently considered in the conventional flux-flow noise models, are negligibly weak. Strong nongaussian fluctuations are associated with S-shaped current-voltage characteristics. The spectral properties of the noise reflect the first order filter-like response of the dynamically coexisting vortex phases. The cutoff frequency in the spectra corresponds to the time-of-flight of vortices through the disordered part of the sample.
Keywords: vortex matter, flux-flow noise, order-disorder transition
1. INTRODUCTION
Fluctuating component of the voltage induced by motion of magnetic flux structures in a superconducting sample, commonly referred to as the flux flow noise, has been intensively studied for many years. Since its discovery in the 1960’s, the flux-flow noise is regarded as a powerful tool enabling a deep insight into the dynamics of vortices. Nevertheless, a comprehensive description of the phenomenon is still lacking, for a critical review of early results see Ref. 1. In general, flux-flow noise can be attributed either to velocity or to density fluctuations of the moving flux. The major unsolved controversy regards the very origin of the flux-flow noise.1, 2
The most popular ”shot noise model” assumes that vortex density fluctuations rigidly flowing across the sam-ple at a constant velocity constitute the source of the flux-flow noise. Such fluctuations are expected to manifest themselves in the time-of-flight oscillations of voltage noise power spectra as well as in a strong dependence of the noise on the geometry of the voltage measuring circuit. These features are seldom, if at all, observed in the experiments. Moreover, the intensity of the experimentally measured flux-flow noise frequently exceeds by orders of magnitude the predictions of the shot noise model. Subsequent modifications of the original ideas introduced the interrupted and chained motion to account for the realistic effects of the time of flight.1, 3, 4The noise
magni-tude problem has been cured by incorporating the Anderson flux bundle concept in the shot noise model.1, 5The
flux bundle scenario, although very useful in explaining the discrepancies between the theoretical picture and the experimental reality, see e.g.,5, 6 introduces esoteric huge flux bundles containing thousands of flux quanta,
shrinking to just few flux quanta, or even nonphysical fraction of a quantum, with increasing temperature or current flow.1, 3, 5, 7
Recently, experiments involving direct SQUID detection of the magnetic noise and flux-to-voltage noise cross-correlation measurements clearly demonstrated that the noise associated with flux motion can not be explained in the framework of the existing models.2, 7 Critical analysis of the early experiments resulted in a new model
based entirely on velocity fluctuations caused by a turbulent flow of surface currents.2 Although the model has
successfully passed several experimental tests, nevertheless, it fails to explain a puzzling feature of the magnetic field and current dependent excess flux-flow noise appearing in a specific and narrow region of the H-T phase diagram.8–12 In low-T
c superconductors the low frequency excess noise occurs in the vicinity of the peak effect
(PE) below Hc2, where the critical current Ic anomalously increases with field.8–10 In high-Tc superconductors
similar noise enhancement was found in the vicinity of the melting, or order-disorder transitions.11–15This
uncon-ventional noise is inconsistent with the common flux-flow noise mechanisms due to its high intensity, exceeding the usual flux-flow noise by orders of magnitude, and strongly non-Gaussian character of the fluctuations.1, 8–10
The excess noise in low-Tc superconductors is just one of several puzzling effects appearing in the lower part
of the PE region. Along with the excess noise one observes memory effects, history and frequency-dependent dynamic response, suppression of ac response by small dc bias current, negative differential resistance, and slow voltage oscillations related to the time of flight. For example, the vortex system remembers the direction, the amplitude, the duration, and the frequency of the previously applied current. On the basis of a strong experi-mental evidence we have recently proposed the edge contamination model (EC) which provides a comprehensive explanation of all exotic phenomena showing out below the PE, attributing them to a dynamic coexistence of the ordered (OP) and disordered (DP) metastable vortex phase.16–18 In this paper we present direct experimental
evidence, obtained using Fe-doped 2H-NbSe2 crystals, that the excess noise does not result from any previously
known flux-flow noise mechanism, but rather is due to a qualitatively different phenomenon of random creation and annihilation of a metastable vortex phase.
2. EDGE CONTAMINATION MECHANISM
Our current understanding of the peak effect is that it is due to the first order phase transition between quasi-ordered weakly pinned Bragg glass-like vortex phase below the PE and strongly pinned disquasi-ordered solid vortex matter within and above the PE. The order-disorder phase transition of the vortex lattice occurring between two solid vortex matter phases allows for existence of a supercooled metastable DP in the part of the phase diagram occupied by the equilibrium OP. At temperatures well below the PE the supercooled phase is very fragile and any small perturbation, such as transport current, will easily anneal it into the equilibrium OP. However, at temperatures only slightly below the PE the applied current will have two competing effects: on one hand it will anneal the disorder, but on the other hand, it will contaminate the system with the fresh DP disorder resulting in a dynamic coexistence of the two phases. The injection of the disordered vortex phase through the sample edges is the core of the edge contamination mechanism.
Current flow in a superconducting sample containing the equilibrium ordered vortex phase well below the phase transition results in a uniform motion of the entire vortex lattice. The penetrating vortices enter at their proper lattice location and the order of the lattice is preserved. However, the presence of surface barriers in real samples significantly changes the situation. Since the barrier height is sensitive to the surface quality, vortices penetrate predominantly at the weakest spots of the barrier, and locally destroy the ordered lattice. Far below the phase transition the disordered state is highly unfavorable energetically and anneals rapidly into OP. However, in the close vicinity below the order-disorder phase transition a metastable DP will be formed near the sample edge. Since near the phase transition the free energies of the two phases are comparable, the metastable DP becomes sufficiently stable on the relevant experimental time scales and gradually penetrates deep into the sample with the flow of the entire lattice.16, 17 Since the DP can be pinned more efficiently it is characterized by
significantly larger critical current then the weakly pinned ordered vortex phase.19, 20The contamination process
causes thus an enhancement of the total integrated critical current of the sample. A strongly pinned metastable disordered vortex phase dynamically anneals in the bulk into an ordered phase with much smaller critical current. Randomness in the DP injection (injection noise) and randomness in its annealing (annealing noise) into the OP results in strong fluctuations of the instantaneous critical current and a pronounced voltage noise.
Let us characterize the DP by the local critical current density Jc(x) which has a non-equilibrium excess value
e
Jc(x) = Jc(x) − Jcordrelative to the critical current of the fully annealed OP. Since in low-temperature
supercon-ductors thermal activation is negligible, the sole annealing mechanism is through a current-driven displacement that allows rearrangement of the vortices during the motion. The relative annealing of eJc upon displacement
0
10
20
30
40
50
0
20
40
60
80
100
I
c dc(V)
V(I)= R [ f I - Ic dc (V )] (DP) V(I) =Rf [ I Ic dis ] (OP) V(I) =Rf [ I Ic ord ]I
c disI
c ordv
o
lt
a
g
e
(
µ
V
)
current (mA)
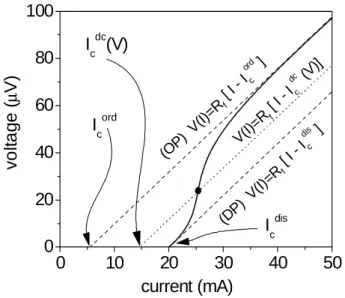
Figure 1.Numerically simulated V − I characteristics, thick line, of coexisting vortex phases at a given dc current bias. The asymptotic characteristics of fully ordered and fully disordered vortex phases are shown with dashed lines.
anneals into the OP. Since the lattice flows with velocity v, eJc at x + ∆x and at time t + ∆t = t + ∆x/v is thus
described by eJc(x + ∆x, t + ∆x/v) = eJc(x, t)(1 − ∆x/Lr), which leads to the partial differential equation of the
annealing process21
∂ eJc(x, t)/∂x + (1/v)∂ eJc(x, t)/∂t = − eJc(x, t)/Lr(v), (1)
with a boundary condition at x = 0, where vortices penetrate into the sample, of eJc(0, t) = Jcdis− Jcord. A key
aspect of the annealing process is that the relaxation length Lr crucially depends on the displacement velocity v
and on the proximity to the phase transition. Close to the phase transition the metastable DP is rather stable and Lr is large. Deeper into the OP region the metastable phase becomes more and more unstable, Lr is small
and Ic is depressed. Fast transient measurements20show that Lrdecreases with increasing vortex displacement
velocity according to an empirical relation Lr≃ L0(v0/v)η = L0(V0/V )η. Here η is typically in the range of 1 to
3, L0, v0, and V0 are scaling parameters, V = vBl is the measured voltage drop, B is the magnetic field, and l
is the distance between the voltage contacts. The dc solution of (1) reads Jdc
c (x) = (Jcdis− Jcord) exp(−x/Lr) + Jcordand the integrated dc critical current
becomes Ic= d Z W 0 Jcdc(x)dx = (Jcdis− Jcord)[1 − e− W Lr (V )]Lr(V )d + Iord c , (2) where Iord
c = JcordW d, W is sample width and d thickness. Observe, that Icdepends on Lr, which in turn depends
on voltage V . To evaluate the shape of the V − I characteristics in the EC scenario assume, for simplicity, that the flux-flow resistance Rf of DP and OP is the same. Then the asymptotic V − I characteristics for the DP
and OP are V = Rf(I − Icdis) and V = Rf(I − Icord), respectively. When the DP and OP coexist V = Rf(I − Ic)
with the voltage dependent Ic given by Eq. 2. An example of the non-linear V − I characteristic obtained by
means of numerical simulations is shown in fig. 1. At very low voltages Lr is larger than the sample width, the
entire sample is contaminated by the DP, and the V − I initially follows the asymptotic dashed line of the DP with Ic = Icdis, where Icdis = JcdisW d. At high vortex velocities Lr becomes very short, most of the sample is
in the OP, and the V − I approaches the asymptotic line of the OP with Ic = Icord, where Icord= JcordW d. In
the crossover region, due to a continuous decrease with current of the total Ic, a nonlinear V − I characteristic
is obtained. The curvature in the crossover region depends on the parameters η, L0, and V0. Our numerical
simulatios show that with rapidly decreasing Lrone may even obtain a negative slope resulting in S-shaped V −I
0
2
4
6
0
2
4
6
8
10
vo
lt
a
g
e
(
µ
V
)
magnetic field (kOe)
H
DT
H
DT
H
s
on
H
s
on
Corbino
Strip
4.2
4.5
4.8
5.1
5.4
5.7
0
2
4
6
8
10
temperature (K)
m
a
g
n
e
ti
c
fi
e
ld
(kO
e
)
DP
OP
DP
H
c2H
DTH
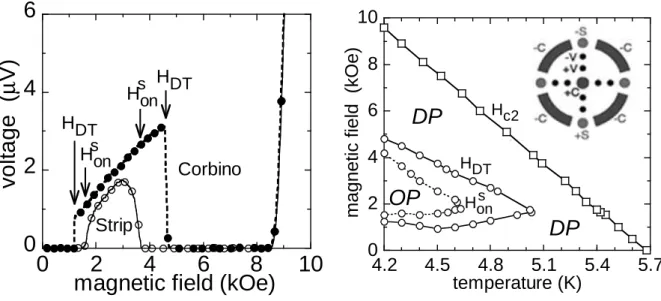
onsFigure 2.a) dc voltage seen in the same sample in Corbino and strip geometry. The current flow in Corbino and strip has been adjusted to provide equal current density in the vicinity of voltage contacts for both geometries. b) Phase diagram of vortex matter in Fe-doped NbSe−2. Dynamic coexistence of DP and OP occurs in the area contained between the HDT
and Hs
onlines Inset: contact configuration enabling measurements in both, Corbino and strip geometry. By applying
the current to the +S, -S contacts, the vortices penetrate through the edge and flow across the sample, similarly to the standard strip configuration. In contrast, by applying the current to the +C, -C contacts, the vortices circulate in the bulk without crossing the edges, as in a Corbino disk. In both configurations the voltage and the corresponding noise are measured across the same contacts +V, -V.
3. ORDER-DISORDER PHASE TRANSITION
In the Corbino disk geometry the vortices circulate in the bulk without crossing sample edges. In such arrange-ment the contamination by DP is avoided and the true bulk properties of the vortex matter can be investigated. In order to perform transport and noise measurements in both the Corbino and strip-like geometry on the same crystal we have prepared a special contact configuration, see inset to fig. 2b.17 The experiments discussed here
were executed using Fe-doped (200 ppm) 2H-NbSe2 single crystal 2.2 × 1.5 × 0.04 mm3large with Tc=5.7 K.17
Similar results were obtained on a number of additional crystals in various configurations. Figure 2a shows the dc voltage response V vs. the magnetic field applied parallel to the crystal c-axis at 4.4 K in the strip and Corbino disk configuration. Since in the Corbino disk the current density varies across the sample, we have applied different driving currents in two geometries in order to have the same average current density between +V,-V contacts in both arrangements. As a result, the measured V and the corresponding vortex velocity are identical at high fields. Upon decreasing the field from above Hc2(T ), the voltage decreases rapidly and vanishes in the PE
region (4 to 8 kOe), where Ic of the sample is large due to the presence of the strongly pinned DP. The voltage
appears again at intermediate fields between the phase transition fields HDT. In this field range the voltage in
the Corbino disk increases linearly with H, consistently with the well known flux-flow behavior, indicating that the flowing lattice is in the ordered phase. The sharp drop of the voltage response at each HDT is due to an
abrupt disorder-driven transition of the equilibrium OP into a highly pinned equilibrium DP. The existence of two transition fields indicates the reentrant behavior of the equilibrium DP in the iron doped NbSe2.17, 22 The
area of the phase coexistence in the phase diagram, see fig. 2b, appears always on the Bragg glass side of the transition. Therefore at low fields we face a mirror-like image of high fields behaviour.
The voltage response of the strip configuration is restricted to a narrower field range contained between high and low onset Hs
onfields. The strip voltage between strongly suppressed relative to the Corbino, indicating
stronger effective pinning as a result of an intermixture of the DP with the OP due to the EC mechanism. Figure 2b shows the phase diagram of the iron doped NbSe2determined in the course of transport measurements
4. DYNAMIC CREATION AND ANNIHILATION OF METASTABLE VORTEX
PHASE AS A SOURCE OF EXCESS NOISE
The generation of the metastable DP is a random process due to the non-uniform penetration of vortices through the surface barrier. As a result, the degree of vortex-lattice disorder and the corresponding value of Jdis
c at the
sample edge are random functions of time. Similarly, annealing of the flowing DP is a random process that can be taken into account by considering Lr to be a random variable. Since Jcdis is typically an order of magnitude
larger than Jord
c ,17 random variations δJcdis and δLr will result in large fluctuations of the integrated critical
current of the sample, causing large voltage noise.
4.1. Simplified model of the noise
The V (I) curve in the vicinity of the peak effect can be correctly approximated by V (I) = Rf[I − Ic(V )], where
Ic given by Eq. 2. In the small signal approximation we separate voltage fluctuations into two terms:
δV (I) ≈ ∂V (I) ∂Ic δIc+ ∂V (I) ∂Rf δRf. (3)
Neglecting, for simplicity, the critical current dependence on voltage, i.e., assuming that the V (I) characteristics is linear above Ic one finds by differentiating the V (I) equation that
∂V ∂Ic = −
∂V
∂I ≡ −Rd, (4)
and (3) becomes
δV (I) = −RdδIc+V (I)
Rf
δRf. (5)
Since experimentally Lris usually smaller than W we can approximate16(2) by Ic≃ Lrd(Jcdis− Jcord) + W dJcord.
In this approximation the fluctuation of the total critical current is
δIc≈ dδ eJc(0)Lr+ d eJc(0)δLr. (6)
From Eg. 5 we obtain that
δV (I) ≈ −dRdJec(0)Lr[δ eJc e Jc +δLr Lr ] + V (I)δRf Rf . (7)
We write now the power spectral density (PSD)of the voltage noise as SV ≈ d2R2dJec 2 (0)L2 rSin/ann+ V2Srf, (8) where Srf =SRf/R 2
f is the normalized spectral density of the flux-flow resistance fluctuations and Sin/ann is the
normalized spectral density of the vortex injection/annealing noise. The most important conclusion that will enable us to understand the excess noise dependence on applied magnetic field and current flow is that the noise intensity is proportional to the product of R2
dJec 2
(0)L2 r.
4.2. Experimental results
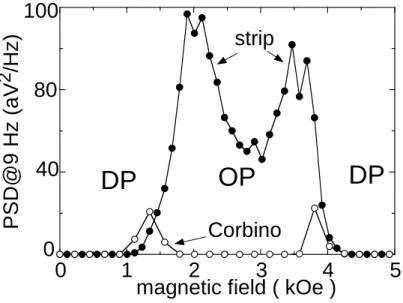
The most direct test of the EC mechanism is the confrontation of the Corbino disk noise with that of the strip arrangement, as shown in fig. 3. In the Corbino the excess noise is almost entirely absent indicating that the randomness in motion of the vortex lattice within the bulk of the sample does not, by itself, create excess noise. The absence of the noise in the Corbino clearly indicates the dominant role of the edge contamination in the noise process. The residual small and narrow peaks in the Corbino noise in fig. 3 can be ascribed to small deviations from a perfect Corbino disk configuration. Since Lr diverges at HDT, any small non-radial part of the current
may result in some injection of the metastable DP, giving rise to noise. Similarly, small inhomogeneities in the quenched disorder may result in a slightly position-dependent HDT. In this case, in a narrow field region in the
0
1
2
3
4
5
P
S
D
@
9
H
z
(a
V
2
/H
z)
magnetic field ( kOe )
strip
Corbino
DP
OP
DP
80
40
0
100
Figure 3. Power spectral density of noise at 9 Hz in Corbino (open symbols) and strip (full symbols) geometry.
OP. When the entire lattice is set in motion the DP drifts into regions of the OP, where it becomes metastable, and may cause noise in this narrow field region.
In contrast, the strip noise is very pronounced. The peak of the noise around 3.5 kOe is a result of the large Lr in the vicinity of the phase transition. The second noise peak at about 2 kOe marks the reentrant
phase transition at which Lr becomes large again on approaching HDT. This low-field peak was not previously
observed since the noise studies were carried out on undoped NbSe28–10 which does not show a pronounced
reentrant disorder-driven transition. The existence of two demonstrates that the excess noise is not a mere result of the fact that Icincreases with H at the PE since at low fields the same excess noise is found in the region where
Ic decreases with H. Furthermore, the same value of Ic is attained at three values of H: above the reentrant
HDT where Ic decreases with H, below the high field HDT where Ic increases with H, and in the upper part of
the PE, above the high field HDT where Icdecreases again with H. The excess noise occurs only in the first two
cases, where the metastable DP contaminates the equilibrium OP. In the third case, above HDT, the DP is the
thermodynamically stable phase and therefore no ‘wrong’ phase is generated at the edges.
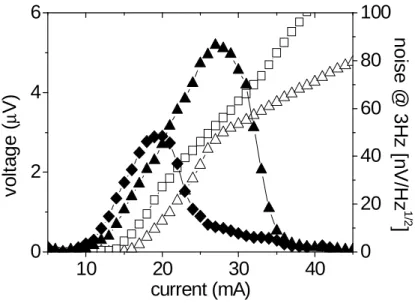
Figure 4 shows the intensity of the noise SV1/2, seen at a selected frequency of 3 Hz, as a function of bias current,
along with the V − I characteristics for two different values of applied magnetic field. In each case, the onset of the noise coincides with the onset of dc current induced dissipation. With increasing current the I-V curve shows an upturn and eventually approaches a linear flux-flow behavior at elevated currents. The noise displays a large peak and vanishes rapidly at higher currents. Assuming for simplicity that δJdis
c is current independent,
the dominant parameters effecting the noise intensity are the relaxation length Lrand the differential resistance
dV /dI, see eq. (8). The initial buildup of the noise with increasing current follows the initial growth of Rd. The
subsequent decay of the noise is the result of a decrease of Lr with increasing vortex velocity. Indeed, above 28
mA the V − I characteristic approaches the linear behavior of the OP, indicating that most of the sample volume is in the OP and that Lr is small. Since the ordered part of the sample does not contribute to the noise, the
noise vanishes as the width of the DP near the edge shrinks to zero. The specific details of the above qualitative description are expected, however, to be significantly more complicated because of several factors, including the conceivable current dependence of δJdis
c and the fact that δV is often comparable to V , resulting in a highly
nonlinear and apparently non-Gaussian response,8, 9 for which the above oversimplified analysis is not valid.
The above considerations facilitate the analysis of the general behavior of the strip noise shown in fig. 5. At low currents, 18 mA, vortex motion occurs only in the central field region far away from HDT. In the vicinity of
the transition the integrated Ic of the strip is larger than the driving current due to the large Lr. As a result, the
10
20
30
40
0
2
4
6
current (mA)
v
o
lt
a
g
e
(
µ
V
)
0
20
40
60
80
100
n
o
is
e
@
3
H
z
[n
V
/H
z
1 /2]
Figure 4. V − I characteristics (open symbols) and spectral intensity of the noise at a fixed frequency of 3 Hz (full symbols) at the frequency of 3 Hz as a function of bias current at 4.2 K: triangles - 2 kOe, diamonds - 3 kOe.
and of the corresponding noise expands and two noise peaks become already apparent. In the central region the DP is less stable, Lr drops with I, and hence the noise decreases rapidly with the current. Closer to the
transition fields, however, the metastable DP is much more stable and therefore even at 23 mA Lrremains large
and noise is still increasing with current. At 36 mA most of the sample is already in the OP and the noise in the central field range has accordingly dropped by two orders of magnitude. The strong excess noise is restricted now only to the narrow regions adjacent to the transition fields where the metastable DP survives even at high vortex velocities.
0
1
2
3
4
5
6
0,1
1
10
100
1000
10000
n
o
is
e
@
3
H
z
(
a
V
2/H
z
)
magnetic field (kOe)
18mA
23mA
34mA
36mA
Figure 5. Power spectral density of the strip noise at a fixed frequency of 3 Hz in a function of magnetic field at various bias currents. T=4.2 K.
4.3. Velocity vs. density fluctuations
Electric field due to magnetic flux motion with a velocity v, neglecting voltages induced by variations of the flux threading the loop composed of voltage measuring leads, can be written simply as E = −v × B. The voltage fluctuations δV (t) = V (t)−V , where V = vBl is the dc voltage, can be due either to the fluctuations of magnetic field δB = Φ0δnBB, fluctuations of the vortex density n, or to the fluctuations of the vortex velocity v. In a small
signal approximation
δV ≈ l(δBv + Bδv). (9)
The first term contains density fluctuations δn = n(t)−n, where n = B/Φ0W l = N/W l is the equilibrium vortex
density and N is the total number of vortices. Vortex density fluctuations can be therefore directly evaluated by measuring the associated magnetic field noise. The second term describes velocity fluctuations δv = v(t) − v, where the equilibrium vortex velocity v = V /Bl. Alternatively, the fluctuating component of the voltage due to current driven vortex motion is given by (3). Direct confrontation of Eq. (9) with Eq. (5) suggest to associate vortex density fluctuations with the fluctuations of the flux-flow resistance δRf and fluctuations of the vortex
velocity with the fluctuations of the critical current δ eJc(0).
In the experiments we have measured simultaneously the voltage and magnetic field noise by placing our NbSe2crystal with attached current and voltage leads directly on the top surface of the 2DEG Hall sensor array.
A dedicated 2DEG Hall sensor array based on AlGaAs/GaAs heterostructures has been grown on undoped semi-insulating oriented GaAs substrates by means of molecular beam epitaxy.23 The employed sensor configuration
consisted of eleven 10×10 µm2 Hall sensors, connected in series with a 30 µm separation between them. The
active 2DEG layer resides only about 0.1 µm below the structure surface. The sensitivity of our Hall sensors to the applied magnetic field was close to 100 mΩ/gauss. Hall sensor bias current causing onset of the excess shot noise was well above 200 µA level enabling us to operate safely at high currents what significantly improved the signal to noise ratio. The ultimate sensitivity of our flux detection system was typically better than 10−3gauss/Hz1/2
at the frequencies above 5 Hz. The entire arrangement was immersed in a specially designed low noise variable temperature cryostat equipped with an external µ-metal magnetic screen and a persistent mode superconducting coil. In each experimental run the sample has been slowly cooled in zero field to the required temperature before application of the magnetic field and bias current.
We have looked for the flux noise manifestations in the entire range of current, magnetic field, and temperature where the excess voltage noise appears. Within the sensitivity of our Hall probe arrangement we could not detect
0
10
20
30
40
0
1
2
3
S
Ic=70 nA
2/Hz
n
o
rm
a
liz
e
d
P
S
D
@
3
H
z
(
1
/H
z
)
(R
d/V)
2(mA
-2)
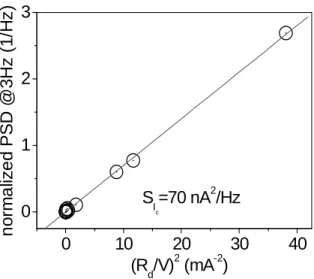
Figure 6. Data points at 2 kOe from fig. 4 plotted as a normalized power spectral density in a function of the R2 d/V2
ratio. Observe that the best linear fit to the data crosses the zero indicating that the voltage noise is due entirely to the density fluctuations, see the text.
any fluctuations of the vortex density. Even by biasing the sample at the very maximum of the voltage noise , where the spectral intensity increases more that 4 orders of magnitude above the preamplifier background, we have not seen any difference in the magnetic noise detected with and without current flow.
In the face of the negative result we have carefully checked and verified that the Hall probe is properly coupled to the sample by measuring the Meissner effect at low fields and self-induced ac field response to ac transport current. All tests proved ambiguously that the Hall sensors are properly operating and the absence of the flux noise signal is not due to unskilfully performed experiment.
The absence of the flux noise can be shown to be, in fact, not surprising and consistent with the EC model predictions. Let us Using rewrite the total spectral density of the voltage noise (5) in terms of the normalized spectral density Sv= SV/V2. Sv= 1 R2 f SRf+ R2 d V2SIc, (10)
By plotting the normalized voltage noise spectral density as a function of the ratio R2
d/V2 one can separate
contributions of the fluctuating vortex density and velocity to the total noise. The PSD value for R2
d/V2 = 0
corresponds to SRf, which in turn describes vortex density fluctuations, while the slope of the SV(R2d/V2) plot
gives the spectral density of the critical current fluctuations SIc.
The experimental data relative to 2 kOe in figure 4, re-plotted in the above coordinate system, are shown in fig. 6. The fit of the data to a linear dependence crossing the zero clearly demonstrates that the excess noise caused by the contamination mechanism is entirely dominated by the critical current fluctuations causing strong velocity fluctuations in the flowing vortex system. Any significant density fluctuations would offset the linear fit upward, such that it would cross the y-axis at the value corresponding to SRf, see eq. (10). This is clearly not
the case in fig. 6. The fit crosses the zero within the error of 10 ppm. The slope of the linear fit corresponds to the spectral density of the critical current noise of 70.1 ± 0.03× nA2/Hz.
4.4. Nongaussianity of the noise and V-I curves
The nongaussian character of the noise is most pronounced at low fields, close to the dissipation onset. We attribute the nongaussian fluctuations to the shape of the V − I curve. In the presentation of the noise model we have pointed out that a rapid decrease of Lrwith increasing vortex velocity (driving current) leads to appearance
of a negative resistance resulting in S-shaped V − I characteristics. Our numerical simulation show that this is particularly prone to occur at low currents close to the dissipation onset. When the strip is current biased within
162
164
166
168
170
0
3
6
9
12
I=33 mA
v
o
lta
g
e
(
µ
V
)
time (s)
25
30
35
40
0
3
6
9
12
disordered
ordered
v
o
lt
a
g
e
(
µ
V
)
current (mA)
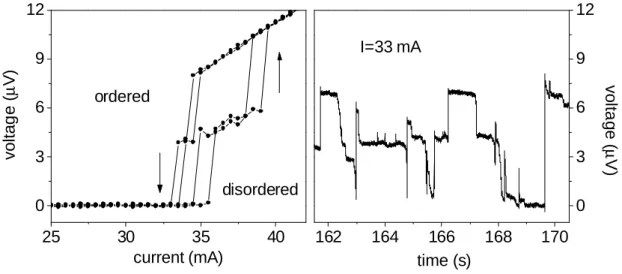
Figure 7. a) Strongly nonlinear double S-shape V − I characteristics. b) The corresponding time record of the voltage seen at the current flow of 33 mA takes form of a 3-level telegraph noise.
1
10
100
frequency [Hz]
1/ f
2
1/ f
4
800 Oe
1000 Oe
1500 Oe
a)
10
-19
10
-16
10
-18
10
-17
P
S
D
(
V
2
/H
z
)
1
10
100
1000
frequency [Hz]
1560 Oe
4.2K
10
-18
10
-16
10
-14
1/ f
0.5
1/ f
2.5
17 mA
23 mA
b)
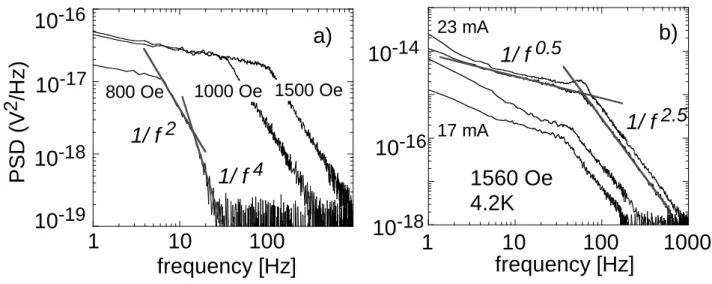
Figure 8. Power spectra at low fields in the vicinity of the reentrant phase transition.
the S-shape range then the vortex system may spontaneously jump between two branches of the V − I curve, see fig. 7, corresponding to random switching between more ordered and more disordered vortex phase. The resulting waveform of the noise will be close to that of extremely non-Gaussian random telegraph signal (RTN). We have observed several manifestations of this type of fluctuations at low fields close to the reentrant transition. The analysis of the phenomena is far from being complete and we present here in fig. 7 just an example of the S-shape V − I characteristics and the corresponding 3-level RTN-like noise waveform.
4.5. Spectral properties
In the entire range of current, magnetic field and temperature the excess noise power spectra display general 1/fα-like power-law behavior, similar to that previously in the vicinity of the PE.8–10 The shape of the spectra
strongly depends on applied magnetic field and driving current. In general, the noise intensity and the power exponent α vary as a function of applied field, whereas changes in the driving current result only in changes of spectral intensity without affecting the functional form of the spectra. Nevertheless, many spectra demonstrate a pronounced kink associated with an abrupt change in the power-law exponent. The appearance of a kink in the spectra has been previously related to the inverse transit time of the vortices across the sample.8, 11, 12
At low fields, close to the reentrant phase transition, and at low frequencies below the kink, the spectra can be well fitted to the power law with α = 0.5. At high frequencies, above the kink, the power exponent changes to α = 2.5, see fig. 8a. When the RTN-like noise appears, and its cutoff frequency is lower than the frequency of the kink, then an exponent α = 2 is observed at frequencies between the RTN lorentzian cutoff and the kink frequency. At frequencies above the kink the power exponent increases to α = 4, as can be seen in fig. 8b. With further increase of the applied field the noise spectrum becomes close to 1/f at low frequencies. In such spectra we observes power low-like dependence with α = 3 at frequencies above the kink, see fig. 9a.
The increasing current initially does not influence the exponent α and only increases the kink frequency and noise intensity. Nevertheless, at very high currents the annealing process is very rapid and when entire sample is in the OP, V − I characteristic becomes linear, and the power spectrum of the strip noise takes the form of 1/f3/2. Observe that the same type of the spectral functional dependence appears in the residual noise of the
Corbino disk, see fig. 9b. We want to point out that the same 1/f3/2 spectral dependence has been recently
ascribed to the nonequilibrium excitations and thermal fluctuations of quasiparticle density in very fast moving vortex cores.24 Since in our experiments the 1/f3/2 spectrum appears not only at very high current densities
1
10
100
P
S
D
(
V
2
/H
z
)
frequency (Hz)
1 / f
3
1 / f
1900 Oe
4.2K
10
-14
10
-18
10
-16
1
10
100
frequency (Hz)
Corbino
strip
1/ f
1.5
10
-19
10
-17
10
-15
Figure 9. a) Power spectra at high fields. b) Power spectra of the residual noise in Corbino disk and of the strip noise at very high driving currents.
that the 1/f3/2 noise spectrum should be rather associated with noise due to the motion of the ordered vortex
phase.
The observed spectral behavior is consistent with the described model as confirmed by our numerical simu-lations, and a simplified frequency response model. Treating the strip containing a mixture of vortex phases as a linear time invariant system (LTI) we deduce that the pule response of our system is of the 1/τ exp (t/τ ) type, leading to the frequency characteristics identical to that of a first order low-pass filter:
H(ω) = Sin
1 + (ωτ )2, (11)
where Sin is the power spectrum of any input signal that appears at the input terminal of the considered LTI
system, including the injection and annealing noise Sin/ann. The time constant
τ = 2πLrtt/W (12)
determines the cutoff frequency fc= 2π/τ of the first order filter and ttis the time of flight of vortices across the
sample. The cutoff frequency coincides with the kink frequency fc at which the power exponent of our spectra
changes by a factor of 2.
tt= W/v = WBl
V (13)
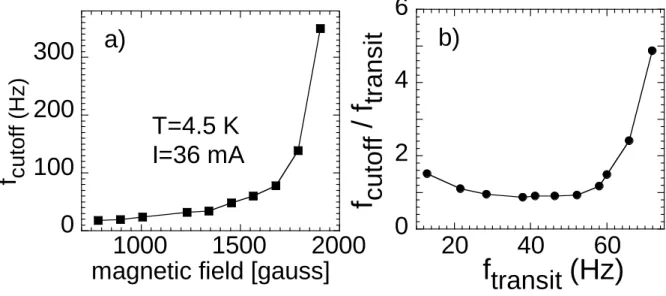
The evolution of the cutoff frequency with applied magnetic field is illustrated in fig. 10a. Observe that for each value of the applied magnetic field (13) enables one to determine the time-of-flight tt from the measured
dc voltage V . Figure 10b shows the data points from fig. 10a plotted now as a ratio fc/ft vs. tt, where the
time of flight frequency ft = 1/tt. Note that in the wide range of magnetic fields the ratio is close to 1. It
follows from (12) that fc= ftwhen Lr = W indicating that the cut-off frequency is given by the time of flight
of vortices across the width Lr, i.e., across the disordered part of the sample. Indeed, the ratio upturns for the
magnetic fields at which the relaxation length starts to be smaller than the sample width W . Hence, spectral measurements provide a new way to determine the relaxation length Lr and its evolution with experimental
parameters.
5. CONCLUSIONS
The excess flux-flow noise appearing in the vicinity of the peak effect has been ascribed to a new mechanism of edge contamination and has been shown not to result from mere random motion of vortices in the bulk of the
0
100
200
300
1000
1500
2000
f
c
u
to
ff
(
H
z
)
magnetic field [gauss]
T=4.5 K
I=36 mA
a)
0
2
4
6
20
40
60
f
c
u
to
ff
/
f
tr
a
n
s
it
f
transit
(Hz)
b)
Figure 10. a) Kink frequency as a function of applied magnetic field. b) The data from Fig. 10a plotted as a ratio between the kink and transit frequency ft= 1/ttin function of tt. The ratio close to 1 indicates that the relaxation length
Lr exceeds the sample width E.
sample. The main conceptual difference is that in the conventional models only random vortex penetration or irregular vortex motion in the bulk is considered. In contrast, we have described a mechanism where random vortex penetration locally creates a new vortex matter phase, which may sustain a tenfold larger critical current than the equilibrium phase. This ‘contamination’ process is particularly prone to occur near the PE where a ‘wrong’ metastable disordered phase, generated at the sample edges in the presence of a driving current, is sufficiently stable on the relevant experimental time scales. The random generation and annealing processes of the metastable DP result in large fluctuations in the instantaneous Icof the sample, leading to very large voltage
noise. Accordingly, we have demonstrated that the excess noise can be eliminated by preventing the formation of the ‘wrong’ phase in the Corbino disk geometry.
Direct flux noise measurements and re-examination of the voltage noise data brought us to conclusion that the excess flux-flow noise is entirely dominated by vortex velocity fluctuations resulting from the critical cur-rent fluctuations. This result may seem surprising to the reader familiar with the experimental evidence of a strong local vortex density noise associated with current driven motion of vortices in high-Tc Bi2Sr2CaCu2Oy
(BSCCO) single crystals.15The flux noise in BSCCO system has been detected using a similar 2DEG Hall probe
arrangement with a similar sensitivity. The major difference between the investigated low-Tcsystem and high-Tc
BSCCO that may account for such pronounced difference in noise behavior is the fact that in the low-Tcsystem
the noise is associated with order-disorder transitions within the solid state of the vortex matter. In a marked difference, in BSCCO the excess noise can be associated with the melting transition of the vortex matter.11–15
Since vortex liquid has higher density than the solid, the local melting transition may result in strong density fluctuations, whereas density difference between the ordered and disordered solid is negligible.
The spectral response of the sample to the injection/annealing noise is equivalent to that a first order low pass filter response with a cut-off frequency given by the time of flight of vortices across the disordered part of the sample. In order to extract more detailed information from the noise spectra, one needs, however, detailed microscopic theories of the generation, annealing, and disentanglement processes of the driven metastable DP, which are currently unavailable. Since the thermodynamic disorder-driven transition HDT is apparently of
first order,17 one may expect that the annealing process of the ‘supercooled’ disordered phase occurs through a
random nucleation and growth mechanism. These important aspects of vortex dynamics have not been addressed previously and call for further theoretical and experimental studies.
exhibiting similar noise associated with a fluctuating pinning force such as incommensurate charge density waves or Wigner crystals in two-dimensional electron gas.
ACKNOWLEDGMENTS
This work was supported by the Israel Science Foundation - Center of Excellence Program, by the US-Israel Binational Science Foundation (BSF), and by French-Israeli exchange program ”Arc-en-Ciel”. EZ acknowledges support by the German-Israeli Foundation G.I.F. and by the Fundacion Antorchas - WIS program.
REFERENCES
1. J. R. Clem, ”Flux-flow noise in superconductors,” Phys. Rep. 75, 1, 1981.
2. B. Placais, P. Mathieu and Y. Simon, ”Magnetic-field and voltage noise in type-II superconductors,” Phys. Rev. B 49, 15813, 1994.
3. P. Jarvis and J. G. Park, ”Noise voltages produced by flux motion in superconducors,” J. Phys. F. 5, 1573, 1975.
4. V. D. Ashkenazy, G. Jung, and B. Ya. Shapiro, ”Voltage noise due to randomly interrupted motion of vortices,” Physica C 254, 77, 1995.
5. K. E. Gray, ”Vortex correlation lengths and bundle sizes from voltage noise in Y Ba2Cu3O7,” Phys. Rev. B
57, 5524, 1998.
6. G. Jung, S. J. Lewandowski, B. Ya. Shapiro, and Y. Yuzhelevski, ”Quasi-Josephson effects in coherent vortex motion in a periodic potential,” Physica C 332, 51, 2000.
7. W. J. Yeh and Y. H. Kao, ”Flux-flow noise in type-II superconductors,” Phys. Rev. B 44, 360, 1991). 8. A. C. Marley, M. J. Higgins, and S. Bhattacharya, ”Flux-flow noise and dynamical transitions in a
flux-line-lattice,” Phys. Rev. Lett. 74, 3029, 1995.
9. R. D. Merithew, M. W. Rabin, M. B. Weissman, M. J. Higgins, and S. Bhattacharya, ”Persistent metastable states in vortex flow at the peak effect in N bSe2,” Phys. Rev. Lett. 77, 3197, 1996.
10. M. W. Rabin, R. D. Merithew, M. B. Weissman, M. J. Higgins, and S. Bhattacharya, ”Noise probes of underlying static correlation lengths in the superconducting peak effect,” Phys. Rev. B 57, R720, 1998. 11. H. Safar, P. L. Gammel, D. A. Huse, D. J. Bishop, D. J. Rice, D. M. Ginsberg, ”Experimental-evidence for
a 1st-order vortex-lattice-melting transition in untwinned, single-crystal Y Ba2Cu3O7,” Phys. Rev. Lett. 69,
824, 1992.
12. G. D’Anna, P. L. Gammel, H. Safar, G. B. Alers, D. J. Bishop, J. Giapintzakis, and D. M. Ginsberg, ”Vortex-motion-induced voltage noise in Y Ba2Cu3O7−δsingle-crystals,” Phys. Rev. Lett. 75, 3521, 1995.
13. W. K. Kwok, G. W. Crabtree, J. A. Fendrich, and L. M. Paulius, ”Dynamic instabilities in the vortex lattice of Y Ba2Cu3O7−δ,” Physica C 293, 111, 1997.
14. S. N. Gordeev, P. A. J. deGroot, M. Oussena, A. V. Volkozub, S. Pinfold, R. Langan, R. Gagnon, L. Taillefer, ”Current-induced organization of vortex motion in type-II superconductors,” Nature 385, 324, 1997.
15. T. Tsuboi, T. Hanaguri and A. Maeda, ”Local Density Fluctuations of Moving Vorticies in the Solid and Liquid Phases in BiSr2CaCu2O7,” Phys. Rev. Lett. 80, 4550 (1998); A. Maeda, T. Tsuboi, R. Abiru, Y.
Togawa, H. Kitano, K. Iwaya, and T. Hanaguri, ”Location-sensitive measurement of the local fluctuation of driven vortex density in Bi2Sr2CaCu2Oy,” Phys. Rev. B 65, 054506, 2002.
16. Y. Paltiel, E. Zeldov, Y. N. Myasoedov, H. Shtrikman, S. Bhattacharya, M. J. Higgins, Z. L. Xiao, E. Y. An-drei, P. L. Gammel, and D. J. Bishop, ”Dynamic instabilities andmemory effects in vortex matter,” Nature 403, 398 (2000).
17. Y. Paltiel, E. Zeldov, Y. N. Myasoedov, M. L. Rappaport, G. Jung, S. Bhattacharya, M. J. Higgins, Z. L. Xiao, E. Y. Andrei, P. L. Gammel, and D. J. Bishop, ”Instabilities and disorder-driven first-order transition of the vortex lattice,” Phys. Rev. Lett. 85, 3712, 2000.
18. Y. Paltiel, G. Jung, Y. Myasoedov, M. L. Rappaport, E. Zeldov, M. J. Higgins, and S. Bhattacharya, ”Dynamic creation and annihilation of metastable vortex phase as a source of excess noise,” Europhys. Lett. 58, 112, 2002.
19. S. Bhattacharya and M. J. Higgins, ”Flux-flow fingerprint of disordered-melting versus tearing of a flux-line-lattice,” Phys. Rev. B 52, 64, 1995.
20. W. Henderson, E. Y. Andrei, M. J. Higgins, and S. Bhattacharya, ”Metastability and glassy behavior of a driven flux-line lattice,” Phys. Rev. Lett. 77, 2077, 1996.
21. Y. Paltiel, Y. Myasoedov,, E. Zeldov, G. Jung, M. L. Rappaport, D. E. Feldman, M. J. Higgins, and S. Bhattacharya, ”V-I characteristics in the vicinity of the order-disorder transition in vortex matter,” Phys. Rev. B 66, 060503R, 2002.
22. K. Ghosh, S. Ramakrishnan, A. K. Grover, Gautam I. Menon, Girish Chandra, T. V. Chandrasekhar Rao, G. Ravikumar, P. K. Mishra, V. C. Sahni, C. V. Tomy, G. Balakrishnan, D. Mck Paul, and S. Bhattacharya, ”Reentrant peak effect and melting of a flux line lattice in 2H-NbSe2,” Phys. Rev. Lett. 76, 4600, 1996; S.
S. Banerjee, N. G. Patil, S. Ramakrishnan, A. K. Grover, S. Bhattacharya, P. K. Mishra, G. Ravikumar, T. V. C. Rao, V. C. Sahni, M. J. Higgins, C. V. Tomy, G. Balakrishnan, D. M. Paul, ”Re-entrant peak effect in an anisotropic superconductor 2H-NbSe2: Role of disorder ,” Europhys. Lett. 44, 91, 1998.
23. G. Jung, M. Ocio, Y. Paltiel, H. Shtrikman, E. Zeldov, ”Magnetic Noise Measurements Using Cross-Correlated Hall Sensor Arrays,” Appl. Phys. Lett. 78, 359-361 (2001).
24. D. Babi´c, T. Nussbaumer, C. Strunk, C. Sch¨onenberger, and C. S¨urgers, ”Vortex motion noise in micrometer-sized thin films of the amorphous Nb0.7Ge0.3weak-pinning superonductor,” Phys. Rev. B 66, 014537, 2002.