HAL Id: hal-03211868
https://hal.archives-ouvertes.fr/hal-03211868
Submitted on 29 Apr 2021
HAL is a multi-disciplinary open access
archive for the deposit and dissemination of
sci-entific research documents, whether they are
pub-lished or not. The documents may come from
teaching and research institutions in France or
abroad, or from public or private research centers.
L’archive ouverte pluridisciplinaire HAL, est
destinée au dépôt et à la diffusion de documents
scientifiques de niveau recherche, publiés ou non,
émanant des établissements d’enseignement et de
recherche français ou étrangers, des laboratoires
publics ou privés.
Fast adiabatic heating and temperature relaxation in
near-critical fluids under zero gravity
Marco Bonetti, F. Perrot, Daniel Beysens, Yves Garrabos
To cite this version:
Marco Bonetti, F. Perrot, Daniel Beysens, Yves Garrabos. Fast adiabatic heating and temperature
relaxation in near-critical fluids under zero gravity. International Journal of Thermophysics, Springer
Verlag, 1995, 16 (5), pp.1059-1067. �10.1007/BF02081275�. �hal-03211868�
Fast Adiabatic Heating and Temperature Relaxation
in Near-Critical Fluids Under Zero Gravity 1
M. Bonetti, 2'3 F. Perrot, 2 D . Beysens, 2 and Y. Garrabos 4
Heat transport in supercritical CO_, is studied under microgravity conditions. A large temperature and density p region around the critical point is explored (CO2 cells were filled at critical density P=Pc and off-critical densities P = Pc + 0-18pc)- Local heating is obtained by using a small thermistor located in the bulk fluid. Through interferometric observations, a new mechanism of thermalization has been evidenced. Thermal expansion of a warm diffusing boundary layer around the heating thermistor is responsible for rapid adiabatic heating of the bulk fluid through the emission of pressure waves at the border. The scaled thickness of the thermal boundary layer follows a power law. When the heat flow stops, the bulk adiabatic heating instantaneously vanishes and the temperature relaxation inside the thermal boundary layer follows locally a diffusive process.
KEY WORDS: CO_,; critical-point phenomena; thermal diffusion.
1. I N T R O D U C T I O N
Recently, heat thermal equilibration in pure fluids near their critical point has received much attention [1-8]. In such fluids, isothermal compressi- bility diverges near the critical temperature Tc and pressure waves strongly contribute to the heat transport. This mechanism, coined the piston effect (PE), has been detailed in numerical simulations [9]. When a wall of a cell containing a supercritical fluid is instantaneously heated, a thermal boundary layer expands and acts as a piston, thereby generating acoustic ~ Paper presented at the Twelfth Symposium on Thermophysical Properties, June 19-24,
1994, Boulder, Colorado, U.S.A.
2Service de Physique de l'I~tat Condens6, Commissariat fi l'l~.nergie Atomique, Centre d'l~tudes de Saclay, Orme des Merisiers, F-91191 Gif-sur-Yvette Cedex, France.
3 To whom correspondence should be addressed.
4 Laboratoire de Chimie du Solide, Centre National de la Recherche Scientiflque, Universit6 de Bordeaux I, 351 cours de la Lib6ration, F-33405 Talence Cedex, France.
waves which propagate in the bulk. Through the propagation of these com- pression waves, the bulk fluid experiences an adiabatic pressure increase. Adiabatic thermal conversion of the pressure waves gives a spatially uniform temperature increase in the bulk fluid on a time scale comparable to a few acoustics times t s (t~ =
L/c,
where L is a typical dimension of the cell and e is the speed of sound at the cell temperature). This brings abouta speeding-up
of the heat transport, in contrast to thecritical slowing-down
observed in purely diffusive incompressible fluids. As first introduced by Onuki and Ferrell [10], the typical time of the heat transport in the thermal boundary layer is
t~=tD/()'--1)
2. HeretD=LZ/Dt
is the diffusive time, where Dt is the thermal diffusivity and 1,=cp/cv-is
the ratio of the specific heats cp and cv at constant pressure and volume, respectively. The time tc can be understood to be the typical diffusing time for the heat transport through a thermal boundary layer of thickness 6 =L/(?-.1
) into the fluid bulk. Near To, )' diverges and therefore 6 and tc go to 0.We report here quantitative interferometric experiments performed under microgravity conditions when PE is active. Microgravity is essential to avoid convection, which destabilizes the thermal boundary layer around the heating point. The evolution of the thermal boundary layer and the corresponding thermal response of the bulk fluid are investigated in a CO 2 cell when heat is continously released. Different values of density and tem- perature have been studied. The major finding is that the bulk fluid is rapidly heated on a time scale t~ as the thermal boundary layer expands. The layer thickness is seen to scale with 6 and to. Temperature relaxation at the heating point is also measured. This is obtained after a short heat pulse, of time duration of order 0.5 s. The temperature relaxation inside the warm thermal boundary layer follows locally a diffusive process since the PE is no longer active when the heat flow is stopped.
2. E X P E R I M E N T
Sample cells are filled with CO2 (Air Liquide; purity > 9 9 . 9 9 8 % ) at a critical density pr k g - m 3 and at two off-critical densities p = p=_+ 0.18p~, with an accuracy better than 0.1%. The critical temperature and pressure are 304.14 K and 7.37 MPa. These high-pressure cells are made of copper beryllium and are cylindrically shaped with an inner diameter 9 = 11.6 mm and thickness e = 6.8 mm. Two sapphire windows at each end of the cylinder allow interferometric observations. Each cell is positioned in one arm of a T w y m a n n - G r e e n interferometer which is housed on the top of a unit (sample cell unit; SCU) made of electrolytical copper. The SCU is a cylinder of 60-ram outer diameter and 115-ram length whose temperature can be finely controlled to within 5 0 p K over several hours.
Due to the high thermal diffusivity of copper, the thermal time constant of the SCU ( ~ 2 s) is comparable to that of the fluid cell body (from 2 to 20 s). Two identical and nearly spherical thermistors are located in the fluid cell at an equal distance from the sapphire windows. Their diameter is 0.9 mm, with a time constant of 100 ms. The distance between their centers (L, =4.6 mm) is comparable to the distance L2 = 3.5 mm between the thermistor center and the cell walls and to the half-distance between the inner windows (e/2 = 3.4 mm). Only one thermistor (referenced T h l ) is used to heat the fluid for a given period of time. Both thermistors can measure the temperature of the fluid only when the heating is off. Thermistor Th2 measures the temperature of the bulk fluid outside the warm thermal boundary layer. In this way, its temperature depends mainly on the heat transfer by pressure waves due to PE. Thermistor T h l delivers
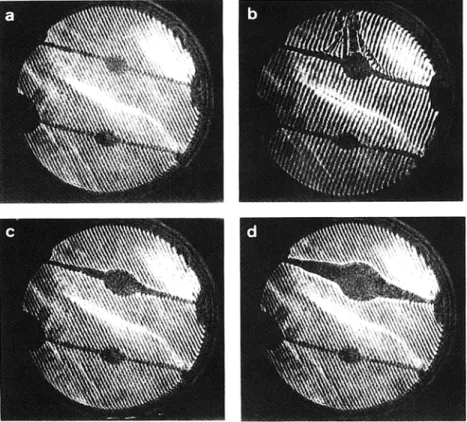
Fig. l. Thermal layer around a heating thermistor (CO 2 at p =Pc). (a) Before heating. View of the cell (ll.6-rmn diameter) with both thermistors (the two spheres). The bright and dark lines are interference fringes. (b) Experiment under Earth gravity ( T = Tc + 16 K), 400 ms after heating has started. (c) Experiments under microgravity ( T = T~ + 16.8 K), t =480 ms after heating has started, (d) Same as c but at t = 2 s.
into the fluid a quantity of heat which depends on the thermistor tem- perature through its calibration curve. In these experiments, the typical delivered power ranges between 12.2 and 80 mW. The bulk temperature relaxation process is part of a separate analysis [ 11 ].
At equilibrium and with a homogeneous density, straight interference fringes were set in the view field (.~40 fringes in the pattern; Fig. la). Density changes in the bulk or at the cells walls result in a refractive index variation and fringes are shifted and/or distorted. Density and refractive index are related through the Lorentz-Lorenz relation [12]. The inter- ference pattern is recorded by a CCD videocamera at 25 Hz.
The maximum temperature acquisition rate is 25 Hz. To reduce the thermal perturbation near Tc in the measuring mode (dissipated power, 3 p W at T = T~ + 16 K), temperature is sampled each 2 s when needed.
3. I N T E R F E R O M E T R I C OBSERVATIONS
3.1. Continuous Heating
On Earth, a convective plume settles, after a few milliseconds, in the fluid and destroys the thermal boundary layer around the heating ther- mistors Thl (Fig. lb). In contrast, under microgravity conditions (g-jitter < 10-4), a nearly spherical shaped thermal boundary layer forms around Thl (Figs. lc and d). This layer appears as a black region where the fringes are not visible. Outside this region, the fringes in the bulk region are not distorted. This means that the fluid density remains homogeneous. Simultaneously, one observes a displacement of the whole fringe pattern in the bulk region. This instantaneous translation of the fringe pattern corresponds to a spatially uniform density change throughout the bulk fluid. This is achieved through propagating compression waves which travel back and forth in the cell and whose characteristic time is related to the acoustic time ts.
3.2. Pulse Heating: Temperature Relaxation of the Boundary Layer
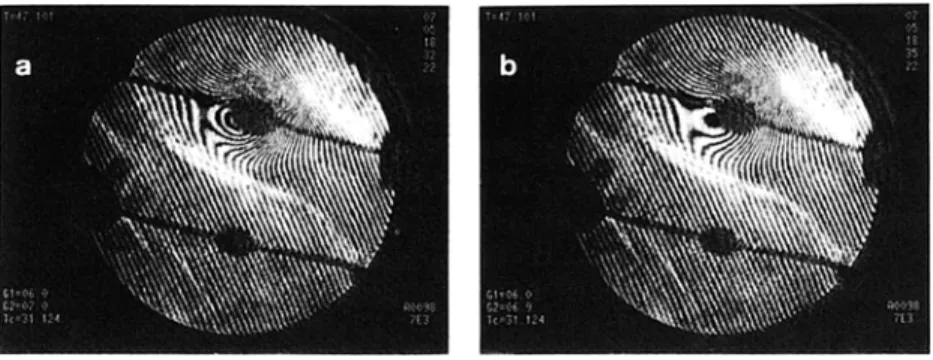
Figures 2a and b show the relaxation mechanism at T c + 15.9 K when the heating has been stopped. Fringes form at the border of the thermal layer with a fringe spacing which increases with time. Figure 2a is taken at
t = 10.5 s after the end of a 480-ms heat pulse, and Fig. 2b at t = 13.5 s. The
same fringe pattern evolution is observed near Tc but the relaxation mechanism is much slower. This suggests that the thermal relaxation in the boundary layer is a diffusing process. In the following, we see that tem- perature relaxation measurements confirm this analysis.
Fig. 2. Thermal relaxation of the boundary layer (CO 2 at p = Pc) after a short heating pulse ( d t = 4 8 0 m s , T = T c+15.9K). (a) At t = 1 0 . 5 s after the end of heating, (b) At t = 1 3 . 5 s . Notice the appearance of curved fringes in the boundary layer and the increasing of the fringe spacing in time.
4. D I S C U S S I O N
After a fast temperature increase at the wall, the bulk temperature should increase within the characteristic time to. The thickness of the thermal b o u n d a r y layer eb should be of the order of ~ as defined previously. In our experiment the layer thickness e b = r b - r t h (with r b the external radius of the layer and rth the radius of the therrnistance) scales with { 6 = ( e / 2 ) [ 1 / ( y - 1 ) ] } when expressed versus the reduced time
t/tc
{tc=(e2/4)(1/Dt)[1/(),-1)z]}.
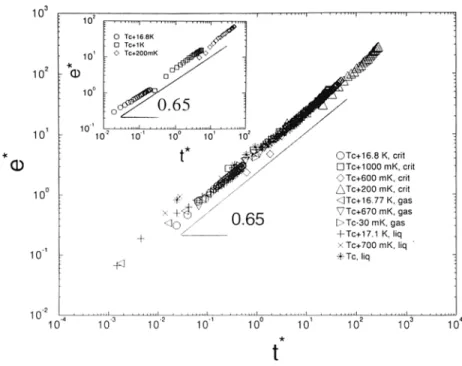
F i g u r e 3 shows a log-log plot of the reduced thickness e* = eb/~ versus the reduced time t* =t/tc
for p = Pc and forp=pe-FO.18pc.
All data obey a power law e*=At *~
where A "~ 5, which is to be c o m p a r e d with the value A = 1.15 given by Onuki et al. [ 10] for the 1-D geometry. N o t e that scaling holds for a thickness e b as large as 1000fi and is valid in the supercritical region. We also report a calculation of the evolution of a purely diffusive layer around a heating sphere in an infinite incompressible medium with constant diffusivity. The same power law holds with the same exponent. Note that the exponent 0.65 corre- sponds to a transient behavior. The classical exponent 0.5 is reached later, as observed in our simulation. F o r example, at critical density p = Pc and T - - - T ~ + 16.8 K, an exponent 0.65 is observed up to ~ 6 0 s and decreases for longer times.The bulk density evolution is measured by means of the fringe shift. The relative density variation
Ap/p
per fringe shift is 0.04%. We have counted the number of fringes which cross a reference line. The local den- sity increase in a fluid of mass M, receiving an energy a m o u n t E, due toFig. 3. Thermal layer expansion during continuous heating: reduced layer thickness e* vs reduced time t* (see text) at various CO2 densities and temperatures. Inset: Calculation of the evolution of the thermal layer thickness in a purely diffusive process at p = pC.
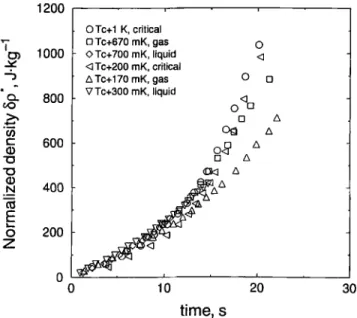
adiabatic heating, is given by 6p = (Op/OT)p [ 1/(y - 1 ) c , , ] ( E / M ) - R ( E / M ) . In Fig. 4, we show the density variations in the bulk normalized to R ( 6 p * = ,~p/R). All curves collapse on one single curve for t < 15 s. The time variation of 6p* is not simple to analyze because of the thermistor self- heating phenomenon, which increases the heating power with time.
A simulation of the fringes pattern shows a striking similarity to the fringe distortion observed in Fig. 2 in the temperature relaxation mode. Figure 5a shows a computed interferometric fringe pattern produced by a 2-D Gaussian distributed inhomogeneity of the refractive index in a medium of constant index. The refractive index value of the central peak taken with respect to the bulk index is 1 0 - 4 . We observe the appearance
of a circular region with a well-defined border. In this region, fringes are distorted and the fringe spacing is smaller than in the bulk region. By decreasing the peak value of the refractive index, the fringe spacing enlarges in the inhomogeneous region while the fringes become less bent. Figure 5b shows the fringes pattern computed for a refractive index peak value of 0.5 x 10⁻⁴. F r o m these simulations, we infer that the black region around
1200 T r 1000 c~ 8 0 0 60 c 6 0 0 o "o " o N 4 0 0 t , - - O 200 Z Fig. 4. OTc+l K, critical O Tc+670 mK, gas 0 Tc+700 mK, liquid Tc+200 inK, critical A TC+170 mK, gas ~7Tc+300 mK, liquid 0 0 10 20 time, s 0 0 o
o%
[] A O0 zx 3 0Normalized density increase ,~p* vs time (see text) at various C O 2 densities and cell temperatures.
Fig. 5. Simulation of the interference fringe pattern: effect of a refractive index inhomogeneity in a uniform refractive index m e d i u m (see text). Notice the same distortion of the fringe pattern as in the experimental case in Fig. 2.
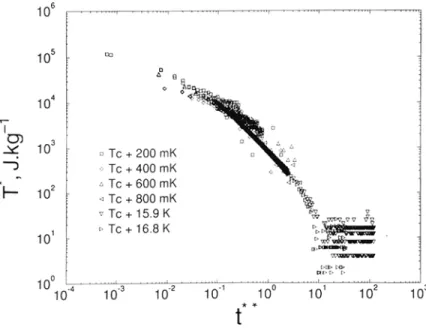
Fig. 6. Reduced temperature relaxation T * = T c r after a short heat pulse
(dr =480 ms) of the thermal boundary layer for various cell temperatures, at CO_, critical density, vs reduced time t * * = t/tD.
the heating point is a region with high refractive index gradients--and hence density gradients--where the fringe visibility is strongly reduced. We have also deduced that the border of the thermal layer corresponds to a density inhomogeneity of order 1%.
The temperature relaxation of the heating thermistor has been measured after a heat pulse of duration 480 ms. Figure 6 shows a log-log plot of the reduced temperature T* as a function of the reduced time t** at different cell temperatures from To+ 16.8 K down to 200mK and for the critical density. Time is expressed as units of the diffusing time
/ D = ( e b . . . . )Z/Dr, where eb.ma x is the largest boundary layer thickness measured after the heating has stopped. Temperature is multiplied by Cp, thus defining a reduced temperature T* with dimension in J. kg -I, which represents the energy density contained in the thermal boundary layer. All data collapse on a single curve. This confirms that the heat transport--in the relaxation mode--follows locally a diffusive process.
5. CONCLUSION
We have shown that when a permanent heat flow is released in a compressible fluid, an expandable thermal layer forms at the heating point.
T h e t h i c k n e s s o f the t h e r m a l l a y e r follows a p o w e r law u n d e r p r o p e r scaled time ( c h a r a c t e r i s t i c P E time, t~) a n d s c a l e d s p a c e ( c h a r a c t e r i s t i c b o u n d a r y layer thickness, ~). A u n i f o r m d e n s i t y - - h e n c e t e m p e r a t u r e - - i n c r e a s e in the b u l k is o b s e r v e d c o r r e s p o n d i n g to p r e s s u r e waves p r o p a g a t i n g in the fluid. This is the s i g n a t u r e o f the p i s t o n effect.
W h e n the h e a t flow is s t o p p e d , we h a v e also o b s e r v e d t h a t the t e m p e r a t u r e at the c o r e o f the t h e r m a l l a y e r relaxes following a diffusive process.
A C K N O W L E D G M E N T S
T h i s w o r k was s u p p o r t e d b y the C N E S ( C e n t r e N a t i o n a l d'l~tudes S p a t i a l e s ) . T h e e x p e r i m e n t s were p e r f o r m e d in 1992 in the l a b o r a t o r y A L I C E [-14] o n b o a r d the o r b i t a l s t a t i o n M I R ( A N T A R E S m i s s i o n ) . W e a r e p a r t i c u l a r l y i n d e b t e d to P. K o u t s i k i d ~ s a n d J. M. L a h e r r ~ r e f r o m the A L I C E project.
R E F E R E N C E S
1. J. V. Sengers, in Critical Phenomena, Proc. bit. School "Em'ico Fermi," Course LI, M. S.
Green, ed. (Academic Press, New York, 1971 ), p. 445.
2. A. M. Radhwan and D. R. Kassoy, J. Eng. Math. 18:133 (1984).
3. K. Nitsche and J. Straub, Naturwissenschaffen 73:370 (1986).
4. R. P. Behringer, A. Onuki, and H. Meyer, J. Low Temp. Phys. 81:71 (1990).
5. H. Boukari, M. E. Briggs, J. N. Shaumeyer, and R. W. Gammon, Phys. Rev. Lett. 65:2654
(1990).
6. H. Klein, G. Schmitz, and D. Woermann, Phys. Rev. A 43:4562 (1991).
7. P. Guenoun, B. Khalil, D. Beysens, Y. Garrabos, F. Kammoun, B. Le Neindre, and
B. Zappoli, Phys. Rev. E 47:1531 (1993).
8. M. Bonetti, F. Perrot, D. Beysens, and Y. Garrabos, Phys. Reo. E 49:4779 (1994).
9. B. Zappoli, D. Bailly, Y. Garrabos, B. Le Neindre, P. Guenoun, and D. Beysens, Phys.
Rev. A 41:2264 (1990).
10. A. Onuki and R. A. Ferrell, Physica A 164"245 (1990); A. Onuki, H. Hao, and R. A.
Ferrell, Phys. Rev. A 41:2256 (1990).
11. Y. Garrabos, M. Bonetti, D. Beysens, F. Perrot, T. Frohlich, P. Carl~s, and B. Zappoli, (submitted).
12. M. Born and E. Wolf, Principles of Optics, 6th ed. (Pergamon Press, New-York, 1980}.
13. H. S. Carslaw and J. C. Jaeger, Conduction of Heat hl Solids, 2nd ed. (Oxford University
Press, London, 1959).