HAL Id: cea-02442351
https://hal-cea.archives-ouvertes.fr/cea-02442351
Submitted on 16 Jan 2020HAL is a multi-disciplinary open access
archive for the deposit and dissemination of sci-entific research documents, whether they are pub-lished or not. The documents may come from teaching and research institutions in France or abroad, or from public or private research centers.
L’archive ouverte pluridisciplinaire HAL, est destinée au dépôt et à la diffusion de documents scientifiques de niveau recherche, publiés ou non, émanant des établissements d’enseignement et de recherche français ou étrangers, des laboratoires publics ou privés.
Optical pyrometry measurement on oxidized zirconium
alloy nuclear material cladding
B. Bouvry, L. Ramiandrisoa, C. Cheymol, C. Gallou, H. Maskrot, C.
Destouches, L. Ferry, C. Gonnier, T. Duvaut, N. Horny
To cite this version:
B. Bouvry, L. Ramiandrisoa, C. Cheymol, C. Gallou, H. Maskrot, et al.. Optical pyrometry mea-surement on oxidized zirconium alloy nuclear material cladding. 7th European Thermal-Sciences Conference, Jun 2016, Cracovie, Poland. �cea-02442351�
Optical pyrometry measurement on oxidized zirconium alloy
nuclear material cladding
B Bouvry1*, L Ramiandrisoa1,C Cheymol1, C Gallou1, H Maskrot1, C Destouches2,
L Ferry3, C Gonnier4, T Duvaut5, N Horny5
1CEA Saclay, DEN/DANS/DPC/SEARS/LISL, F-91191 Gif-sur-Yvette - France 2CEA Cadarache, DEN/CAD/DER/SPEX/LDCI, F-13108, St-Paul-lez-Durance – France
3CEA Cadarache, DEN/CAD/DER/SRJH/LEDI, F-13108, St-Paul-lez-Durance - France 4CEA Cadarache, DEN/CAD/DER/SRJH, F-13108, St-Paul-lez-Durance – France 5 GRESPI, Université de Reims Champagne Ardenne, Campus Moulin de la Housse,
51100 Reims, France *[email protected]
Abstract
In order to improve the safety of nuclear power plant, loss-of-coolant accident experiments are implemented in research reactor. In this framework, we develop an optical pyrometry device to measure surface temperature (700-1200°C) of Zircaloy cladding without contact. The whole set-up of the simplified device (under air, without radiation) and the measurement procedure including data treatment based on bichromatic pyrometry are presented, as well as results for various temperature levels. Temperature retrieval based on the hypothesis of emissivity ratio equal to a constant, is scanned over a large wavelength range. A constant surface temperature is obtained on the spectral range of measurement, confirming the relevancy of emissivity hypothesis. Differences between this non-contact temperature measurement and a complementary thermocouple temperature measurement are also discussed.
1. Introduction
Current energy needs of industrial and developing countries, combined with a strong increase of global warming induced by greenhouse gases like CO2 or N2O, leads to develop carbon-free energies. In this perspective, nuclear power is an important option, which needs research in term of recycling or security process. One of the most accidental scenario considered in nuclear power plant design is the LOCA (Loss Of Coolant Accident) which implies a large break on the primary circuit and a violent pressure decrease (from about 150 bars to few bars)[1]. This dewatering makes the fuel clads overheat (up to 1200°C). The oxidation by steam at high temperature weakens clads which can burst and release fission products into the nuclear reactor.
To simulate the LOCA, the Light-water One Rod Equipment for Loca Experimental Investigations (LORELEI) test device will be implemented on the Jules Horowitz reactor of CEA. The aim is mainly to test Zircaloy-4 claddings behavior in hard environment where steam oxidation is enhanced by high
temperatures (from 700 up to 1200°C) [2]. A traditional temperature measurement by thermocouples is not accepted because it would create a cold point on the clad that generates a modification of burst conditions. This leads to design a non-contact real time (1Hz) measurement suited to these extreme conditions (high temperature, nuclear radiations and steam environment) and with an uncertainty about ±10°C.
In a first step, an optical pyrometry device is then developed to measure the surface temperature of Zircaloy cladding without contact, under air, without steam nor radiation. The aim is to test the measurement capability of optical pyrometry and study the emissivity property of cladding without additional perturbation. Thermocouples will be used on this experimental device to give a temperature reference.
2. Experiment
1.1. Zircaloy cladding
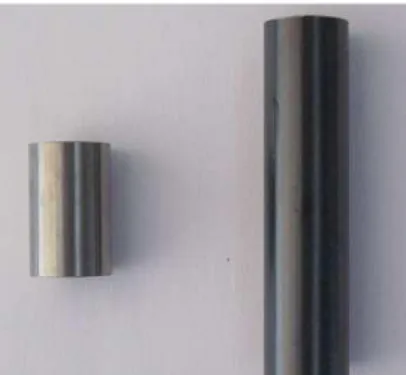
In nuclear reactor, pellet of nuclear material is inserted in a Zircaloy-4 clad and integrated inside heart of nuclear reactor. The visual aspect of a new clad is metallic color. Shortly, a thin layer of black color oxide covers the clad, this layer grows up to around a hundred of microns at the end of the life time of the fuel in the reactor core. So, we use an experimental facility named EDGAR 2 located in CEA Saclay research center to oxidize clad in air/steam environment at high temperature. The clad used in this study was oxidized at a temperature of 1100°C for 100s. Figure 1 exhibits both new Zircaloy clad and oxidized clad used on pyrometry device.
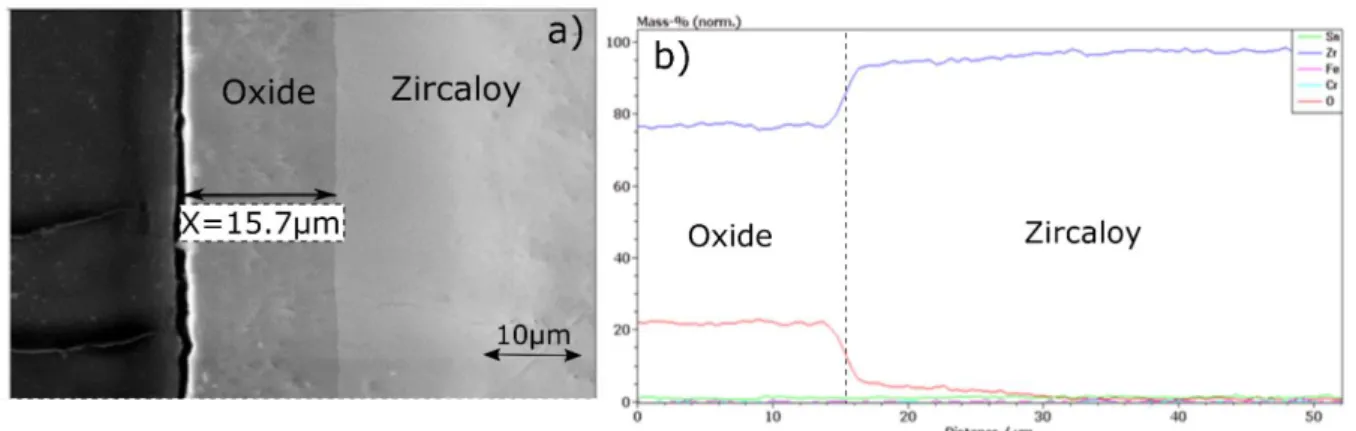
Figure 1: left: new Zircaloy-4 clad; right: oxidized clad with thin layer of black color oxide. Scanning Electron Microscopy (SEM) picture and Energy Dispersive Spectroscopy (EDS) measurement, presented in Figure 2, show the oxide layer, with thickness of about 15.7 µm, on the Zircaloy surface. This thickness is confirmed by the decrease of oxygen rate (bottom line with red color on Figure 2b) and the increase of zirconium rate from 76 to about 95% (top line with blue coloer on Figure 2b) in the volume of oxide layer compared to the rates deeper in the clad.
The EDS analysis reveals that the oxide is only composed by Zirconium and Oxygen elements, which induces that oxide has a chemical composition close to zirconia material (ZrO2). Nevertheless, the black color aspect of the oxide (cf. Figure 1) implies that a non-stoichiometric zirconium oxide was created on the Zircaloy surface.
Figure 2: a) SEM picture of pre-oxide Zircaloy cladding and b) EDS measurement (from outside surface of oxide to the depth of clad). Black layer on the left part of Figure 2a) corresponds to the
resin coating sample used for SEM measurement.
1.2. Optical pyrometry set-up
This optical pyrometry method is based on the comparison between the radiance emitted by the sample and by a heat source with known temperature and emissivity (ε), generally a black body (ε ~1) used as reference. The reference thermal source is a cylindrical black body furnace (HGH RCN1200N1) working up to a temperature of 1200°C, with an aperture of 12.5 mm.
An objective (made of two converging lens), collecting thermal radiation at about 10 cm from heat source or surface sample on an analysis area with a diameter of about 2 mm, is located first in front of the heat source. This set of lens focuses thermal flux emitted by the center of the aperture, on the end face of an optical fiber. We use an optical fiber in the pyrometry set-up to carry the optical power to the detector as in the future set-up in the research reactor. On the LORELEI device the fiber will be a pure silica core (or slightly doped silica core) fiber in order to limit the attenuation due to radiations, the optimum spectral range will be then: 0.9-1.8 µm [3]. The infrared spectrometer used on the pyrometry device is an Ocean Optics NIRquest 512. The photodiode detector allows measurement in a spectral range from 0.9 µm to 1.7 µm with a resolution of about 1.5 nm.
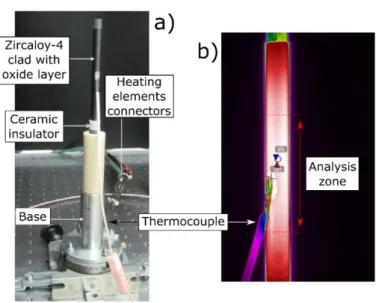
Figure 3.a) presents a picture of the heating sample holder, developed for this study, fitting by the cladding sample. The holder has a cylindrical shape and allows heating up to about 1000°C. Figure 3.b) presents a thermography picture of the Zircaloy cladding equipped with a welded thermocouple. The analysis area for pyrometry measurement, as well the thermocouple location, can be observe on this figure. This preliminary observation made by a bolometric infrared camera (FLIR systems, SC655 LS), working on the spectral range 7-12 µm, allows us to assess the temperature homogeneity on the sample. The thermocouple is placed 1 cm below the pyrometry measurement area. To improve the grip of the thermocouple on the surface, oxide is withdrawn by polishing and thermocouple wires are welded on the surface of zirconium alloy.
Figure 3: a) Description of sample holder and b) thermography picture, obtained by an infrared camera, for a temperature level: 805°C, showing analysis zone for pyrometry measurement.
1.3. Experimental procedure
Figure 4 presents a diagram of the final pyrometry set-up where sample holder, black body, objective, infrared spectrometer and optical fibre are shown.
Figure 4: Diagram of pyrometry device for surface temperature measurement of Zircaloy-4 cladding and picture of black body furnace used like reference.
In this paper, the surface temperature of Zircaloy cladding will be presented for two temperatures of sample holder: 805°C and 905°C. The first step of the measurement procedure, the calibration, consists in collecting the power from the black body. The temperature of this source is chosen so that it emits power close to those emitted by the sample to study. In our procedure, four temperatures are used for calibration. So, black body is heated from 710 to 740°C, with a step of 10°C, and from 820 to 850°C, also with a step of 10°C, for sample holder temperature of 805 and 905°C, respectively. The (optical)
power from the black body is measured for each temperature by the infrared spectrometer (result in “number of counts”). For each wavelength, the result is plotted as a function of the radiance, deduced from Planck’s law. The linear regression obtained with the 4 points is the transfer function. Each wavelength has its own transfer function.
In a second step of procedure, the measuring device (lens, optical fibre and spectrometer) is translated in front of the cladding. Distance between lens and cladding is identical to those used for measurement on black body furnace.
The integrating times of the NIRquest 512 array detector vary with the aimed sample temperature and must be the same for sample measurement and calibration. For this study, 102 ms and 52 ms are selected for sample holder temperature of 805°C and 905°C, respectively. The integrating time of the spectrometer is set so that it works as much as possible on the linear range of the detector. Power from surface cladding is measured by the infrared spectrometer and is converting into radiance spectrum thanks to the transfer function.
1.4. Temperature retrieved by bichromatic method
Several pyrometry techniques may be applied to retrieve the temperature [4]. We focus here on the bichromatic method based on the hypothesis of known emissivity ratio between two wavelengths. Using Wien approximation, valid on the spectral range of measurement, the temperature can be retrieved as shown in (1). 1 𝑇= 𝜆1∗ 𝜆2 𝜆1− 𝜆2∗ 1 𝐶2∗ ln ( 𝑓−1(𝑆 1) 𝑓−1(𝑆 2)∗ 𝜀2 𝜀1∗ ( 𝜆1 𝜆2) 5 ) (1)
With 𝑓, the transfer function of spectrometer, calculated from black body calibration, and, 𝑓−1(𝑆 1) and
𝑓−1(𝑆
2), the radiance calculated from signal 𝑆1 received at wavelength 𝜆1 and signal 𝑆2 received at
wavelength 𝜆2, respectively The values ε1 and ε2 are the emissivity at λ1 at λ2, respectively.
Based on the hypothesis of the emissivity ratio 𝜀2⁄ = 1, temperature is retrieved for each couple (λ𝜀1 1, λ2) selected in the spectral range considered. Several interval values λ2-λ1 (50, 100, 150, 200 and 250 nm) are taken into account on calculation. A mean temperature value is calculated as well as the standard deviation.
3. Results and discussion
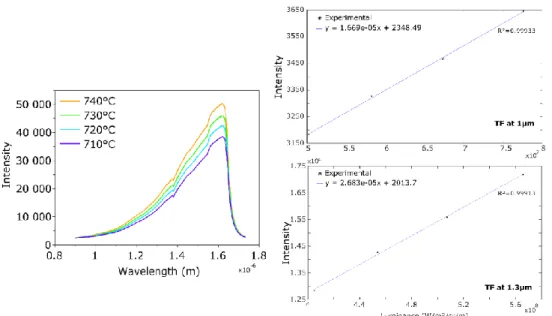
The experimental procedure, described in the previous part, is used to measure the power from black body, in order to calculate the transfer function. Figure 5 presents intensity spectra measured on black body, for different temperatures (710, 720, 730 and 740°C). We can observe on Figure 5 (left) a depletion around 1.38 µm. This depletion is due to absorption bands of water vapour, present in atmosphere [5, 6]. As the vapour concentration may fluctuate between calibration and sample measurements, the spectral range 1.3-1.45µm is removed. Figure 5 (right) presents also transfer functions calculated for two wavelengths (1 µm and 1.3 µm).
Figure 5: left: intensity spectra from black body for temperatures from 710 to 740°C; right: transfer functions calculated at 1µm and 1.3 µm.
Figure 6 shows a scanned bichromatic temperature calculation, in the spectral range from 1.0 µm to 1.3 µm, for sample holder temperature (TSH) : 805°C and 905°C as well as the temperature measured by thermocouples (TTC), located on the Zircaloy cladding surface, for each temperature level. Each point is the result of a bichromatic calculation for a wavelength couple. For example, the last point of the curve for a gap of 50 nm, corresponds to a calculation with λ1=1.25 µm and λ2=1.3 µm.
Figure 6: Scanned bichromatic temperature as function of the wavelength λ1,with calculation made
for several gaps (from 50 to 250nm) and both λ1 and λ2 included in the wavelength range: 1-1.3 µm,
for two sample heater temperatures (TSH):805°C and 905°C, with an emissivity ratio
The rather constant value of the temperature, for each experiment and wavelength gap presented on Figure 6, allows us to calculate a mean temperature, as well as the associated standard deviation. Table 1 gathers the thermocouple temperature and the mean of scanned bichromatic temperatures. All gaps of wavelengths lead to similar mean bichromatic temperature values for the two temperatures: 805 and 905°C. As shown in Figure 6, there is a strong fluctuation of the bichromatic temperature for the interval of 50 nm, confirmed by the highest value of the standard deviation of about 5.7°C (cf. Table 1). These temperature fluctuations decrease with the increase of the wavelength interval, as expected with non-correlated fluctuation of the radiance [4].
Table 1: Thermocouple temperature (TTC) and bichromatic temperatures (hypothesis: 𝜀2⁄ = 1) for 𝜀1 wavelength intervals from 50 to 250 nm and a step of 50 nm, obtained for two heater set points (TSH):
805 °C and 905°C, and the standard deviation. TSH (°C) TTC (°C)
Bichromatic temperatures (°C)
T50nm T100nm T150nm T200nm T250nm 805 727 ± 1.6 745.2 ± 5.7 745.2 ± 3.2 745.2 ± 2.1 745 ± 2.1 744.4 ± 2.2 905 813.9 ± 2.5 832 ± 5.6 831.7 ± 3.1 831.8 ± 2.3 831.7 ± 1.9 832 ± 2.1
By the knowledge of temperature and radiance, one can deduce an emissivity value of cladding around 0.9, constant on the spectral range and close to the value present in literature [7]. However, are these temperature and emissivity retrieve the true ones? Indeed, others profiles of ε(λ) can also lead to constant profile. For example, bichromatic temperatures, for a gap of 100 nm and calculated for an emissivity ratio 𝜀2⁄ = 1.005 and 𝜀𝜀1 2⁄ = 0.995, corresponding to exponential emissivity profiles, are presented 𝜀1
in Figure 7. They also lead to a constant profile, with mean temperatures 837.3°C and 826.2°C, respectively.
Figure 7: Scanned bichromatic temperatures as function of the wavelength λ1, calculation made for a
gap of 100 nm for a sample heater temperature of 905°C, with an emissivity ratio of 1.005 (green) and 0.995 (blue).
Uncertainty about the real surface temperature value, when the emissivity profile is unknown, is the reason why a reference measurement by thermocouple was expected. However, we can observe a
temperature difference of about 18°C between pyrometry temperatures and thermocouple values for the two temperatures levels (cf. Table 1). This discrepancy is not entirely due to the error of optical pyrometry measurement. Indeed, a temperature measurement by contact can lead to a heat lost due to a temperature gradient inside thermocouple wires and can create a cold point on the cladding surface. Gradient issues prevent accurate measurement of the surface temperature by thermocouples, and make difficult the comparison of optical pyrometry result with a reference measurement.
4. Conclusions
A non-contact temperature measurement is preferred rather thermocouple for the LORELEI test device because it will not disturb the burst conditions of the cladding. In this context, a simplified optical pyrometry set-up has been developed to test the temperature surface measurement capability of optical pyrometry on Zircaloy-4 cladding and study emissivity property of cladding under air without radiation. The whole set-up and the experimental procedure have been presented as well as the retrieval of temperature based on an extended bichromatic method. The hypothesis of an emissivity ratio equal to 1 appears to be relevant for both temperatures of sample heater: 805°C and 905°C. But, other emissivity ratio, close to 1 and corresponding to a little variation of ε(λ) also lead to relevant temperatures values with this method. One perspective of this study is a comparison of bichromatic results with those calculated by others pyrometry methods like monochromatic or polychromatic technics. This last method should allow us determining the true temperature and emissivity profile by a study of “residues” after minimization process. A miniaturization of optical pyrometry set-up is also expected for an introduction into LORELEI device.
Acknowledgment
The authors are indebted to Ms. Lezaud-Chaillioux and Vandenberghe, and Mr. Hellouin de menibus for providing cladding sample as well as Ms. Blanc and Mr. Varlet for the SEM and EDS characterization.
References
[1] H.M. Chung, Fuel behavior under loss-of-coolant accident situations, Nuclear Engineering and Technology, 37 (2005) 327-362.
[2] J.H. Baek, Y.H. Jeong, Steam oxidation of Zr-1.5Nb-0.4Sn-0.2Fe-0.1Cr and Zircaloy-4 at 900-1200°C, Journal of Nuclear Materials, 361 (2007) 30-40.
[3] G. Cheymol, H. Long, J.F. Villard, B. Brichard, High Level Gamma and Neutron Irradiation of Silica Optical Fibers in CEA OSIRIS Nuclear Reactor IEEE Transactions on Nuclear Science, 55 (2008) 2252-2258.
[4] L. Ramiandrisoa, G. Cheymol, N. Horny, D. T., Pyrometry Techniques for Temperature Monitoring in Simulated LOCA (Jules Horowitz Reactor), in: ANIMMA, Marseille, 2013.
[5] T. Yamanouchi, M. Tanaka, Absoprtion properties of the near-infrared water vapor bands, Journal of Quantitative Spectroscopy & Radiative Transfer, 34 (1985) 463-472.
[6] K.M. Smith, I. Ptashnik, D.A. Newnham, K.P. Shine, Absorption by water vapour in the 1 to 2 µm region, Journal of Quantitative Spectroscopy & Radiative Transfer, 83 (2004) 735-749.
[7] E. Sani, L. Mercatelli, J.-L. Sans, D. Diletta Sciti, Optical properties of black and white ZrO2 for solar receiver applications, Solar Energy Materials & Solar Cells, 140 (2015) 477-482.