HAL Id: hal-02982310
https://hal-amu.archives-ouvertes.fr/hal-02982310
Submitted on 28 Oct 2020
HAL is a multi-disciplinary open access
archive for the deposit and dissemination of
sci-entific research documents, whether they are
pub-lished or not. The documents may come from
teaching and research institutions in France or
abroad, or from public or private research centers.
L’archive ouverte pluridisciplinaire HAL, est
destinée au dépôt et à la diffusion de documents
scientifiques de niveau recherche, publiés ou non,
émanant des établissements d’enseignement et de
recherche français ou étrangers, des laboratoires
publics ou privés.
Distributed under a Creative Commons Attribution| 4.0 International License
Exploring phase contrast imaging with a laser-based K α
x-ray source up to relativistic laser intensity
O. Utéza, A. Ferré, M. Gambari, R. Clady, A. Stolidi, M. Sentis, & Ferré
To cite this version:
O. Utéza, A. Ferré, M. Gambari, R. Clady, A. Stolidi, et al.. Exploring phase contrast imaging with
a laser-based K α x-ray source up to relativistic laser intensity. Scientific Reports, Nature Publishing
Group, 2020, 10 (1), �10.1038/s41598-020-63614-3�. �hal-02982310�
www.nature.com/scientificreports
exploring phase contrast imaging
with a laser-based K
α
x-ray source
up to relativistic laser intensity
M. Gambari
1✉, R. clady
1, A. Stolidi
2, o. Utéza
1, M. Sentis
1& A. ferré
1this study explores the ability of a hard Kα x-ray source (17.48 keV) produced by a 10 TW class laser
system operated at high temporal contrast ratio and high repetition rate for phase contrast imaging. For demonstration, a parametric study based on a known object (PET films) shows clear evidence of feasibility of phase contrast imaging over a large range of laser intensity on target (from ~1017 W/cm2
to 7.0 × 10¹⁸ W/cm2). To highlight this result, a comparison of raw phase contrast and retrieved phase
images of a biological object (a wasp) is done at different laser intensities below the relativistic intensity regime and up to 1.3 × 10¹⁹ W/cm2. this brings out attractive imaging strategies by selecting suitable
laser intensity for optimizing either high spatial resolution and high quality of image or short acquisition time.
The interest of developing new x-ray sources and/or improving their performances in terms of brightness, sta-bility, and compactness is still growing since decades. This is strongly motivated by applications of x-ray sources for imaging and related applied developments to biology, medicine and material science. In particular, the advent of synchrotron radiation sources in the seventies as well as the development of optical components for x-rays, definitively allowed to transfer the phase contrast imaging (PCI) techniques from the visible spectral range to the x-ray one. Phase contrast x-ray imaging is sensitive to phase shift induced by an object placed in the x-ray path and does not rely on its absorption. Thus, it can image weakly absorbing materials, such as carbon-based materi-als and biological objects. In addition, it should be noted that the sensitivity of absorption contrast decreases as the photon energy (E) increases1 as E–3, whereas that of phase contrast methods decreases only as E–2. Therefore,
phase contrast methods are more sensitive at high photon energies (E = 10 to 100 keV), compared to absorption methods. In that case, for comparable image quality, the absorbed x-ray dose is smaller than with conventional radiography. Challenges addressed by hard x-ray PCI are numerous such as the detection of complex damages in composite materials2–4 or of the apparition of microcalcifications around a hundred micrometers of diameter at an early stage of breast cancer5–7.
X-ray sources with high spatial coherence and photon flux required for PCI8 are a difficult technological realization. On one hand, conventional microfocus9–11 and liquid-metal-jet12 x-ray tubes are very compact and inexpensive sources. Even if liquid-metal-jet x-ray tubes tend to increase their photon flux, both sources are con-tinuous excluding time-resolved studies. On the other hand, synchrotrons13–16 offer today the highest brightness available and are suitable for imaging applications. However, they are very large infrastructures with limited access, high cost and currently not scalable to civil environment such as hospitals. Between these two alternatives, ultrafast x-ray laser plasma sources appear as good candidates for PCI at a laboratory scale. Among them, x-ray sources provided by laser plasma acceleration such as Betatron17–23 and inverse Compton scattering24–27 offer potential alternatives thanks to their high brightness and very small source size, making possible the acquisition of an x-ray image in single shot mode. However, they are until now based on laser driven systems with high peak power (>30 TW)23 difficult to scale up to high repetition rate. Moreover, these sources provide collimated x-ray beams at low divergence limiting the field of view. In this context, an attractive solution is the Kα x-ray table-top
source driven by femtosecond laser systems28,29.
Hard Kα x-ray source is generated by interaction between an intense femtosecond laser pulse (I ≥ 1016 W/cm2)
with a high Z solid target. The spectrum is composed of a large x-ray Bremsstrahlung emission, dominated by Kα
line (up to ~50%)30,31, characteristic of the solid target material. In addition, it is spectrally tunable by changing the target material. This can give access to high energetic Kα photons (>20 keV) for high Z material like silver,
tantalum or tungsten, difficult to reach by other kind of x-ray sources while combining a high flux. Finally, this
1Aix Marseille Université, CNRS, LP3, 13288, Marseille, France. 2CEA, LIST, Department of Imaging and Simulation
for Non-Destructive Testing, F-91191, Gif-sur-Yvette, France. ✉e-mail: [email protected]
open
www.nature.com/scientificreports
www.nature.com/scientificreports/
source also has a pulse duration below one picosecond32, suitable to perform time-resolved applications. With the new advanced driving laser sources, brightness comparable to the 3rd generation of synchrotrons has been
demonstrated29,30. Previous studies have shown the capacity of this source for PCI using the method of in-line or propagation-based phase contrast imaging (PBI)31,33,34 for biological samples30,35–39, for shock wave characteriza-tion in the context of fusion plasma40, or for material characterization at submicron scale41. These demonstrations have been mainly performed with low or kHz repetition rate laser systems for a fixed laser intensity without inves-tigating the impact of this parameter on the PCI feasibility. Therefore, in this manuscript, a parametric PCI study with the PBI method is performed to show the capabilities of Kα x-ray laser plasma source on a large range of laser
intensity. Experimental demonstration is done for a reference low absorbing sample made of PET (polyethylene terephthalate, a carbon-based material) films of different thicknesses and for a wasp as an example of a biological sample. For the first time, PCI study including retrieved phase images is realized at a very high laser intensity regime on target (up to ~1019 W/cm2) with 100 Hz laser repetition rate. The study highlights that it is possible
to obtain a retrieved phase image with a noticeable reduction of acquisition time even at very high driving laser intensity. The counterpart is a degradation of image quality because of the enlargement of the x-ray source size. Such advance paves the way for future applications where the acquisition time is a crucial parameter.
A unique laser system for exploring phase contrast imaging.
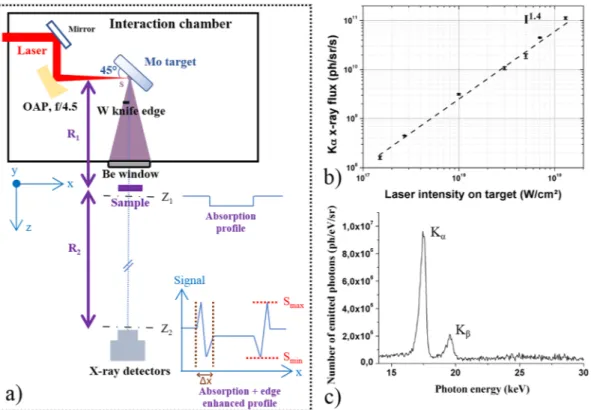
To evaluate the interest of Kα x-raysources generated with ultrahigh laser intensity for fast PCI applications, we perform the experiments with the 100 Hz, 10-TW, 800 nm laser beamline42 of ASUR facility, a unique laser combining high average and high peak power. The p-polarized laser beam of ~25 fs pulse duration is focused on a molybdenum (Mo, EKα = 17.48 keV)
thick target at an angle of incidence of 45° with an off-axis parabola (Fig. 1a). More details on the target surface can be found elsewhere29. The focal spot diameter is ~6 µm (FWHM) with the encircled energy at FWHM meas-ured at ~34%, and the maximum energy of ~130 mJ is delivered on target. Considering the real 2D beam profile, it corresponds to a maximum peak intensity of 1.3 × 10¹⁹ W/cm2. The present study is done with a high temporal
intensity contrast ratio (ICR) laser pulse29 ~1010 which is beneficial to produce a high x-ray flux43 and at the same time a small x-ray source size44. Since x-ray flux and source size are critical parameters to enhance PCI, they are thoroughly characterized for all of these studies and investigated by varying the laser intensity in a large range (from ~1017 to 1.3 × 10¹⁹ W/cm2, see Fig. 1b). An example of a measured x-ray spectrum, thanks to a direct-
detection back illuminated CCD camera, is shown in Fig. 1c.
Figure 1. (a) Experimental setup. A knife edge made of tungsten is positioned between the Mo target and the
detector, at Rknife = 6 cm from the x-ray source, to measure the effective x-ray source size (see Methods). The
interaction chamber is under a residual pressure of ~10−4 mbar and equipped with a beryllium window of
800 µm thickness. The imaged sample is located at R1 = 32 cm from the x-ray source. The x-ray detector is placed
at R2 = 60 cm or 90 cm from the sample. (b) Kα x-ray flux versus laser intensity on target. Dots correspond to the
experimental points which are an average of at least three measurements of the x-ray flux. The error bars are the standard deviation of these measurements. A power law dependence (dot line) between laser intensity and Kα
x-ray flux, NKα∝ Iε is also shown, with ε = 1.4 in accordance with our previous study29. (c) Example of Mo Kα
www.nature.com/scientificreports
www.nature.com/scientificreports/
For PCI evaluation, an experimental setup (Fig. 1a) is developed, based on the PBI method. This method does not require optics45, ensuring simplicity and preserving enough photon flux on the detector. A sample with a refractive index n = 1 − δ + iβ with δ and β the real and imaginary parts respectively, is introduced in the x-ray path at the distances R1 from the source and R2 from the detector. The phase shift φ introduced by the x-ray wave
travelling through the object compared to a non-scattered wave results from the variation of δ. Quantitatively, the recorded intensity profile S(x, y, z) by the detector is described by the simplified transport of intensity equation for a weak absorbing object and unit-amplitude plane wave illumination46 S(x, y, z) ≈ + ∇ φ
π
λ
⊥
( )
x y1 2z 2 , , 0 with λ the wavelength and z the propagation distance. This method enhances visualization of sample contours, optical index transition or abrupt thickness variation of low absorbing objects thanks to the detected phase curvature
φ
∇⊥2 . To evaluate the phase information contained in this equation, the parameter Cedge is defined as28,30
×
−
+ 100%
S S
Smaxmax Sminmin where Smin and Smax correspond to the minimum and maximum intensities of the detected edge
enhanced contrast (Fig. 1a). To maximize Cedge (%) a high spatial coherence length10 =L⊥ λsR1 of the x-ray source
is required. Thus, a small x-ray source size s is necessary. Otherwise, only an absorption image, related to β, can be acquired with enough accuracy (Fig. 1a). In addition, the diffraction of the x-rays induced by the object has to be considered from the object exit to the detector. Indeed, enough propagation distance z from the sample to the detector is desirable in order to be sensitive to the phase changes. For this reason, a parameter called shearing length47 L
s = λR uM2 is introduced, where M = R1R+R2
1 is the magnification and u the spatial frequency component
of the object. The latter is determined from the experimental estimation of the edge contrast signal spreading Δx (see Fig. 1a); u = Δ1
2 x is expressed in line pair per millimeter. This parameter takes into account the Fresnel
dif-fraction until the measurement plane, so the contribution of the sample itself and the resolution of the detector. If the ratio Ls/L ≪ 1, the wavefront is almost fully coherent over the shearing length, and the phase curvature ⊥
associated with the structure component is visible. Otherwise, if Ls/L⊥≫ 1, the wavefront is incoherent over the
shearing length, and the phase curvature associated with the structure component is invisible.
Results and Discussion
impact of laser intensity on c
edgevalues.
To highlight the feasibility of laser-produced plasma Kα x-raysources for PCI in a wide range of x-ray flux and source size, a parametric study is performed on PET (C10H8O4)
films by measuring Cedge as a function of laser intensity. PET real and imaginary parts of the refractive index are
respectively48 δ = 9.8 × 10⁻⁷ and β = 5.3 × 10⁻¹⁰ at
α
EK = 17.48 keV. The ratio δ/β, equal to ~1.8 × 10³, is highly
favorable for phase contrast imaging. The sample is made of different PET thicknesses (75 µm, 100 µm and 175 µm) to evaluate the applicability of the PBI method to image thin objects. The sample is placed at R1 = 32 cm
from the x-ray source and the detector at R2 = 60 cm from the sample (Fig. 1a). The study of the evolution of Cedge
and of the effective x-ray source size is presented in Fig. 2 as a function of laser intensity from 1.5 × 10¹⁷ to 7.0 ×
1018 W/cm2. The increase of laser intensity on target induces an enlargement of the x-ray source size (s ∝ Iγ with
γ = 0.32) as discussed previously28,29,49. Thanks to the high temporal intensity contrast ratio of the laser pulse (~1010) and the good pointing stability (less than 1 µm displacement for a focused diameter of 6.2 µm at 1/e2) of
the laser source associated with a precise targetry positioning system29, this increase is limited to a factor ~3.5 (11 µm ≤ s ≤ 38 µm). Since the number of produced x-ray photons varies with laser intensity (Fig. 1b), the number of shots for each image acquisition is adjusted (from 20 000 for the lowest laser intensity to 400 for the highest) in
Figure 2. Evolution of Cedge and effective x-ray vertical source size as a function of laser intensity on target, for
three different thicknesses of PET films (75 µm, 100 µm and 175 µm). Due to the vertical transition between PET sheets and air, only the vertical x-ray source size is relevant in the observed signal. Dashed line for x-ray source size data is the Iγ power fit with γ = 0.32. C
edge is an average of 5 values issued from different zones of the image
(see Methods, Fig. 7a). Error bars for Cedge are the standard deviation of these values. The noise level Cnoise on the
camera related to the detection of the x-ray signal has been measured at ~1.5% (shadowed area). Dashed lines are guides for the eyes.
www.nature.com/scientificreports
www.nature.com/scientificreports/
order to be able to detect Cedge. With the limitation of the detector resolution, the extraction of the spatial
fre-quency u gives similar values for the three thicknesses. Therefore, Ls is identical for all samples. The ratio
Ls/ =⊥ −
L (M 1)s uM is then largely governed by the evolution of the transversal coherence length with laser inten-sity. With the measured Δx values (as described in Fig. 1a) estimated to 120 ± 20 µm and M = 2.9, we calculate Ls/L = 0.03 for the lowest laser intensity and L⊥ s/L = 0.10 for the highest. Since this ratio is always <1, the phase ⊥
curvature can be detected for the range of laser intensity presently studied. Indeed, Cedge is all the time measurable
and reaches a maximum value of 5.6% at low laser intensity (I = 1.5 × 10¹⁷ W/cm2) for an effective source size of
11 µm, which is only × 1.8 the laser focal spot size. Nevertheless, the parameter Cedge decreases on the whole range
of intensity until the maximum intensity of 7.0 × 10¹⁸ W/cm2 reached in this experiment. This is due to the
increase of the x-ray source size (38 µm, × 6.3 the laser focal spot size, at I = 7.0 × 10¹⁸ W/cm2) implying
deteri-oration of the spatial coherence. Nonetheless, this limited growth of the x-ray source size enables to keep a rela-tively high spatial coherence to extract Cedge information. However, only the values of Cedge ~2.6% for the
thickness of 175 µm and Cedge ~2.4% for the thickness of 100 µm are retrieved for this laser intensity on target. In
the case of the thinnest sample tested (75 µm), the Cedge parameter cannot be evaluated being below the limit of a
detectable signal (Cnoise ~1.5%, Fig. 2, see Methods). These experimental results nicely complement recent 1D
simulation works28 in which the general degradation of C
edge was shown in correlation with the increase of the
x-ray source size for a single object of variable size.
As a first preliminary conclusion, high laser intensity enables a high x-ray flux (so a short acquisition time) but it induces a decrease of the spatial coherence of the x-ray source and thus a decrease of Cedge values. However, for
a large range of laser intensity, the Ls/L ratios always are below unity which is a good indicator for the phase ⊥
curvature visibility.
towards biological phase contrast imaging applications.
Further on, to explore the capability of laser produced Kα source for applications, PCI of a wasp is performed for the first time for a large range of laserintensity and in the same experimental configuration. The distance R2 is increased to 90 cm in order to image the
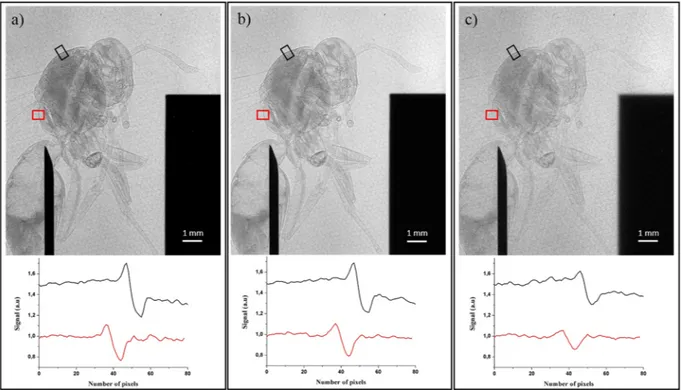
wasp on the entire detector surface and improve the phase contrast signal. The magnification is then M = 3.8. A comparison between raw phase contrast projection images of the wasp is shown in Fig. 3 for three different experimental conditions related to different laser intensities. It also includes for each image two line profiles of the signal perpendicular to the edge of two thorax zones, identical for the three images. The number of pulses for each image is varied (cf. Table 1) in order to obtain enough phase information to come out of the noise level. The choice of the laser intensity values (I = 2.7 × 10¹⁷ W/cm2, 1.0 × 10¹⁸ W/cm2, and 7.2 × 10¹⁸ W/cm2) corresponds
to different trade-offs between access to short acquisition time (high intensity and moderate x-ray source size) and high image quality and information (low intensity and small x-ray source size).
Figure 3. Raw x-ray phase contrast images of the wasp. The knife edge is simultaneously imaged to control
the corresponding effective x-ray source size. Below each image are plotted two line profiles of the signal perpendicular to the edge for 2 thorax zones (black and red rectangles). (a) for I = 2.7 × 10¹⁷ W/cm2, (b) for
I = 1.0 × 10¹⁸ W/cm2, (c) for I = 7.2 × 10¹⁸ W/cm2. The honeycomb structure in the background is related to
www.nature.com/scientificreports
www.nature.com/scientificreports/
Table 1 gives the effective x-ray source size and Kα conversion efficiency, and the number of x-ray pulses
cor-responding to the different laser intensities applied to obtain each image as well as the spatial frequency and the ratio Ls/L .⊥
For the wasp, the edge contrast is measured for all laser intensities. To support this, the Ls/L ratios are calcu-⊥
lated for these three images on the edge contrast signal (red color in Fig. 3). They are constantly less than unity (Table 1). The edge contrast amplitude reduces with laser intensity due to the decrease of spatial coherence which is in excellent agreement with the results obtained on the PET reference sample. Nevertheless, we observe that the parameter Cedge is nearly the same between I = 2.7 × 10¹⁷ W/cm2 and I = 1.0 × 10¹⁸ W/cm2 (Fig. 3a,b) which is
consistent with the limited increase of the x-ray source size in this intensity range (only by a factor 1.8). This is attractive in terms of decreasing notably the number of x-ray pulses required to obtain a raw image without alter-ing significantly the edge contrast value. By increasalter-ing the laser intensity up to I = 7.2 × 10¹⁸ W/cm2 (Fig. 3c), the
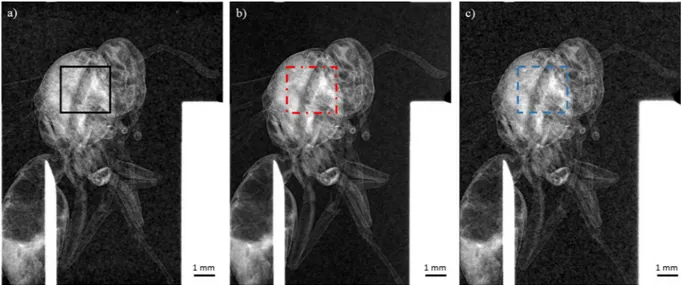
amplitude of the edge contrast signal is reduced almost by a factor of two. It is however still easily detected with only a limited number of shots to acquire a raw phase contrast image. These observations immediately translate into a reduction of the exposure time while obtaining an image of sufficient quality which can be a crucial issue for many applications. To go further, phase extraction based on Paganin approach50, and augmented by an imple-mentation of the x-ray source size effect51, is applied on the wasp raw images (Fig. 3). For the wasp, the same composition than PMMA (C5H8O2) is taken, which is a good equivalent material for soft tissues52. Finally, an
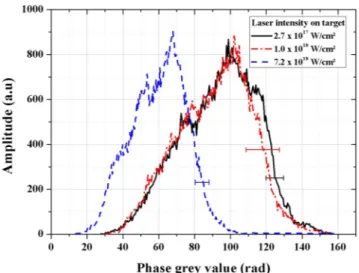
approximation of a monochromatic x-ray source is done. The retrieved phase images are presented in Fig. 4. The analysis is made on the center of the wasp where a region of interest (ROI) (in black solid line, red dashed dotted line and blue dashed line) is defined for each image. From these ROI’s, histograms of the retrieved phase grey values are plotted. The standard deviation of the histograms is a good parameter to evaluate the image dynamic. The latter is the ability of an imaging system to record a large range of the collected signal (here in Fig. 4 the phase signal). As for the raw images of the wasp, the quality of the retrieved phase extraction (red dashed dotted line and black solid line histograms in Fig. 5) is similar for I = 2.7 × 10¹⁷ W/cm2 (Fig. 4a) and I = 1.0 × 10¹⁸ W/cm2
(Fig. 4b). Indeed, the standard deviation σ for these two images are respectively σa = 21 rad and σb = 22 rad while
σc =16 rad for I = 7.2 × 10¹⁸ W/cm2 (Fig. 4c). This dynamic degradation observed for the blue dashed line
Laser intensity (W/cm2) 2.7 × 10¹⁷ 1.0 × 10¹⁸ 7.2 × 10¹⁸
Effective x-ray source size (µm) 11 18 38 Kα conversion efficiency (/2π sr) 2.85 × 10⁻⁵ 6.76 × 10⁻⁵ 1.04 × 10⁻⁴
Number of x-ray pulses 20000 8000 300 Spatial frequency u (lp/mm) 4 3 3
Ls/L⊥ 0.032 0.045 0.084
Spatial frequency ubody (lp/mm) 7 5 4
(Ls/L )⊥body 0.056 0.066 0.11
Table 1. Laser intensities and corresponding x-ray source characteristics, spatial frequency u determined
thanks to the edge contrast signal in Fig. 3 (red case) and the associated ratio Ls/L . Spatial frequency u⊥ body and
corresponding ratio (Ls/L )⊥body are given for a zone in the body of the wasp.
Figure 4. X-ray phase images based on Paganin phase retrieval algorithm50,51. (a–c) are retrieved from the raw images presented in Fig. 3 (a–c). (a) for I = 2.7 × 10¹⁷ W/cm2, (b) for I = 1.0 × 10¹⁸ W/cm2, (c) for I =
www.nature.com/scientificreports
www.nature.com/scientificreports/
histogram in Fig. 5 can be explained by the decrease of the phase curvature contribution. Indeed, for this condi-tion and for the body structure of the wasp, the (Ls/L )⊥body ratio related to the body spatial frequency of the wasp
ubody increases by a factor two compared to the case presented in Fig. 4a. This is due to the expansion of the source
size (as commented previously) and because of the less phase curvature contribution related to a weaker defini-tion of the body structure of the wasp (diminudefini-tion of the ubody value, see Table 1). This also explains why the
average phase grey value is weaker than in the cases presented in Fig. 5 (black solid and red dashed dotted lines). Therefore, the best trade-off laser intensity for phase extraction using Paganin algorithm is I = 1.0 × 10¹⁸ W/cm2
due to the reduction of the exposure time while keeping an excellent dynamic as discussed above.
To explore the limit of ASUR laser source, an ultimate x-ray PCI experiment has been carried out at the maxi-mum laser intensity of I = 1.3 × 10¹⁹ W/cm2. The CCD camera is kept at 90 cm from the wasp and the raw image
shown in Fig. 6a is obtained with an accumulation of only 200 x-ray pulses (2 seconds with 100 Hz driver laser). The effective source size of the x-ray source is 52 µm.
Compared to the previous images of Fig. 3 the quality of the raw image is undeniably degraded with less vis-ible details. Nevertheless, the signal of the edge contrast still exceeds the noise level (Fig. 6b). This signal value is sufficient to extract a phase image shown in Fig. 6c for the air/wasp interface. For the body structure of the wasp, less phase curvature signal is also visible, involving a degraded phase extraction compared to previous images in Fig. 4, with an average grey value of 30 rad and σ = 15 rad (orange ROI in Fig. 6c). Even so, these last results demonstrate good applicability of our x-ray source and 100 Hz TW-class laser driver for phase-contrast imaging at high intensity and short exposure time.
Figure 5. Phase grey histogram of region of interest from images (a–c) of Fig. 4. Error bars are correlated to the non-uniform response of the detector and take into account the (Ls/L )⊥body ratios. They are similar for each point
of the corresponding histogram.
Figure 6. (a) Raw x-ray phase contrast image of the wasp acquired at I = 1.3 × 10¹⁹ W/cm2 and with 200
x-ray pulses. (b) Line profile of the signal perpendicular to the edge of a thorax zone. (c) Corresponding x-ray retrieved phase image.
www.nature.com/scientificreports
www.nature.com/scientificreports/
conclusion
In summary, this study demonstrates the excellent ability for phase contrast imaging of a Kα x-ray source
pro-duced by a high repetition rate multi-TW class Ti:Sa laser system up to a very high range of laser intensity never experimentally explored. By a rigorous characterization of the x-ray source in terms of flux and effective source size done simultaneously for each PCI acquisitions, we clearly obtain raw phase contrast images and phase extrac-tion with detectable phase informaextrac-tion over the entire range of laser driver intensity explored from ~1017 W/cm2
to the maximum intensity tested of 1.3 × 10¹⁹ W/cm2. Thanks to the high temporal contrast of the laser system,
the increase of the effective x-ray source size is restrained from 11 µm at 2.7 × 10¹⁷ W/cm2 to 52 µm at 1.3 × 10¹⁹
W/cm2. For PET samples as well as for the wasp a decrease of the edge contrast signal is observed when raising the
laser intensity in agreement with a lowering of the x-ray source spatial coherence. The quality of the raw phase contrast image of the wasp is almost unchanged between 2.7 × 10¹⁷ W/cm2 to 1.0 × 10¹⁸ W/cm2 and with only
~10% loss of the Cedge factor and a stable dynamic and phase average value. Meanwhile, the number of laser pulses
is reduced by a factor 2.5. At higher laser intensity, up to 1.3 × 10¹⁹ W/cm2, where a more pronounced increase of
the x-ray source size happens, a degradation of the image quality is observed in comparison with PCI images obtained in a lower laser intensity regime. Nevertheless retrieved phase images of the wasp are still shown with a drastic shortening of the acquisition time (a factor 200 between the wasp image done at 2.7 × 10¹⁷ W/cm2 and the
one done at 1.3 1019 W/cm2) thanks to the very high number of K
α photons delivered by laser-produced plasma
at such high laser driving intensity. Thus, the present study shows a compromise between achieving good image quality and short exposure time depending on the targeted application. This compromise can be balanced by adjusting only one parameter, the laser intensity on target. At low laser intensity, the best x-ray source spatial coherence and the lowest Ls/L ratios are achieved which offer the highest edge contrast signal enhancement, ⊥
suitable for applications such as the control of material fabrication processes22. On the opposite, at very high laser intensity, faster imaging acquisition can be done thanks to high available x-ray photon flux with a Ls/L ratio still ⊥
below unity.
Methods
Data extraction and treatment.
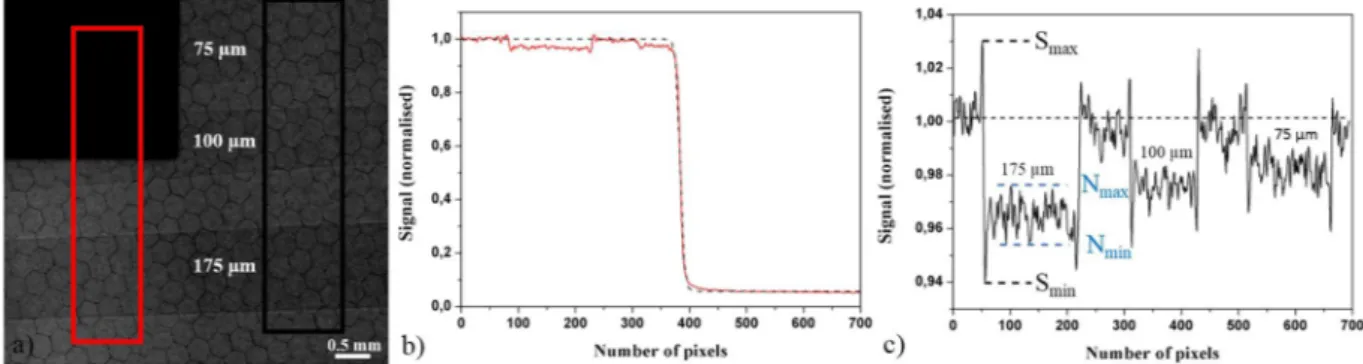
The following procedure to collect the measurements and evaluate the Cedge parameter is done for each laser intensity. The Kα x-ray flux (Fig. 1b) and the x-ray spectrum (Fig. 1c) areacquired29 with a 16 bits direct detection PIXIS-XB: 1024BR camera from Princeton Instruments, cooled down to −60 °C, with 1024 × 1024 pixels arrays and a pixel size of 13 × 13 µm2. The sample is then inserted. For imaging
applications requiring detector with a large surface, a more suitable detector is used. It is a 16 bits indirect detec-tion CCD camera Quad-RO: 4320 from Princeton Instruments cooled down to −25 °C with 2084 × 2084 pixels and a pixel size of 24 × 24 µm2. A raw image of the PET sample and the knife edge is presented in Fig. 7a. In a
single image the characterization of the x-ray source size (Fig. 7b) and the extraction of Cedge for the three
thick-nesses of PET films (Fig. 7c) are done. The x-ray source size is extracted thanks to the well-known knife edge technique, using a sharp tungsten knife29. The corresponding edge spread function (ESF) is plotted from the acquired image (red line profile of the signal in Fig. 7b). We further determine the x-ray source size by applying a Fermi function fit (black dashed line in Fig. 7b) on the resulted ESF. Moreover, the signal for each PET thickness is extracted in order to calculate a value of Cedge. The limit of a detectable phase contrast signal is calculated for
each image and is equal to Cnoise = NNmax−+NNmin ×100%
max min (see Fig. 7c). The same procedure is applied for the wasp
images.
Data availability
The datasets presented in this current study are available from the corresponding author on reasonable request.
Figure 7. (a) Raw image of tungsten knife (black shadow in the left top) and of the sample. Image is acquired at
I = 1.0 × 10¹⁸ W/cm2, with 6000 laser shots; the corresponding x-ray source size is 18 µm and the Kα x-ray flux
3 × 10⁹ ph/sr/s. The sample is made of PET films of different thicknesses. (b) Line intensity profile
corresponding to the vertically integrated red area of the ESF. (c) Vertically integrated intensity line profile of PET films. Note that this line profile only serves as an example to show the three PET films with different thicknesses in a same graph. Different levels of absorption are visible as well as edge enhanced contrast corresponding to the signature of the refractive index variation between PET and air.
www.nature.com/scientificreports
www.nature.com/scientificreports/
Received: 13 December 2019; Accepted: 1 April 2020; Published: xx xx xxxx
References
1. Davis, T. J., Gao, D., Gureyev, T. E., Stevenson, A. W. & Wilkins, S. W. Phase-contrast imaging of weakly absorbing materials using hard X-rays. Nature 373, 595 (1995).
2. Shahani, A. J., Xiao, X. & Voorhees, P. W. The mechanism of eutectic growth in highly anisotropic materials. Nat. Commun. 7, 12953 (2016).
3. Garcea, S. C., Wang, Y. & Withers, P. J. X-ray computed tomography of polymer composites. Compos. Sci. Technol. 156, 305–319 (2018).
4. Mayo, S. C., Stevenson, A. W. & Wilkins, S. W. In-Line Phase-Contrast X-ray Imaging and Tomography for Materials Science.
Materials 5, 937–965 (2012).
5. Arfelli, F. et al. Low-dose phase contrast x-ray medical imaging. Phys. Med. Biol. 43, 2845–2852 (1998).
6. Arfelli, F. et al. Mammography with synchrotron radiation: phase-detection techniques. Radiology 215, 286–293 (2000). 7. Olivo, A. et al. Phase contrast imaging of breast tumours with synchrotron radiation. Appl. Radiat. Isot. 67, 1033–1041 (2009). 8. Wilkins, S. W., Gureyev, T. E., Gao, D., Pogany, A. & Stevenson, A. W. Phase-contrast imaging using polychromatic hard X-rays.
Nature 384, 335 (1996).
9. Shovkun, V. Y. & Kumakhov, M. A. Phase contrast imaging with micro focus X-ray tube. Proc. SPIE 5943, 594315 (2006). 10. Chen, L., Zheng, L., Ai-Min, Y. & Cheng-Quan, L. Influence of tube voltage and current on in-line phase contrast imaging using a
microfocus x-ray source. Chinese Phys. 16, 2319–2324 (2007).
11. Kotre, C. J. & Robson, K. J. Phase-contrast and magnification radiography at diagnostic X-ray energies using a pseudo-microfocus X-ray source. Br. J. Radiol. 87, 20130734 (2014).
12. Espes, E. et al. Liquid-metal-jet x-ray tube technology and tomography applications. Proc. SPIE 9212, 92120J (2014).
13. Snigirev, A., Snigireva, I., Kohn, V., Kuznetsov, S. & Schelokov, I. On the possibilities of x‐ray phase contrast microimaging by coherent high‐energy synchrotron radiation. Rev. Sci. Instrum. 66, 5486–5492 (1995).
14. Cloetens, P., Barrett, R., Baruchel, J., Guigay, J.-P. & Schlenker, M. Phase objects in synchrotron radiation hard x-ray imaging. J. Phys.
D: Appl. Phys. 29, 133–146 (1996).
15. Cloetens, P. et al. Hard x-ray phase imaging using simple propagation of a coherent synchrotron radiation beam. J. Phys. D: Appl.
Phys. 32, A145–A151 (1999).
16. Spanne, P., Raven, C., Snigireva, I. & Snigirev, A. In-line holography and phase-contrast microtomography with high energy x-rays.
Phys. Med. Biol. 44, 741–749 (1999).
17. Kneip, S. et al. X-ray phase contrast imaging of biological specimens with femtosecond pulses of betatron radiation from a compact laser plasma wakefield accelerator. Appl. Phys. Lett. 99, 093701 (2011).
18. Fourmaux, S. et al. Laser wakefield acceleration: application to Betatron x-ray radiation production and x-ray imaging. Proc. SPIE
8412, 841211 (2012).
19. Najmudin, Z. et al. Compact laser accelerators for X-ray phase-contrast imaging. Phil. Trans. R. Soc. A 372, 20130032 (2014). 20. Wenz, J. et al. Quantitative X-ray phase-contrast microtomography from a compact laser-driven betatron source. Nat. Commun. 6,
1–6 (2015).
21. Chaulagain, U. et al. X-ray phase contrast imaging of biological samples using a betatron x-ray source generated in a laser wakefield accelerator. Proc. SPIE 10240, 1024014 (2017).
22. Hussein, A. E. et al. Laser-wakefield accelerators for high-resolution X-ray imaging of complex microstructures. Sci. Rep. 9, 1–13 (2019).
23. Guo, B. et al. High-resolution phase-contrast imaging of biological specimens using a stable betatron X-ray source in the multiple-exposure mode. Sci. Rep. 9, 1–10 (2019).
24. Ikeura-Sekiguchi, H. et al. In-line phase-contrast imaging of a biological specimen using a compact laser-Compton scattering-based x-ray source. Appl. Phys. Lett. 92, 131107 (2008).
25. Oliva, P. et al. Quantitative evaluation of single-shot inline phase contrast imaging using an inverse compton x-ray source. Appl.
Phys. Lett. 97, 134104 (2010).
26. Gradl, R. et al. Propagation-based Phase-Contrast X-ray Imaging at a Compact Light Source. Sci. Rep. 7, 1–9 (2017). 27. Gradl, R. et al. In vivo Dynamic Phase-Contrast X-ray Imaging using a Compact Light Source. Sci. Rep. 8, 1–8 (2018).
28. Fourmaux, S. & Kieffer, J. C. Laser-based Kα X-ray emission characterization using a high contrast ratio and high-power laser system. Appl. Phys. B 122, 162 (2016).
29. Azamoum, Y. et al. High photon flux Kα Mo x-ray source driven by a multi-terawatt femtosecond laser at 100 Hz. Opt. Lett. 43, 3574–3577 (2018).
30. Huang, K. et al. Intense high repetition rate Mo Kα x-ray source generated from laser solid interaction for imaging application. Rev.
Sci. Instrum. 85, 113304 (2014).
31. Toth, R. et al. Evaluation of ultrafast laser-based hard x-ray sources for phase-contrast imaging. Phys. Plasmas 14, 053506 (2007). 32. Rousse, A. et al. Non-thermal melting in semiconductors measured at femtosecond resolution. Nature 410, 65–68 (2001). 33. Krol, A. et al. Initial experimentation with in-line holography x-ray phase-contrast imaging with an ultrafast laser-based x-ray
source. Proc. SPIE 6510, 65100 L (2007).
34. Martín, L. et al. Commissioning of a laser-plasma x-ray micro-focus source for phase contrast imaging. Proc. oSPIE 11036, 110360 J (2019).
35. Toth, R., Kieffer, J. C., Fourmaux, S., Ozaki, T. & Krol, A. In-line phase-contrast imaging with a laser-based hard x-ray source. Rev.
Sci. Instrum. 76, 083701 (2005).
36. Chakera, J. A., Ali, A., Tsui, Y. Y. & Fedosejevs, R. A continuous kilohertz Cu Kα source produced by submillijoule femtosecond laser pulses for phase contrast imaging. Appl. Phys. Lett. 93, 261501 (2008).
37. Laperle, C. M. et al. Low density contrast agents for x-ray phase contrast imaging: the use of ambient air for x-ray angiography of excised murine liver tissue. Phys. Med. Biol. 53, 6911–6923 (2008).
38. Chen, L. M. et al. Phase-contrast x-ray imaging with intense ArKα radiation from femtosecond-laser-driven gas target. Appl. Phys.
Lett. 90, 211501 (2007).
39. Li, M. et al. Laser-driven powerful kHz hard x-ray source. Radiat. Phys. Chem. 137, 78–82 (2017).
40. Barbato, F. et al. Quantitative phase contrast imaging of a shock-wave with a laser-plasma based X-ray source. Sci Rep 9, 18805 (2019).
41. Pikuz, T. A. et al. Propagation-based phase-contrast enhancement of nanostructure images using a debris-free femtosecond-laser-driven cluster-based plasma soft x-ray source and an LiF crystal detector. Appl. Opt., AO 48, 6271–6276 (2009).
42. Clady, R. et al. 22 W average power multiterawatt femtosecond laser chain enabling 1019 W/cm2 at 100 Hz. Appl. Phys. B 124, 89
(2018).
43. Azamoum, Y. et al. Impact of the pulse contrast ratio on molybdenum Kα generation by ultrahigh intensity femtosecond laser solid interaction. Sci. Rep. 8, 1–11 (2018).
www.nature.com/scientificreports
www.nature.com/scientificreports/
44. Fourmaux, S. et al. Pedestal cleaning for high laser pulse contrast ratio with a 100 TW class laser system. Opt. Express 19, 8486–8497 (2011).
45. Bravin, A., Coan, P. & Suortti, P. X-ray phase-contrast imaging: from pre-clinical applications towards clinics. Phys. Med. Biol. 58, R1–35 (2013).
46. Momose, A. Recent Advances in X-ray Phase Imaging. Jpn. J. Appl. Phys. 44, 6355 (2005).
47. Wu, X. & Liu, H. Clarification of aspects in in-line phase-sensitive x-ray imaging. Med. Phys. 34, 737–743 (2007).
48. Henke, B. L., Gullikson, E. M. & Davis, J. C. X-Ray Interactions: Photoabsorption, Scattering, Transmission, and Reflection at E = 50-30,000 eV, Z = 1-92. At. Data Nucl. Data Tables 54, 181–342 (1993).
49. Eder, D. C., Pretzler, G., Fill, E., Eidmann, K. & Saemann, A. Spatial characteristics of Kα radiation from weakly relativistic laser plasmas. Appl. Phys. B 70, 211–217 (2000).
50. Paganin, D., Mayo, S. C., Gureyev, T. E., Miller, P. R. & Wilkins, S. W. Simultaneous phase and amplitude extraction from a single defocused image of a homogeneous object. J. Microsc. 206, 33–40 (2002).
51. Beltran, M. A., Paganin, D. M. & Pelliccia, D. Phase-and-amplitude recovery from a single phase-contrast image using partially spatially coherent x-ray radiation. J. Opt. 20, 055605 (2018).
52. Vedantham, S. & Karellas, A. X-ray phase contrast imaging of the breast: Analysis of tissue simulating materials. Med. Phys. 40, 041906 (2013).
Acknowledgements
The financial support of LASERLAB-EUROPE, European Union’s Horizon 2020 research and innovation program (654148)., Ministry of Research and High Education, Region Provence-Alpes-Côte d’Azur, Department of Bouches-du-Rhône, City of Marseille, CNRS, and Aix-Marseille University are gratefully acknowledged for funding ASUR platform.
Author contributions
M.S. conceived the study. M.G., A.F. and R.C. developed and performed the experiment of PCI and x-ray diagnostics. R.C. operated the laser and performed the laser diagnostics. M.G. and A.S. analyzed data. All the authors discussed and analyzed the results. M.G., A.F., M.S. and O.U. wrote the paper. All the authors discussed the paper and reviewed the manuscript.
competing interests
The authors declare no competing interests.
Additional information
Correspondence and requests for materials should be addressed to M.G. Reprints and permissions information is available at www.nature.com/reprints.
Publisher’s note Springer Nature remains neutral with regard to jurisdictional claims in published maps and
institutional affiliations.
Open Access This article is licensed under a Creative Commons Attribution 4.0 International
License, which permits use, sharing, adaptation, distribution and reproduction in any medium or format, as long as you give appropriate credit to the original author(s) and the source, provide a link to the Cre-ative Commons license, and indicate if changes were made. The images or other third party material in this article are included in the article’s Creative Commons license, unless indicated otherwise in a credit line to the material. If material is not included in the article’s Creative Commons license and your intended use is not per-mitted by statutory regulation or exceeds the perper-mitted use, you will need to obtain permission directly from the copyright holder. To view a copy of this license, visit http://creativecommons.org/licenses/by/4.0/.