HAL Id: halshs-00469327
https://halshs.archives-ouvertes.fr/halshs-00469327
Submitted on 1 Apr 2010
HAL is a multi-disciplinary open access archive for the deposit and dissemination of sci-entific research documents, whether they are pub-lished or not. The documents may come from teaching and research institutions in France or abroad, or from public or private research centers.
L’archive ouverte pluridisciplinaire HAL, est destinée au dépôt et à la diffusion de documents scientifiques de niveau recherche, publiés ou non, émanant des établissements d’enseignement et de recherche français ou étrangers, des laboratoires publics ou privés.
perspective
Fabrizio Coricelli, Mathilde Maurel
To cite this version:
Fabrizio Coricelli, Mathilde Maurel. Growth and crisis in transition: a comparative perspective. 2010. �halshs-00469327�
Centre d’Economie de la Sorbonne
Growth and crisis in transition : A comparative perspective
Fabrizio CORICELLI, Mathilde MAUREL
Fabrizio Coricelli∗ and Mathilde Maurel+ February 19, 2010
Abstract
The paper provides an empirical analysis of the growth performance of transition countries in a comparative perspective, separating episodes of crises from those of growth. Performance is measured by the output response following recessions, rather than average rates of growth that aggregate periods of recessions and periods of growth. Results highlight significant differences between transition and non-transition countries, and heterogeneity within the transition group. Distinguishing the performance following the so-called “transitional recession” from that of “normal recessions”, the analysis allows separating the role of initial conditions, pre-transition, from the effects determined by the economic structure that emerged after the launch of market reforms. The post-recession behavior of output in Central-Eastern Europe resembles that of emerging and developing countries in the aftermath of banking and financial crises, often following significant liberalizations. In contrast, the post-crisis performance of CIS countries resembles the output response observed during episodes of civil wars, and remains significantly different from the normal response of an average market country. Therefore, the ability to rebound after a crisis is a key element of the growth performance of different transition countries. Furthermore, we distinguish three components of the growth performance associated to a crisis, namely the capacity to rebound, the depth and the length of the crisis. We observe that such performance depends on economic reforms and especially on the complementarities among different reforms.
Keywords: Recessions, crises, reform complementarities, transition JEL Classification Codes: C23, F43, 040, P27
∗
CES, Université Paris 1, Panthéon-Sorbonne and CEPR, email : [email protected].
1. Introduction
Twenty years of transition have produced highly different effects across transition countries. Different initial conditions justify part of such differences. Most observers would agree that the different depth of the so-called “transitional recession” -- using Kornai’s terminology -- may be due to such initial conditions. However, more complicated is to explain the different performance during the recovery period following the initial fall in output. One could have expected that those countries initially harder hit would have displayed a steeper recovery. More generally, contrasting the experience of transition countries with that of other countries going through episodes of recessions and crises, one would have assumed that the specificity of transition should have emerged in the form of a steep recovery following the output collapse, as the movement to a market economy would have produced enormous efficiency gains. During the 1990s some explanations were provided for the persistence of the output decline and for the poor post-recession performance (see Campos and Coricelli, 2002, for an overview). In this paper, we focus on empirical evidence and use a comparative approach by analyzing transition countries within a broad cross-country sample.
We address three main issues: (i) how did the “transitional recession” compare with other episodes of deep recessions in non-transition countries? (ii) What role did the “transitional recession” play for the subsequent process of growth? (iii) What role did reform/liberalization policies play in transition countries, and more specifically did the complementarities among reforms matter?
The first question involves an assessment of the specificity of the transition experience. Is switching from a planned to a market economy radically different from, for instance, transforming a system from an agrarian economy into an industrial economy? The second question concerns the role of the initial output fall in explaining the subsequent recovery and growth. Did the depth and persistence of the initial output fall affect the characteristics of the output dynamics in the following period?
The third question raises the issue of whether and to what extent the effects of policies depend on the magnitude of the initial distortions and the pervasive nature of such distortions, which affect all areas of the economy. Indeed, it is legitimate to assume that planned economies were characterized by extreme distortions, linked to the absence of markets and the dominance of the state in the economy. Should we expect that freeing the economy from these huge distortions would determine a very strong growth effect? Is there a role for policy complementarities in a world characterized by huge and widespread distortions?
The three issues addressed in the paper are inspired by the so-called “unified theory of growth and development”, recently put forward by Parente and Prescott (2005). In such approach, growth and development are considered a process going through different regimes, characterized by institutional and policy factors which determine the growth performance of a country. The main idea is that at each point in time countries can potentially exploit a “world technology”, which describes the technological frontier available in each period in history. However, national institutions and policies determine whether a country is capable of exploiting such technological frontier. Defining a “Malthus regime”, as a regime under which output per capita stagnates, and a “Solow regime”, as the regime under which output per capita grows over time, the growth dynamics of a country can be analyzed as a process characterized by a regime switch. Such switch occurs at different points in time for different countries. For this reason, a cross section analysis would identify large differential productivity growth and productivity levels across countries. Furthermore, a time series of growth for a given country would identify structural breaks with accelerations of growth. Institutions and policies determine the timing of the regime switch and the extent to which a country is capable of moving close to the world technology frontier. Transition fits extremely well such unified approach, as transition is perhaps the most important example of regime switch observed in the 20th century.1
1 It is remarkable that the model advanced by Parente and Prescott is very close in spirit to the models of transition
proposed at the start of transition such as Aghion and Blanchard (1994) and, perhaps even more, Chadha and Coricelli (1997).
From an empirical perspective, the transition experience accords with recent analyses of growth that emphasize the relevance of distinguishing periods of positive growth and periods of recessions. Indeed, to understand the performance of a country it is also important to evaluate the relationship between the recession and the subsequent phase of recovery and growth. Does recession positively affect subsequent growth, through a Schumpeterian cleansing effect, or does recession negatively affect subsequent growth, leading to adverse long run effects?
In this paper we address the above issues by focusing on the growth performance of transition countries in a comparative setting. After the initial transitional recession, transition countries were affected by several recessions associated with the typical shocks identified as causes of recessions in markets economies: banking and currency shocks, civil wars, political changes. We investigate whether transition countries display a different dynamics in relation to such shocks. Such different performances may be explained by several factors, relating either to different initial conditions or to different path of economic and/or political reforms. Recent literature (Campos and Coricelli, 2009) has emphasized the heterogeneity in the paths of political reforms implemented in transition countries. Such different political paths may help to explain different economic outcomes. Along these lines, it has been argued that not only there exists a link between economic crises and economic reforms, but also that political crises may explain economic reform trajectories and thus economic performance (Campos, Hsiao and Nugent, 2009; see also Giavazzi and Tabellini, 2005, Furman and Stiglitz, 1998, Drazen and Easterly, 2001, and Pitlik and Wirth, 2003). In this paper we do not address directly the importance of such political dynamics. We focus on main areas of economic reforms as determinants of economic performance, implicitly assuming that the political dynamics affect performance through their effect on economic reform. Specifically, we analyze whether different dynamics for transition countries might be explained by the presence of “reform complementarities”, as transition countries needed to implement a much larger set of reforms compared to market economies (see also Braga de Macedo and Oliveira-Martins, 2008 and Braga de Macedo et al., 2010). Rather than looking at a broad range of heterogeneous, and often
ill-measured reforms (see Campos and Horvath, 2006), we focus on those key dimensions of the reform process, namely reforms in the financial sector and trade liberalization, on which there are somewhat robust results in the literature (Christiansen et al., 2010). Furthermore, within financial sector reforms we distinguish different dimensions, highlighting either institutional progress or liberalization policies. These two types of reforms may have different impacts and, more importantly, they may have different impacts depending on whether they are implemented simultaneously or in an unbalanced and piecemeal way.
Our results indicate that: (i) for Central-Eastern Europe the transitional recession looks similar to episodes of crises in emerging and developing countries associated to banking and financial crises, often following significant liberalizations. In contrast, for CIS countries, the transitional recession resembles the output response observed during episodes of civil wars. This evidence suggests that the shift from a planned to a market economy did not “unleash prosperity”.2 This large difference between the performance of CEE and CIS countries could be interpreted in two ways. The first is that “structural” initial conditions were much less favorable for CIS countries. The second is that reform policies were implemented in a more rapid and more broad-based fashion in CEE countries. This view emphasizes the role of reform complementarities. The two interpretations might be reconciled, if one assumes that a main difference in initial conditions were related to the presence in CEE of some forms of liberalizations and of markets prior to the full-fledged transition (see Campos and Coricelli, 2002).
The paper is organized as follows. In section 2 we analyze the transitional recession in a comparative perspective. Section 3 contains the empirical results on growth, crisis and recovery for a world sample. Dummies for the two main groups of transition counties, CEEs and CIS, are used to evaluate the presence of specific factors related to transition. Section 4 discusses the role of reform policies and in particular of reform complementarities in Central-Eastern Europe, focusing on the financial sector. Section 5 concludes.
2
Borrowing a term used in a recent analysis by the World Bank on the growth process in transition countries (World Bank (2008)).
2. Transitional recession in a comparative perspective
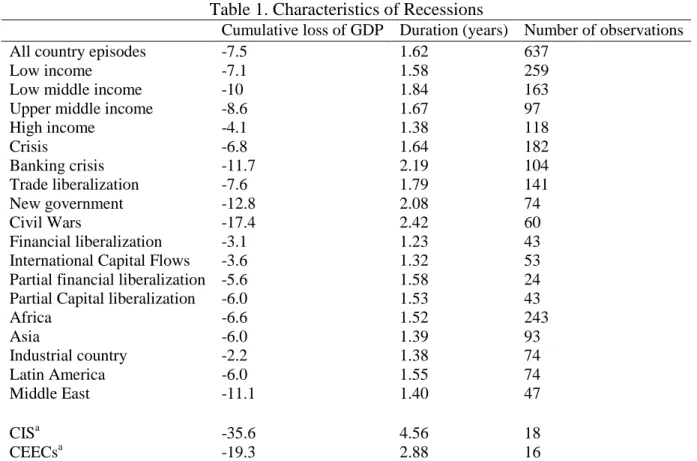
Transitional recession is defined as the output fall that occurred after the launch of policies of liberalization and market reforms in formerly planned economies. The starting dates of transition differ across countries, with Central and Eastern European countries launching the reform programs during 1990-1991, and the CIS countries launching such programs in 1992. An additional complication for the cross-country comparison is that in the former Soviet Union output began to fall before transition, namely with the start of Perestroika. In Table 1 the recessions experienced by transition countries can be seen in a comparative perspective, over the period from 1960 to 2001.
It is remarkable that the cumulative decline for transition countries is by far the largest in the whole sample. Note that this is an average cumulative decline and thus it is affected by the milder drop in CEEs. If we were to separate CIS from CEEs, we would obtain an even sharper result. Therefore, the first observation is that the “transitional recession” is unique in its magnitude during the last half century. Furthermore, the duration indicates that the “transitional recession” has also been the more persistent recession in a comparative perspective.
Table 1. Characteristics of Recessions
Cumulative loss of GDP Duration (years) Number of observations
All country episodes -7.5 1.62 637
Low income -7.1 1.58 259
Low middle income -10 1.84 163
Upper middle income -8.6 1.67 97
High income -4.1 1.38 118 Crisis -6.8 1.64 182 Banking crisis -11.7 2.19 104 Trade liberalization -7.6 1.79 141 New government -12.8 2.08 74 Civil Wars -17.4 2.42 60 Financial liberalization -3.1 1.23 43
International Capital Flows -3.6 1.32 53
Partial financial liberalization -5.6 1.58 24 Partial Capital liberalization -6.0 1.53 43
Africa -6.6 1.52 243 Asia -6.0 1.39 93 Industrial country -2.2 1.38 74 Latin America -6.0 1.55 74 Middle East -11.1 1.40 47 CISa -35.6 4.56 18 CEECsa -19.3 2.88 16
The second observation is that the magnitude of the output decline in transition is comparable – actually deeper – than that observed during episodes of civil war.
The difference between CEECs and CIS countries has been huge: the cumulative loss of GDP from peak-to-trough during the transitional recession in CIS countries has been 35.6 %, and lasted 4.56 years, while in CEEs has been 19.3% and lasted 2.88 years. The recovery period to regain the initial level has been 10 years in CIS countries and 3 years in CEEs.3
Two main observations stand out. First, not only the “transitional recession” has been much deeper in CIS countries, but its persistence has been much higher as well. To find such a pattern one has to look at African countries involved in civil wars. As in civil wars, it is likely that transition involved a huge destruction of resources, which was not compensated by the creation of new productive capacity. Second, there were several episodes of recession after the initial period of transitional recession. The Russian crisis was one of the main factors determining crises throughout the region. However, there were several recessions associated with banking and currency crises affecting both CEECs and CIS countries (see Appendix 3).
In the next section we analyze econometrically the behavior of output following crises. The sample includes a broad set of countries, not only transition countries. This will allow us to identify possible differences in behavior of transition countries. To account for the specificity of transition countries, we carry out the analysis distinguishing the transitional recession from “normal” crises. The objective is to assess in a comparative perspective the performance of transition countries after episodes of crises.
3. Recession and recovery in a comparative perspective: Econometric analysis
We look at the growth experience across the world during the period 1960-2007. We follow the methodology used by Cerra and Saxena (2008), and extend the sample they used to include the
transition countries that were not included in their sample. We extend as well the sample period from 2001 to 2007.
3.1. Data
In the analysis the dependent variable is real GDP per capita. The series are taken from World Development Indicators of the World Bank, complemented for the last years by the World Economic Oulook of the IMF. Banking crisis dates are taken from Leaven and Valencia (2008), while those for civil war are taken from Sarkees (2000).4 The dataset identifies the participants of intrastate wars. Our dummy variable for internal conflict is set equal to one for a country in the years of conflict and zero otherwise. The dummy for trade liberalization is formed from the dates of trade liberalization available in Wacziarg and Welch (2008). We assign a value of zero to pre-liberalization years and unity to the year of trade pre-liberalization and subsequent years. We obtain measures of financial liberalization from the Financial Reform database compiled by the IMF's Research Department (Abiad et al., 2008). Data on change in government comes from Polity International, and defines the durability of a government. The dummy variable takes a value of one when the durability variable is zero.
3.2. Empirical analysis
The objective of our empirical analysis is to assess whether the extraordinary recession emphasized in the previous section has been followed by rebounds large enough to allow countries to recover fast and thus regain the pre-transition period level of GDP.
Our basic assumption is that the condition under which output losses following recessions are fully reversed is that the rate of growth g during the year (or two years) after the crisis is significantly it
higher than the typical positive rate of growth before and after the crisis. In that case, the rebound will allow a country that experienced a crisis to recover rapidly to its former trend line.
Therefore, we estimate the output response following recessions, and we consider that the slope of the recovery immediately following a recession measures the long-run effects of recessions. In
order to measure the slope of the recovery we define a “trough” variable Troughi,twhich is a
dummy variable set equal to one when a year of negative growth occurs and is followed immediately after by a year of positive growth; it is zero otherwise5. The estimated equation is as follows:
(
git git >0)
=αi +β*Troughi,t−1+βK *(
DK *Troughi,t−1)
+uitIf βis negative or even nil, output fails to revert to its trend line. A necessary (but not sufficient) condition for the GDP level to revert to its pre-recession trend level is that β is significantly positive.
The panel structure of the dataset permits to exploit the time variation of growth within each country. We allow the average rate of growth to differ across countries by imposing heterogeneous intercepts (using fixed effects) in the panel of annual growth rates, but we pool information on growth in the recovery phase by imposing a homogenous slope (β).
The pooled estimate provides summary information about the typical response, even if we can expect a variation around it. This variation is measured through an interaction term
(
DK*Troughi,t−1)
, where the dummy D is one for a particular set of countries, transition countries Kfor instance, or countries that experienced trade or financial liberalizations. This allows us to determine whether the reversal from a crisis has been significantly different from the typical response, according to the type of crisis or to the type of country.
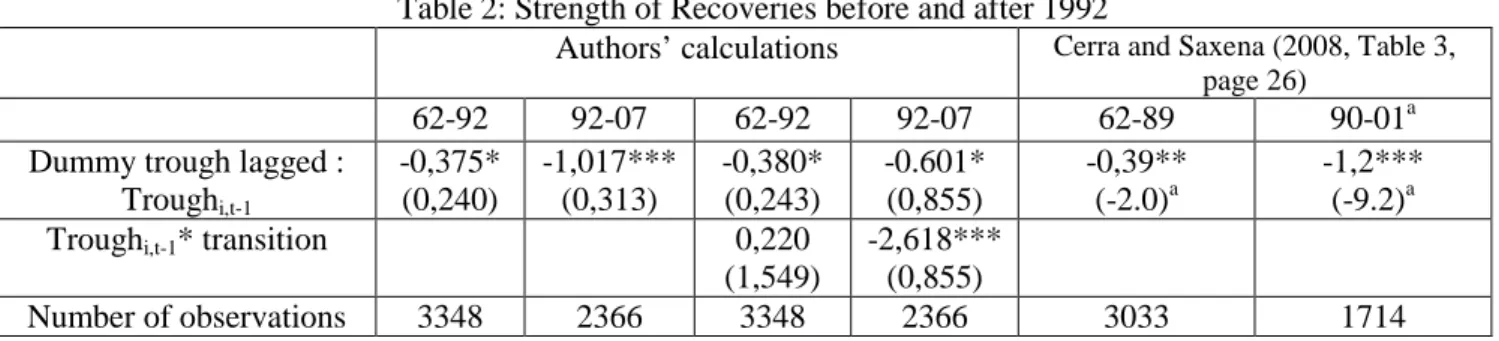
Our results on the whole sample confirm the results by Cerra and Saxena (2008, Table 3, page 26): recessions tend to have a negative effect on the immediate post-recession growth6. By running two separate regressions for the period 1961-1992 and for the period 1992-2007, we observe that the magnitude of such negative effect is much larger during the 1990s, suggesting that the adverse effects of recessions have been stronger in recent years.
5 We can consider also that the “recovery phase” can be more than one year of positive growth after the recession. In
that case, the trough variable will have value of 1 for more than one year after the crisis.
Our guess is that this result can be imputable, at least partially, to the presence of transition recessions in the sample. We directly verify this conjecture in Table 2 by including an interaction term for transition countries. Such interaction term has indeed a significant negative sign, and although the estimated coefficients β are still different before and after 1992, the difference is much smaller than in the regression without transition countries dummy. This suggests that transition countries account for most of the increase in the negative effect of recessions found in the post-1990 period.
From the perspective of transition countries, the above results suggest that recessions in transition countries have a strong negative and long-lasting effect on post-recession growth rates, pointing to the lack of evidence on the presence of creative destruction in transition countries.
Table 2: Strength of Recoveries before and after 1992
Authors’ calculations Cerra and Saxena (2008, Table 3, page 26)
62-92 92-07 62-92 92-07 62-89 90-01a
Dummy trough lagged : Troughi,t-1 -0,375* (0,240) -1,017*** (0,313) -0,380* (0,243) -0.601* (0,855) -0,39** (-2.0)a -1,2*** (-9.2)a Troughi,t-1* transition 0,220
(1,549)
-2,618*** (0,855)
Number of observations 3348 2366 3348 2366 3033 1714
*: significance at the 10%; ** significance at the 5%; *** significance at the 1%; a Standard errors are in parenthesis below the coefficients, except in the last two columns, where they are replaced by T-stats.
3.3. Separating “transitional recessions” from “normal” recessions
We extend the basic analysis to verify (i) whether there are different behaviors in CEE (EU10 and Western Balkans)7 and CIS countries (low income and middle income CIS countries)8 and (ii) whether there are differences in the output response to “transitional recession” and “normal”
7 EU10 plus Croatia, i.e. Bulgaria, Croatia, Czech Republic, Estonia, Hungary, Latvia, Lithuania, Poland, Romania,
Slovak Republic, Slovenia; Western Balkans, i.e. Albania, Bosnia and Herzegovina, Macedonia and Serbia and Montenegro.
8
Middle income CIS: Belarus, Kazakhstan, Russia, Turkmenistan and Ukraine; Low income CIS: Armenia, Azerbaijan, Georgia, Kyrgyz Republic, Moldova, Tajikistan and Uzbekistan.
recessions. The latter is achieved by running separate regressions for the period post-1992 and post 19959.
The results are summarized in Tables 3a and 3b and suggest that: (i) the negative effect of transitional recession is much smaller in EU10 (-2.073) than in low (-3.545) and middle income CIS countries (-3.579); (ii) in the post transitional recession period (post-1995, to take into account the delayed transition in CIS countries) the coefficient of recession on subsequent growth is insignificant for EU10 countries, whereas it remains significant, negative and large for low income (-3.456) and middle income (-3.431) CIS countries.
Tables 3a and 3b: Is strength of recovery different in transition countries?
Table 3a
Gdp growth from 1992 explained by : Dummy trough lagged : Troughi,t-1 -0.601** (0.34) -0.877*** (0.324) -1.048*** (0.316) -0.919*** (0.317) -0.856*** (0.320) Troughi,t-1* transition -2.61*** (0.85) Troughi,t-1* EU10
a -2.073* (1.246) Troughi,t-1* WB b 1.698 (2.341) Troughi,t-1* MiCIS
c
-3.579** (1.915) Troughi,t-1* LiCIS
d -3.545*** (1.504) F-statistics 9.97 6.65 5.53 7.02 8.02 Number of observations 2366 2366 2366 2366 2366 9
For robustness check, we run also regression for post 1998, although the number of observations falls to a low figure. Results are available upon request.
Table 3b
Gdp growth from 1995 explained by : Dummy trough lagged : Troughi,t-1 -0.783** (0.431) -1.128*** (0.404) -1.244*** (0.401) -1.066*** (0.405) -1.024*** (0.407) Troughi,t-1* transition -2.748*** (1.093) Troughi,t-1* EU10
a -2.167 (2.069) Troughi,t-1* WB b 1.590 (2.746) Troughi,t-1* MiCIS
c
-3.431* (1.975) Troughi,t-1* LiCIS
d -3.456** (1.757) F-statistics 7.83 5.21 4.82 6.17 6.60 Number of observations 1944 1944 1944 1944 1944 a
EU10: see Note 5; b Western Balkans: see Note 5; c Middle income CIS: see Note 6; d Low income CIS: see Note 6. *: significance at the 10%; ** significance at the 5%; *** significance at the 1%
Standard errors are in parenthesis below the coefficients
Overall, these results suggest that the initial transitional recession did not lead to subsequent benefits in terms of growth, at least during a five year interval after the start of transition. However, for the episodes of crises after the transitional recession, there is no negative effect for CEE countries, while the negative effect persists for CIS countries. This implies that the ability of CEEs to recover from a crisis by unleashing productive forces after a recession is much larger than in CIS. In summary, after 20 years from the start of transition it seems that CIS countries have not yet fully exploited potential growth benefits of market reforms. Neglecting possible heterogeneity within the CIS group, we can conclude that from the perspective of growth transition so far has been a failure in CIS countries.
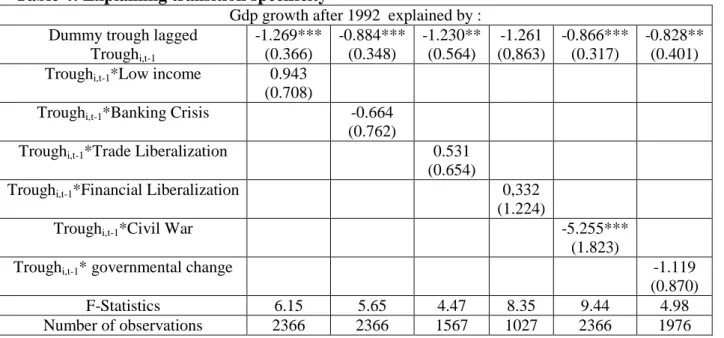
We also tried to assess whether there is an asymmetry in the growth response to recessions between CEE and CIS countries, controlling for the type of crises associated with such recessions: currency and banking crises, civil war and political change.
We analyze as well whether the response following a recession may differ depending on the reform policies associated to temporary output fall, in particular trade and financial liberalization, although the sign (positive or negative) of the impact is uncertain. Results, summarized in Table 4
confirm that the negative performance of CIS countries cannot be attributed to the nature of the crisis they faced. But somehow puzzlingly, this negative performance looks like the one of countries that experienced civil wars.
Table 4: Explaining transition specificity
Gdp growth after 1992 explained by : Dummy trough lagged
Troughi,t-1 -1.269*** (0.366) -0.884*** (0.348) -1.230** (0.564) -1.261 (0,863) -0.866*** (0.317) -0.828** (0.401) Troughi,t-1*Low income 0.943
(0.708)
Troughi,t-1*Banking Crisis -0.664
(0.762)
Troughi,t-1*Trade Liberalization 0.531
(0.654)
Troughi,t-1*Financial Liberalization 0,332
(1.224)
Troughi,t-1*Civil War -5.255***
(1.823)
Troughi,t-1* governmental change -1.119
(0.870)
F-Statistics 6.15 5.65 4.47 8.35 9.44 4.98
Number of observations 2366 2366 1567 1027 2366 1976
*: significance at the 10%; ** significance at the 5%; *** significance at the 1% Standard errors are in parenthesis below the coefficients
One explanation behind the dismal growth results obtained for CIS countries might be the piecemeal and erratic path of reforms followed in CIS countries, as opposed to the more steady and broad-based approach followed in CEE countries. In the following section, we analyze whether reform complementarity is the key behind those contrasting patterns of growth after crisis.
4. Reform complementarities and crisis
The breadth of reforms that are needed to move from a planned to a market economy is undoubtedly much larger than any other experience of reforms in market economies. In this respect, transition has been a unique experience, as reforms had to be implemented in all economic and institutional areas typical of a market economy. Braga de Macedo and Oliveira-Martins (2008) have constructed a coherence index of reforms based on EBRD indicators. The index measures the degree of co-movement in the various types of reforms. They find that the index has a positive
effect on growth, controlling for the effect of the overall level of reform. In summary, in addition to the extent of reform, the implementation of reforms in areas that are likely to be complementary has a positive effect on growth.
Unfortunately, data on a large set of reforms comparable to those included in the EBRD transition index are not available for the large set of countries we consider in our study. To maintain the comparative dimension of our analysis, we decided to focus on two main areas of reform, financial reform and trade liberalization. Therefore, this choice was partly driven by data limitations, but at the same time we believe that restricting the analysis to trade and financial reforms may actually strengthen the results, as the possible complementarities between these two types of reforms have solid theoretical foundations. In contrast, from a theoretical point of view there are no clear predictions on the implications of complementarities among diverse areas of reform, such as privatization, price liberalization, non-banking sector reform etc.. Financial sector reform in itself contains different elements and this allows us to implement an analysis on the complementarities between different reform elements.
The effect of opening up and liberalizing the financial sector are likely to depend on the quality of institutions relating to contract enforcement, information and other crucial institutional areas affecting the functioning of the financial sector. Furthermore, there are several studies pointing to the interconnections between liberalization and market structure, such as competition and barriers to entry in the domestic banking sector. Therefore, the effects of opening up the system to capital flows or liberalizing interest rate setting may have different effects depending on the degree of competition in the domestic banking sector.10 In summary, we acknowledge the limitations of focusing on two areas of reforms, but, at the same time, we claim that coherence among different dimensions of financial sector reform is likely to have significant effects on economic performance, and that financial and trade liberalization are likely to have strong complementarities.
In the recent dataset constructed by the Abiad et al. (2008), financial reform contains seven different indicators, which relate to different areas of reforms. In particular, among these indicators one can distinguish institutional aspects affecting the functioning and efficiency of the financial sector and policy measures relating to liberalization and opening up of the financial sector. Our empirical strategy is straightforward. We follow Braga de Macedo and Oliveira-Martins (2008) and construct an indicator of reform complementarities. Our approach main differs with respect to previous analyses in two main aspects. First, as noted above, rather than looking at a broad set of reforms for which there are no strong priors about the relevance of complementarities, we focus on main economic reforms, relating to financial liberalization, opening of the capital account, institutional building in the financial sector and trade liberalization (Christiansen et al., 2010). Second, we analyze the impact of reforms on recession episodes and the rebound following recessions, rather than average growth rates. Specifically, the capacity to rebound, the depth of recessions and its persistence are likely to be lower under higher complementarities. In summary, we verify empirically whether reform complementarities could be one of the elements explaining the different performance of CEEs with respect to CIS countries.
4.1. Financial Reform and Trade Liberalization Data
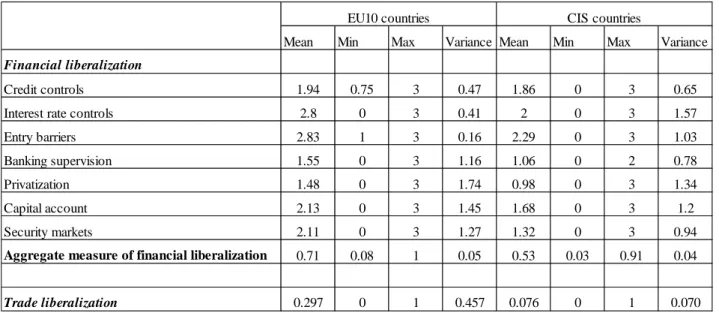
Summary statistics for each component of the financial reform database and trade liberalization are reported in table 5 for EU10 and CIS countries (in Appendix 2 we report details at the country level). We cover a period of 16 years, from 1989 to 2005.
Regarding financial reform, before 1989, transition countries’ banking and financial sectors were under the control of the governments. After 1989, as in other countries in the original sample, financial systems were liberalized in the areas of interest rate controls, bank entry, and capital account restrictions, while bank supervision and regulation lagged behind. The values taken by the privatization index constitute the only exception. They are quite low, especially in the CIS,
reflecting the specificity of the transition countries and the inheritance of the formerly planned systems.
The first dimension is credit controls and reserve requirements. The first variable reflects directed lending, supported by subsidized rates, to priority sectors for industrial policy. The second variable captures the presence of excessively high reserve requirements imposed by governments on banks. This indicator does not differ significantly across transition countries. The mean in the EU10 (CIS) is equal to 1.94 (1.86), and the variance is 0.47 (0.65).
The second dimension, interest rate controls, the most common form of financial repression, corresponds to a situation where the government controls both lending and deposit rates. Here there is more heterogeneity. The indicator yields a mean value of 2.80 for EU10, and 2.00 for CIS.
The third dimension, privatization, depicts situations where major banks are state-owned and/or the percentage of public bank assets is from 50 to 100%, to situations where such banks do not exist anymore. In this dimension the performance of the CIS is poor (the mean value is 0.98), while in the EU10 it is significantly better, reaching a mean value of 1.48.
The fourth dimension, entry barriers, reflects a situation where the entry of competitors (e.g. foreign banks and non-financial intermediaries) is restricted. The data indicate a more liberalized pattern in the EU10 than in the CIS (the means are respectively 2.83 and 2.29, with variance equal to 0.16 and 1.03, respectively).
The fifth dimension, capital account restrictions, is intended to give the government greater control over the flow of credit and over the exchange rate. The mean is 2.13 for the EU10 (variance being equal to 1.45); it is set equal to 1.68 for the CIS, reflecting a lower degree of financial openness in the latter countries.
The sixth dimension, prudential regulations and supervision of the banking sector, is the only dimension, out of the seven, where a greater degree of intervention is coded as a reform. It yields a mean value of 1.55 in the EU10, and 1.06 in the CIS, reflecting higher risky behaviors, less
independence of the banking supervisory agency and lower efficiency of examinations of banks in the latter countries.
The seventh and last dimension, securities market policies, includes the auctioning of government securities, establishment of debt and equity markets, and policies to encourage the development of such markets and openness of securities markets to foreign investors. Again the data reflect a better situation in the EU10 (the mean is 2.11) than in the CIS (1.32).
Finally, the trade liberalization indicators clearly show that EU10 have achieved much higher levels of liberalization than CIS countries.
Table 5. Indicators of financial and trade liberalization
Mean Min Max Variance Mean Min Max Variance
Financial liberalization
Credit controls 1.94 0.75 3 0.47 1.86 0 3 0.65
Interest rate controls 2.8 0 3 0.41 2 0 3 1.57
Entry barriers 2.83 1 3 0.16 2.29 0 3 1.03
Banking supervision 1.55 0 3 1.16 1.06 0 2 0.78
Privatization 1.48 0 3 1.74 0.98 0 3 1.34
Capital account 2.13 0 3 1.45 1.68 0 3 1.2
Security markets 2.11 0 3 1.27 1.32 0 3 0.94
Aggregate measure of financial liberalization 0.71 0.08 1 0.05 0.53 0.03 0.91 0.04
Trade liberalization 0.297 0 1 0.457 0.076 0 1 0.070
EU10 countries CIS countries
We explore whether reform momentum is concentrated in some reform areas or more evenly distributed. The underlying assumption is that a non-consistent and piecemeal strategy, where some areas are restructured deeply while others remain unreformed, will yield a negative outcome. As in Braga de Macedo and Oliveira-Martins (2008), this phenomenon could be explained by the theory of second best, according to which in a highly distorted system, reducing one distortion may actually worsen the outcome.
A few examples can illustrate this view. Relaxing the level of financial repression makes no sense if entry barriers are not removed at the same time, allowing competition over the allocation of credit to increase the level of efficiency. Allowing more banks to enter the market and alleviating the restrictions imposed on their activities can be counterproductive if supervision of the banking system does not control for a proper functioning of the market. Moral hazard and adverse selection are a very likely outcome in the absence of regulations and supervision: banks continue to lend to non profitable firms and this retards the restructuring process, the hardening of the budget constraint, and the implementation of bankruptcy procedures. A too high share of public assets and a too high number of state-owned banks may be incompatible with abolishing controls on banking activities. To illustrate the idea that complementarities among reform matter for the effects of reforms on outcomes, let us consider an example with three reforms, which can take values between 1 and 4. Complementarity has positive effects when a move from (1,1,1) to (2,2,2) leads to better outcomes than a move to (4,1,1), although both moves imply the same average level of reform. A simple way to capture this is to measure the concentration of reforms by means of the Hirschmann-Herfindhal indicator and take the reciprocal of it as an index of reform complementarity:
(
)
(
)
∑
= i jt ijt jt f N f Compl 2 Re Re 1Where Compljt stands for the complementary index between reforms i for country j and in
year t; Re fjt is the simple average, year by year, for country j, over the financial and trade reform
dimensions indicated above; N is the number of reforms and is equal to 7 for financial reforms and 8 when we include as well trade liberalization. A higher value of Compljt denotes a higher
complementarity (and lower concentration). We compute three indicators of complementarity: (1) of financial reforms only, (2) of both financial and trade reforms, weighted, and (3) of financial and trade reforms, un-weighted. According to figure 1 below, complementarity was consistently higher in EU10 countries than in CIS countries, whatever the indicator under consideration (see Appendix 2 for details at the country level).
Figure 1
a. Complementarity of financial reforms
b. Complementarity of trade and financial reforms, unweighted
4.2. Empirical analysis
We now turn to the main issue raised in this paper, namely how do countries react to crisis in the short run and link such reaction to reforms. We ask whether the years of positive growth after a crisis are sufficient to retrieve the level of growth which prevailed before the crisis, and whether transition countries differ from the general pattern. To answer those questions, the indicators presented in the previous section, financial reforms (FinRef), trade liberalization (TradeRef) and reform complementarities (Compl), are related to the capacity to rebound, the depth and length of the crisis. We estimate the three equations below:
(
)
(
)
(
)
jt it it it it it it it it it it it jt t i t i t i t i t i it t i i it it X b Compl b f Fin b f Trade b b Length v X a Compl a f Fin a f Trade a a Depth u X Trough X Compl Trough Compl Trough a g g ε γ γ γ γ β + + + + + = + + + + + = + + + + + + = − − − > 4 3 2 1 4 3 2 1 , 1 , 4 , 3 , 1 , 2 1 1 , 0 Re Re Re Re * * /The first equation refers to the capacity to rebound. The hypothesis is that less dispersion in reform implementation should allow a better catch-up to the pre-crisis level of GDP; we take the ex ante level of reform complementarity, i.e. the year t-1 preceding the rebound. For this assumption to be validated, γ2 should be positive. We control for fixed effects and macro-policy measures Xi,t,
proxied by the rate of inflation in the year of recovery. The impact of reform complementarity and macroeconomic stability on the strength of the rebound following a recession is measured by the interaction of Compli,t-1 and Xi,t with the dummy Troughi,t-1. The database covers the period from
1992 to 2007, for 91 countries of the world, which makes a maximum of 1365 observations.
The second and third equations refer to the depth (cumulative GDP loss during the years of negative growth rates) and the length (number of years of negative rates of growth) of recessions, respectively. For depth and length, we constructed an unbalanced panel covering 91 countries and
17 years (1989-2005), which includes a total of about 200 crises. We use the same controls as for the rebound equation.
Previous literature has shown that the evidence on the effect of reforms on growth in transition countries is mixed. Babetskii and Campos (2007) carried out a meta-analysis of 43 econometric studies and found that the evidence on a positive effect on growth is rather weak. Interestingly, they find that a source of the weak results lies in the lack of control for potential endogeneity and reverse causality in the econometric studies. Controlling for endogeneity sharply improves the results and the evidence on the positive effect of reforms on growth in transition countries becomes much more robust.
In our approach, the sources of endogeneity appear weaker, as the focus of our empirical analysis is on episodes of crises, rather than average rate of growth in a given period. Furthermore, our indicator of reforms is ex ante and characterizes the countries just before the episodes of crises. Nevertheless, we admit that endogeneity and reverse causality may exist. Therefore, our analysis can be considered as merely stressing significant correlations between reform complementarities and the severity of the crisis.
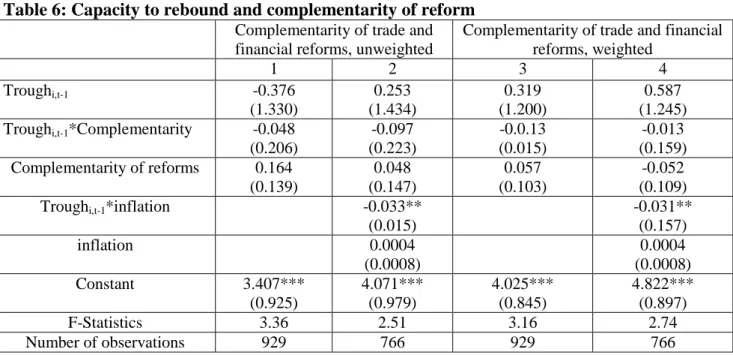
Results for the capacity to rebound equation are reported in table 6 below. They show that complementarity, whatever measure we use, does not affect the capacity to rebound, which confirms the result on the level of reforms contained in Table 4. This result seems puzzling. However, our interpretation is that during the rebound the economy recovers by using previously unused capacity accumulated during the recession. The pure recovery phase may therefore have little to do with efficient reallocation of resources, which is likely to depend on the extent and complementarity of reforms. Notice that a sound macroeconomic policy proxied by the rate of inflation matters for the rebound, which turns out to be stronger at lower rates of inflation.
Table 6: Capacity to rebound and complementarity of reform
Complementarity of trade and financial reforms, unweighted
Complementarity of trade and financial reforms, weighted 1 2 3 4 Troughi,t-1 -0.376 (1.330) 0.253 (1.434) 0.319 (1.200) 0.587 (1.245) Troughi,t-1*Complementarity -0.048
(0.206) -0.097 (0.223) -0.0.13 (0.015) -0.013 (0.159) Complementarity of reforms 0.164 (0.139) 0.048 (0.147) 0.057 (0.103) -0.052 (0.109) Troughi,t-1*inflation -0.033**
(0.015) -0.031** (0.157) inflation 0.0004 (0.0008) 0.0004 (0.0008) Constant 3.407*** (0.925) 4.071*** (0.979) 4.025*** (0.845) 4.822*** (0.897) F-Statistics 3.36 2.51 3.16 2.74 Number of observations 929 766 929 766
*: significance at the 10%; ** significance at the 5%; *** significance at the 1% Standard errors are in parenthesis below the coefficients
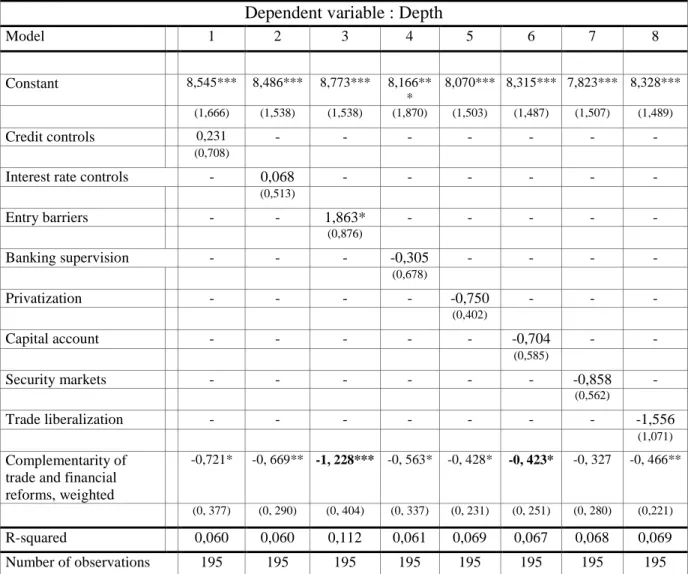
Different considerations apply to the depth and length of recessions. In this case, it is conceivable that complementarity of reforms play a role. Results for the depth and length equations are presented in tables 7 and 8 below.11 We report estimates only for the weighted measure of complementarity. Overall, reforms alone are never significant, which means that countries which have reformed less in a given area do not tend to have longer and deeper crisis.
Interestingly from our perspective, complementarity has the expected negative impact on depth and length. This holds for complementarity of financial reforms and complementarity of financial sector and trade reforms, both weighted and unweighted. 12 Using a different measure of complementarity, and taking into account the fact that policy dispersion can be caused by growth, Braga de Macedo et al. (2010) run 3SLS and show that policy dispersion reduces average growth. Their recent contribution is close to the results presented here.
11 Given that the number of crises in transition countries is quite limited we have not been able to run any econometric
exercise (see Appendix 3 for the listing of depth and length in transition countries). We checked that transition countries do not differ from the general pattern emerging from our broader sample (results available upon request).
12
Results with other measures of complementarity, with and without additional controls (inflation) yield the same conclusions, and are not reported here for saving space. They are available upon request.
Table 7: Depth of the crisis and complementary of financial and trade reforms, weighted
Dependent variable : Depth
Model 1 2 3 4 5 6 7 8 Constant 8,545*** 8,486*** 8,773*** 8,166** * 8,070*** 8,315*** 7,823*** 8,328*** (1,666) (1,538) (1,538) (1,870) (1,503) (1,487) (1,507) (1,489) Credit controls 0,231 - - - - (0,708)
Interest rate controls - 0,068 - - - -
(0,513) Entry barriers - - 1,863* - - - - - (0,876) Banking supervision - - - -0,305 - - - - (0,678) Privatization - - - - -0,750 - - - (0,402) Capital account - - - -0,704 - - (0,585) Security markets - - - -0,858 - (0,562) Trade liberalization - - - -1,556 (1,071) Complementarity of trade and financial reforms, weighted
-0,721* -0, 669** -1, 228*** -0, 563* -0, 428* -0, 423* -0, 327 -0, 466**
(0, 377) (0, 290) (0, 404) (0, 337) (0, 231) (0, 251) (0, 280) (0,221)
R-squared 0,060 0,060 0,112 0,061 0,069 0,067 0,068 0,069 Number of observations 195 195 195 195 195 195 195 195 *: significance at the 10%; ** significance at the 5%; *** significance at the 1%
Standard errors are in brackets.
Moreover, the results are quantitatively relevant. According to table 7, an increase in weighted complementarity by one standard deviation (equal to 2.532) can reduce the depth of the crisis by a factor ranging from 1.07 up to 3.11 percentage points (we take the max and min out of the complementarity coefficients, which are respectively -1.228 and -0.423 in table 7 and we multiply them by the standard deviation associated with the weighted measure of complementarity). Transition countries have followed very different transition patterns – reforms being implemented in a more or less consistent way or not implemented at all. For instance while the level of reform
complementarity is dramatically low in a country like Belarus13, even 15 years after the fall of the Berlin Wall, it stands at a very high level in Latvia14, close to the EU standard, especially from 2000 onwards. If Belarus were to attain the same level of complementarity as in Latvia, then according to our estimates the increase in growth could range from 1.31 to 3.82 percentage points.15
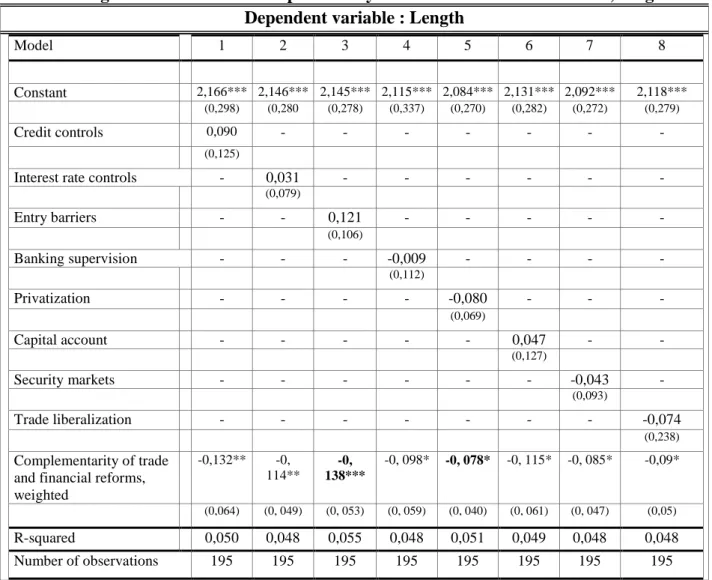
Table 8: Length of the crisis and complementary of financial and trade reforms, weighted Dependent variable : Length
Model 1 2 3 4 5 6 7 8 Constant 2,166*** 2,146*** 2,145*** 2,115*** 2,084*** 2,131*** 2,092*** 2,118*** (0,298) (0,280 (0,278) (0,337) (0,270) (0,282) (0,272) (0,279) Credit controls 0,090 - - - - (0,125)
Interest rate controls - 0,031 - - - -
(0,079) Entry barriers - - 0,121 - - - - - (0,106) Banking supervision - - - -0,009 - - - - (0,112) Privatization - - - - -0,080 - - - (0,069) Capital account - - - 0,047 - - (0,127) Security markets - - - -0,043 - (0,093) Trade liberalization - - - -0,074 (0,238) Complementarity of trade and financial reforms, weighted -0,132** -0, 114** -0, 138*** -0, 098* -0, 078* -0, 115* -0, 085* -0,09* (0,064) (0, 049) (0, 053) (0, 059) (0, 040) (0, 061) (0, 047) (0,05) R-squared 0,050 0,048 0,055 0,048 0,051 0,049 0,048 0,048 Number of observations 195 195 195 195 195 195 195 195 *: significance at the 10%; ** significance at the 5%; *** significance at the 1%
Standard errors are in brackets
Table 8 reports the results for the length of recession. Similarly to the analysis of the depth variable, reforms are not significant when they are considered one by one, but complementarity matters, whatever the specification. However, quantitatively the effect is not very large. An increase in
13 The level of weighted complementarity stands at 5.5 for Belarus. See Appendix 2. 14 The level of weighted complementarity stands at 8,61 for Latvia. See Appendix 2. 15
3.82 = 3.11 (the difference in complementarity of trade and financial reforms weighted), times minus 1,228 (the maximum value out of the estimates in table 7).
weighted complementarity by one standard deviation can reduce the length of the crisis by a factor ranging from 0.19 up to 0.35 year, that is about 2.37 and 4.19 months (as for depth, we take the max and min out of the complementarity coefficients and we multiply them by one standard deviation). Consider again the above scenario with Belarus reaching the level of complementarity achieved in Latvia, the length of recessions would decrease by a period ranging from 2.91 to 5.15 months.
Results on depth and length of recessions are in line with those obtained by Braga de Macedo et al. (2010) for the average growth rate. Putting together our results on the three dimensions, rebound, depth and length, it emerges a picture in which the effect on average growth found in the previous literature is likely to arise because of the effect of complementarity on the depth and length of recessions, rather than in the rebound period. In summary, piecemeal reforms seem to expose countries to more severe contractions in economic activity.
5. Concluding remarks
In this paper we analyzed the growth experience in the first twenty years of transition from a comparative perspective. We followed the lead of recent theoretical and empirical analysis of growth and development and tried to analyze growth in transition in a unified framework including the initial transitional recession, the subsequent recovery and growth and the subsequent episodes of crises experienced by transition countries.
Our results suggest that in terms of growth transition has been disappointing in CIS countries, whereas has produced positive effects in CEE countries. We tried to link such results to the different reform paths followed by the two groups of countries. We conjectured that the still incomplete reform process, the piecemeal approach followed by CIS countries might be one of the explanations for the dismal results in terms of growth displayed by CIS countries in the first 20 years of transition. Our analysis is extremely partial and focuses only on one dimension of economic performance, namely real GDP growth. Nevertheless, we feel that any type of broader analysis cannot neglect the role of growth as an indicator of success of transition.
From the evidence presented in the paper we draw three main conclusions, which are relevant as well for future research. First, the comparative perspective provides useful information on the specific features of transition countries. Analyses based on samples composed solely by transition countries neglect extremely useful information and can thus be misleading. Second, analyses based on average rates of growth, as typically done in the literature, may as well produce misleading results, as the role of initial conditions and policies may vary significantly depending on whether countries are in periods of deep recession, periods of recovery or period of sustained growth. Finally, as already explored in the literature (Braga de Macedo and Oliveira Martins (2008) and Braga de Macedo et al. (2010)), the impact of reforms crucially depends on the complementarity of reforms. Focusing on two specific dimensions, namely reforms affecting the financial sector and trade liberalization, we showed that reform complementarity has an impact on output performance mainly through the depth and length of recessions, rather than the rebound of the economy following recessions.
References
Abiad, Abdul, Enrica Detragiache and Thierry Tressel, 2008, “A new Database of Financial Reforms”, IMF Working Paper, IMF/08/266, 28 pages
Aghion, Philippe and Olivier Blanchard, 1994, “On the Speed of transition in Central Europe”, in NBER Macroeconomics Annual 1994. Stanley Fisher and Julio Rotemberg, eds. Cambridge: MIT Press, pages 283-320.
Babetskii, Jan and Nauro F.. Campos, 2007, “Does reform work? An econometric examination of the reform growth puzzle”, CEPR Discussion Paper 6215.
Braga De Macedo, Jorge and Joaquim Oliveira Martins, 2008. "Growth, reform indicators and policy complementarities," The Economics of Transition, The European Bank for Reconstruction and Development, vol. 16(2), pages 141-164, 04.
Braga De Macedo, Jorge, Oliveira Martins, Joaquim and Bruno Rocha, 2010. “Policy Complementarities and Growth", in Political Economy, Measurement and Effects on Performance, Ifo/CESifo & OECD Conference on Regulation.
Campos, Nauro F. and Fabrizio Coricelli, 2002. “Growth in Transition: what we know, what we don’t, and what we should”, Journal of Economic Literature, Vol. XL, pages 793-836.
Campos, Nauro F. and Fabrizio Coricelli, 2009. "Financial liberalization and democracy: The role of reform reversals," CEPR Discussion Papers 7393
Campos, Nauro F and Roman Horváth, , 2006. “Reform Redux: Measurement, Determinants and Reversals”, CEPR Discussion Papers 5673.
Campos, Nauro, Cheng Hsiao and Jeffrey B. Nugent, 2009, "Crises, What Crises? New Evidence on the Relative Roles of Political and Economic Crises in Begetting Reforms," IZA DP.
Cerra, Valerie and Sweta Chaman Saxena, 2008, “Growth Dynamics: the Myth of Economic Recovery”, IMF Working Paper, IMF/05/147, 43 pages.
Cetorelli, Nicola and Gambera, M., 2001, “Banking Market Structure, Financial Dependence and Growth: International Evidence from Industry Data”. The Journal of Finance, 56(2), pp. 617-648. Chadha, Bankhim and Fabrizio Coricelli, 1997, “Fiscal Constraint and the Speed of Transition”, Journal of Development Economics, Vol. 52:1, pages 219-247.
Christiansen, Lone E., Schindler, Martin and Thierry Tressel, 2009. “Growth and Structural Reforms: A New Assessment”, IMF Working Paper No. 09/284.
Drazen, Allan and William Easterly (2001). “Do Crises Induce Reform? Simple Empirical Tests of Conventional Wisdom”, Economics and Politics, 13:2, pages 129-158.
Furman, Jason and Joseph Stiglitz, 1998, “Economic Crises: Evidence and Insights from East Asia”, Brookings Papers on Economic Activity, 1998(2), pages 1-114.
Giavazzi, Francesco and Guido Tabellini (2005). “Economic and Political Liberalizations”, Journal of Monetary Economics, 52, pages 1297-1330.
Laeven, Luc and Fabien Valencia, 2008, “Systemic Banking Crises: A New Database,” IMF Working Paper 08/224 (Washington: International Monetary Fund).
Parente, Stephen L. and , Edward C. Prescott, 2005. "A Unified Theory of the Evolution of International Income Levels," Handbook of Economic Growth, in: Philippe Aghion & Steven Durlauf (ed.), Handbook of Economic Growth, edition 1, volume 1, chapter 21, pages 1371-1416 Elsevier.
Pitlik, Hans and Steffen Wirth (2003), “Do crises promote the extent of economic liberalization? An empirical test”, European Journal of Political Economy, 19: pages 565–581.
Sarkees, Meredith Reid, 2000, “The Correlates of War Data on War: An Update to 1997,” Conflict Management and Peace Science, Vol. 18, No. 1, pp. 123–44. Available at:
www.correlatesofwar.com
Wacziarg, Romain and Karen Horn Welch. 2008, "Trade Liberalization and Growth: New Evidence." World Bank Economic Review 22, 2 (June 2008): 187-231.
World Bank, 2008, Unleashing Prosperity Productivity Growth in Eastern Europe and the Former Soviet Union.
Appendix 1: Real GDP levels by (transition) country, base 100 = 1990 A. Eu-10 countries
B. CIS countries
C. Western Balban countries
Appendix 2: Reform indicators by (transition) country Country Credit Controls Interest Rates Controls Entry Barriers Banking Supervision Privatization Capital Account Security Markets CEECs Bulgaria Mean 2,25 2,07 2,80 0,87 1,00 2,07 0,93 Var 0,72 1,07 0,17 0,70 1,71 0,78 0,07 Czech Rep Mean 1,73 2,81 2,88 1,44 1,69 1,75 2,50 Var 0,28 0,56 0,12 0,40 1,43 2,07 1,20 Estonia Mean 2,45 3,00 2,80 1,73 2,33 2,60 2,27 Var 0,20 0,00 0,17 1,78 1,38 0,69 1,50 Hungary Mean 1,73 3,00 2,63 2,06 1,75 2,31 2,25 Var 0,13 0,00 0,25 1,26 2,07 1,03 0,87 Lituania Mean 1,88 2,71 2,93 1,43 1,29 2,79 1,93 Var 0,24 0,53 0,07 0,73 1,60 0,64 1,30 Latvia Mean 2,89 3,00 2,79 1,93 2,57 2,79 1,93 Var 0,16 0,00 0,18 1,15 1,19 0,64 1,30 Poland Mean 1,36 3,00 2,94 1,75 0,69 1,88 2,75 Var 0,09 0,00 0,06 1,93 0,50 2,25 0,60 Romania Mean 1,41 2,81 2,88 1,19 0,63 1,06 2,19 Var 0,14 0,56 0,25 0,70 1,05 1,40 1,76 CIS Azerbaidjan Mean 2,33 2,33 1,80 0,47 0,07 2,47 0,67 Var 0,81 0,95 1,89 0,55 0,07 0,84 0,24 Belarus Mean 1,50 0,00 3,00 0,93 0,00 1,36 2,86 Var 0,00 0,00 0,00 0,07 0,00 0,71 0,29 Georgia Mean 1,95 3,00 2,40 1,73 2,00 2,80 1,60 Var 0,23 0,00 0,69 1,35 2,14 0,17 0,26 Kazakhstan Mean 2,30 2,07 1,07 1,47 2,00 0,93 0,93 Var 0,68 1,50 0,07 0,70 1,00 0,07 0,64 Kyrgystan Mean 2,05 2,33 2,67 0,80 1,53 2,60 0,73 Var 0,68 1,52 0,24 0,31 1,41 1,11 0,21 Russia Mean 2,60 3,00 3,00 0,92 1,00 2,00 2,31 Var 0,34 0,00 0,00 0,08 0,00 0,50 1,40 Ukraine Mean 1,45 2,67 3,00 1,13 1,20 0,93 0,93 Var 0,04 0,24 0,00 1,70 1,03 0,35 0,07 Uzbekistan Mean 0,85 0,67 1,53 1,07 0,00 0,40 0,80 Var 0,31 0,24 1,55 0,64 0,00 0,26 0,17
country Trade liberalization Financial reforms Compl., financial reforms only Compl., financial reforms and trade,
Compl., financial reforms and trade, CEECs
Bulgaria Mean 0,36 0,57 5,07 5,77 6,60
Var 0,24 0,04 1,45 1,32 3,40
Czech Rep Mean 0,36 0,70 5,63 6,22 7,61
Var 0,24 0,05 2,42 2,74 4,67 Estonia Mean 0,00 0,82 6,13 5,82 8,14 Var 0,00 0,06 1,69 1,95 3,83 Hungary Mean 0,38 0,75 6,06 6,71 8,09 Var 0,24 0,06 1,16 1,00 3,05 Lituania Mean 0,32 0,71 5,73 6,31 7,75 Var 0,22 0,05 1,80 2,09 3,48 Latvia Mean 0,32 0,85 6,27 6,81 8,61 Var 0,22 0,04 1,46 1,78 2,81 Poland Mean 0,38 0,68 5,27 5,88 7,15 Var 0,24 0,04 2,14 2,10 4,21 Romania Mean 0,34 0,58 4,78 5,33 6,43 Var 0,23 0,05 2,61 3,10 4,73 Slovakia Mean 0,36 Var 0,24 Slovenia Mean 0,36 Var 0,24 CIS Azerbaidjan Mean 0,48 4,02 Var 0,02 1,02 Belarus Mean 0,00 0,46 4,03 3,93 5,50 Var 0,00 0,00 0,22 0,27 0,53 Georgia Mean 0,74 5,98 Var 0,05 1,50 Kazakhstan Mean 0,00 0,51 5,15 4,88 6,83 Var 0,00 0,03 1,21 1,40 2,73 Kyrgystan Mean 0,30 0,61 5,04 5,55 6,78 Var 0,21 0,04 3,14 4,08 5,50 Russia Mean 0,00 0,71 5,80 5,66 7,92 Var 0,00 0,01 0,37 0,48 0,93 Tajikistan Mean 0,26 Var 0,19 Ukraine Mean 0,00 0,54 4,96 4,59 6,42 Var 0,00 0,02 1,38 1,36 2,66 Uzbekistan Mean 0,00 0,25 3,58 3,08 4,31 Var 0,00 0,03 3,23 3,50 6,85
Appendix 3: Depth & Length of the crisis by (transition) country A. Eu-10 countries
Country Recession Type of crisis Date Lenght Depth
1 Government change & trade
liberalisation 1989 4 23.98 2 Banking crisis & trade liberalisation 1995 2 14.47 Bulgaria
Average . . 3.5 20.48
1 Banking crisis & trade liberalisation 1989 3 13.12 2 trade liberalisation 1996 2 1.48 Czech
Republic
Average . . 2 6.78
1 Government change & civil war 1989 3 35.28 2 Government change 1998 1 0.86 Croatian
Average . . 1.5 15.60
Hungary 1 Trade liberalization, Government change
& banking crisis in 1991 1989 4 18.05
1 Government change & trade
liberalisation in 1993 1989 5 46.66 2 trade liberalisation 1998 1 1.70 Lituania
Average . . 3 24.18
1 Government change 1989 4 48.10 2 Banking crisis & trade liberalisation 1994 1 0.94 Latvia
Average . . 2 24.52
Poland 1 Trade liberalization, Government
change & banking crisis 1989 2 17.79
1 Civil war, Government change &
banking crisis 1988 4 29.39 2 trade liberalisation & banking crisis 1996 3 11.67 Romania
Average . . 3.5 20.53
Slovakia 1 Trade liberalisation & banking crisis 1989 4 25.31 Slovenia 1 Trade liberalisation in 1991 1989 3 20.34
Country Recession Date (average) Length Depth
1 1989 3.6 27.80
2 1996 1.7 5.19
EU-10 countries
B. CIS countries
Country Recession Type of crisis Date Lenght Depth
Armenia 1 Government change & civil war 1989 4 56.60 Azerbaidjan 1 Government change & civil war 1989 6 63.04 Belarus 1 Government change in 1991 1989 6 36.67
Georgia 1 NA 1989 7 76.53
1 Government change in 1991 1989 6 38.84
2 . 1997 1 1.90
Kazakhstan
Average . . 3.5 20.37
1 Government change & banking crisis 1990 5 49.30 2 Trade liberalisation 2001 1 0.02 3 Trade liberalisation & gvt change 2004 1 0.18 Kyrgyzstan Average . . 3.5 16.50 1 Government change 1989 7 63.57 2 Trade liberalisation 1997 2 9.68 Moldova Average . . 3.5 36.62 1 Government change 1989 7 41.91 2 Banking crisis 1997 1 5.30 Russia Average . . 3.5 23.61
Tajikistan 1 Government change & civil war 1989 7 68.48 Turkmenistan 1 Government change 1990 7 48.41 1 Government change 1989 7 59.54
2 Banking crisis 1997 2 2.27
Ukraine
Average . . 3.5 30.91
Uzbekistan 1 Government change 1990 5 18.90
Country Recession Date (average) Length Depth
1 1989 6.1 53
2 1998 1.4 3.8
3 2004 1 0.18
CIS countries
C. WB countries
Country Recession Type of crisis Date Lenght Depth
1 Government change 1989 3 39.15 2 Government change & trade liberalisation 1996 1 10.20 Albania
Average . . 2 24.67
1 Government change & banking crisis in
1993 1989 6 29 2 Trade liberalisation 2000 1 4.53 Macedonia Average . . 3.5 16.76 1 Civil war in 1991 1989 4 59.38 2 NA 1998 1 18 Serbia Average . . 2.5 38.69
Country Recession Date (average) Length Depth
1 1989 4.3 42.51
2 1998 1 10.91
WB countries
![[PDF] Formation sur le Traitement du signal avec Audacity | Formation informatique](data:image/gif;base64,R0lGODlhAQABAIAAAP///wAAACH5BAEAAAAALAAAAAABAAEAAAICRAEAOw==)