HAL Id: halshs-03165718
https://halshs.archives-ouvertes.fr/halshs-03165718
Preprint submitted on 12 Mar 2021
HAL is a multi-disciplinary open access archive for the deposit and dissemination of sci-entific research documents, whether they are pub-lished or not. The documents may come from teaching and research institutions in France or abroad, or from public or private research centers.
L’archive ouverte pluridisciplinaire HAL, est destinée au dépôt et à la diffusion de documents scientifiques de niveau recherche, publiés ou non, émanant des établissements d’enseignement et de recherche français ou étrangers, des laboratoires publics ou privés.
Democracy and the Politicization of Inequality in Brazil,
1989-2018
Amory Gethin, Marc Morgan
To cite this version:
Amory Gethin, Marc Morgan. Democracy and the Politicization of Inequality in Brazil, 1989-2018. 2021. �halshs-03165718�
Democracy and the Politicization of Inequality
in Brazil, 1989-2018
Amory Gethin
Marc Morgan
March 2021
1
Democracy and the Politicization of Inequality in Brazil, 1989-2018
*Amory Gethin Marc Morgan
3 March 2021
Abstract
This paper analyses the transformation of electoral cleavages in Brazil since 1989 using a novel assembly of electoral surveys. Brazilian political history since redemocratization is largely a history of the rise and fall of the Workers’ Party (Partido dos Trabalhadores, PT). We show that the election of Lula da Silva as President in 2002, followed by the implementation of redistributive policies by successive PT governments, was at the origin of the marked socio-economic cleavages that emerged. In a relatively short space of time the PT transformed itself from a party of the young, highly educated, high-income elite of the Southern party of the country, to a party of the poor and lesser educated voters, increasingly located in the disadvantaged region of the Northeast. Controlling for a host of socio-demographic factors, a voter in the Northeast was 20 percentage points more likely to vote for the PT in 2018 than voters in other regions, compared to being 5 percentage points less likely to do so in 1989. In sharp contrast to other western democracies, political conflict in Brazil has followed an increasingly unidimensional class-based path. This culminated in the unification of elites and large parts of the middle class behind Bolsonaro in the 2018 presidential election. We argue that contextual policy-driven factors and programmatic alliances are key to understand the PT’s singular evolution, and thus the transformation of electoral cleavages in Brazil.
* Amory Gethin (amory.gething@psemail.eu), Marc Morgan (marc.morgan@psemail.eu): Paris School of
Economics – World Inequality Lab. We thank Gedeão Locks, Clara Martínez-Toledano, Thomas Piketty, and
2
1. Introduction
How have political cleavages developed over the course of redemocratization in Brazil, one of the world’s largest and most unequal countries? This is what we analyze in this paper. The legacies of economic, educational, racial and geographic inequalities in Brazil have left fertile ground for political polarization along social dimensions. Since the end of the military dictatorship in 1985 and the dawn of the New Republic in 1988, Brazilian party politics have been defined by the electoral strategies of the hegemonic party on the left, the Workers’ Party (Partido dos Trabalhadores, PT). The rise of petismo in Brazil is interesting in a comparative perspective, as it shows how the consolidation of new divisions between social groups coincides with the concrete implementation of policies and the transformation of ideological affiliations. How has the electoral basis of the PT changed since 1989 and what are the implications of these changes in terms of the political salience of different forms of inequality? How can we explain the slow decline of the PT in the 2010s and the victory of Jair Bolsonaro, from the conservative Social Liberal Party (Partido Social Liberal, PSL), in 2018?
To answer these questions, we analyze electoral behaviors in Brazil since 1989 by combining a set of polls conducted by the Datafolha institute just before the second round of all presidential elections.1 To the best of our knowledge, these surveys have never been employed in a systematic way for the purposes of our analysis. In brief, we find that the PT underwent an exceptional political metamorphosis, from a party of the young, highly educated, high-income, elite to a party of the poor, increasingly located outside of the party’s foundational locus in the south, particularly in the historically conservative Northeast. We argue that the key to understand both this evolution and the party’s subsequent fall to Bolsonaro in 2018 are contextual policy-driven factors and programmatic alliances. Importantly, we highlight how the extreme class polarization that emerged in Brazil over the 2000s is linked to how economic growth was distributed among the population by a party balancing policy priorities and feasibility.
1 See appendix Table A2. The focus on presidential elections is limited by the data, but they are an important
3
The remainder of the article is structured as follows. Section 2 describes the historical evolution of the political system in Brazil from independence until the present day. Section 3 presents our first set of results and analysis on voting patterns by income and education, linked to the development of the welfare state. Section 4 looks at regional characteristics and determinants. Section 5 presents findings on other sociological determinants of electoral behavior, such as race, occupation, religion and gender. Section 6 examines the factors leading to the election of Bolsonaro in 2018. Section 7 concludes.
2. Brazilian Democratization in the Long Run of History
2.1 A Legacy of Extreme Electoral Inequality
It was only thirty years ago that Brazil definitively adopted the democratic principle of ‘one adult person, one vote’. Prior to 1989, social distinction and economic inequality dominated Brazil’s history, at least since the settlement of Europeans around the turn of the 16th century. After its independence from Portugal in 1822, only domestically born, literate, rich male Catholics aged 25 and over could vote. An electoral law of 1881 extended the suffrage to non-Catholics and naturalized citizens, but it still officially excluded poor literates, women, slaves and the illiterate, which in total made up at least 85 percent of the voting age population.2 Brazil became the last country in the Western hemisphere to abolish slavery in 1888, three years before the new Republican constitution. Yet, in practice, Afro-Brazilians continued to be politically discriminated thereafter due to their low education, and restricted access to land. While income and gender requirements for voting were abolished in 1891 and 1934, respectively, the political exclusion of the most underprivileged members of society was maintained for another century, until the 1988 constitution removed the literacy requirement, at a time when approximately 20 percent of the voting-age population were still illiterate (see Figure 1).
Given the early restrictions on participation, it is not surprising that such a limited proportion of the age-eligible population voted. In the final parliamentary elections of the Empire
4
1889) in 1886 this proportion was only 2 percent (see Figure 1). Inspired in the British system, parliamentary majorities alternated between Liberals and Conservatives under the auspices of the Emperor (Love 1970). Then, during the period known as the ‘Old Republic’ (1891-1930), voters made up 5-6 percent of the voting age population,3 barely changing throughout the three decades. During this time, Brazilian politics was dominated by state-level factions of the conservative Republican Party, especially those of the rich states of São Paulo and Minas Gerais.This elite democracy was interrupted during Getúlio Vargas’ 1930 Liberal Alliance revolution and his ‘populist’ reign until 1945. In particular, between 1937 and 1945, he established a dictatorship (Estado Novo) in which he appointed state governors, who in turn named municipal prefects.
The ballot of 1945 and the constitution of 1946, which established the Second Republic, brought free and more contested elections for almost twenty years until the military coup d’état of 1964. A marked increase in voter participation, following the continued expansion of literacy, can be observed during this era. However, despite the democratic progress the proportion of voters remained comparatively low. For example, the 1960 presidential election in Brazil mobilized only 18 percent of the total population, compared to 44 percent in Argentina’s 1958 presidential election (Love 1970).
Therefore, for at least the first-half of the twentieth century Brazil seemed to be in a vicious cycle whereby mass political voice was restricted by literacy requirements on voting, which mainly favored urban inhabitants. This made executive power much more dependent on the urban Brazil. Parliamentary representation, on the other hand, was anchored to the total population of voting constituencies, and given that the majority of the country’s population still lived in rural areas during this period, an important urban-rural political cleavage emerged (Furtado 1965)4. Since illiteracy was greater in rural areas, the traditional rural landed-class
maintained control of congress. The cleavage between the urban-orientated ‘populist’ executive and the rural-dominated ‘patriarchal’ legislature was at the origin of much of the
3 Presidential elections of the first Republic in 1894 and 1898.
4 The share of the population living in rural areas according to the Census was 64% in 1950, and 55% in 1960
5
political instability in early 1960s, which fed into the military coup of 1964 on the Labor Party executive of João Goulart (Morgan and Souza 2019).
The military dictatorship (1964-1985) abolished the elections for the President of the Republic and State Governors for the large part of its reign, banning all previously existing parties. Direct elections could only be held for federal and state deputies and municipal councilors among permissible candidates, because a two-party system was imposed, with on one side the military’s National Renewal Alliance (Aliança Renovadora Nacional, ARENA), and on the other side the artificial ‘catch-all’ opposition, the Brazilian Democratic Movement (Movimento Democrático Brasileiro, MDB). The 1979 reforms saw the military government abandon the two-party system in order to split the opposition, which was gaining electoral ground. ARENA was dissolved and replaced by the Democratic Social Party (Partido Democrático Social, PDS), while the MDB rebranded into the PMDB. New parties were formed including the leftist Worker’s Party (Partido dos Trabalhadores, PT) and the centre-right Brazilian Social Democracy Party (Partido da Social Democracia Brasileira, PSDB). Literacy had increased dramatically until the new Republican constitution, which ended its requirement. Since then, the share of voters has stabilized at around 75-80 percent of adults.5 The importance of income and education for electoral participation was further attenuated by other equally important policies, such as holding elections on Sundays, free media access to electoral campaigns and electronic voting (Arretche ed. 2019).
2.2 Redemocratization and the Rise of Petismo
5 In theory this proportion should be close to 100 percent given compulsory voting for persons aged 18 and over.
The 20 percent gap may be due to the fact that voting is still voluntary for illiterates (between 20 percent and 7 percent of the adult population during this period) for citizens above 70 years of age, for those who are sick on
polling day and those not in their constituency due to state service on voting day. Literate adults aged between 18 and 70 who miss three consecutive elections without a justification are subject to a fine of 3 to 10 percent of the minimum wage. If the fine is not paid, they risk becoming ineligible for civil servant positions, among other
6
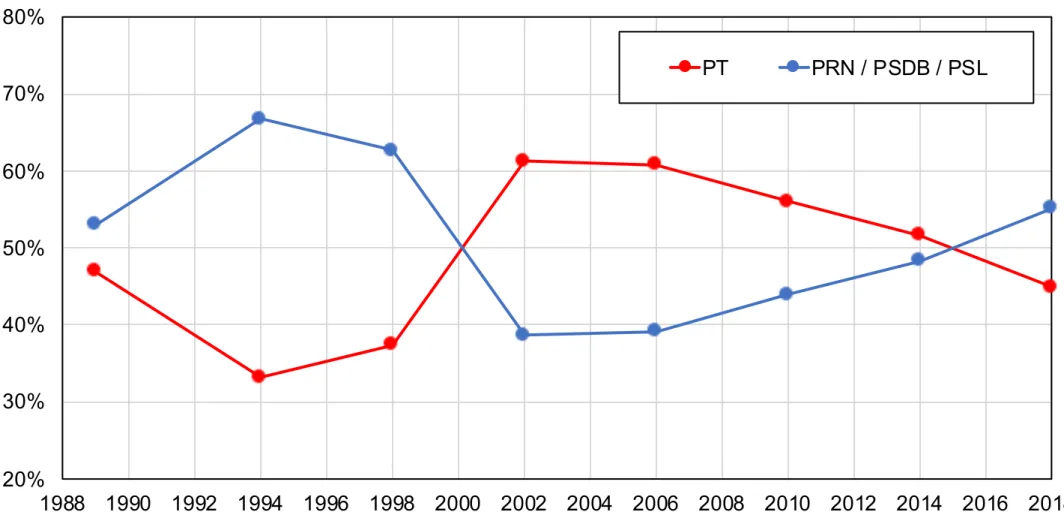
Brazil held its first universal presidential election in 1989, following the promulgation of the new constitution of 1988. The election marked a new era of political activity. It opposed as much as twenty-two candidates in the first round, representing a diversity of ideological affiliations. Fernando Collor de Mello, from the conservative PRN (Partido da Reconstrução Nacional), received over 30 percent of votes in the first round, and was elected president of Brazil in the second round with 53 percent of popular votes against PT candidate Lula da Silva (see Figure 2). Collor’s presidency was marked by the implementation of a neoliberal program aimed primarily at curbing hyperinflation. This involved the privatization of public companies, opening to free trade, and cuts in public spending. In 1994, Fernando Henrique Cardoso of the PSDB, whose policies as Minister of Finance had been efficient at fighting inflation, won the presidential election directly in the first round with 54.3 percent of votes (Lula only received 27 percent) and was re-elected in 1998 with 51.1 percent of popular support (against 31.7 percent for Lula). Cardoso continued Collor’s privatization programs, but he was also the first president to implement large-scale social policies, such as the 2001 Bolsa-escola, a program of transfers dedicated to stimulate school participation, or the Auxílio-gás which subsidized cooking gas for poor families.
Following Brazil’s currency crisis, which started just after Cardoso’s re-election, slower growth and rising unemployment eroded popular support for the leader of the PSDB. In 2002 Lula, demanding a new brand of politics, won the election in the second round with 61.3 percent of votes. Due to great uncertainty in financial markets prior to the election, Lula penned the Carta ao povo brasileiro, a text in which he promised not to maintain the financial-monetary policy of Brazil if he won. His two terms (2002-2006 and 2006-2010) were marked by the implementation of vast public welfare and investment policies, and also by vote-buying scandals. A year before the 2006 election, the PT entered into a tacit alliance with the established PMDB after the Mensalão corruption case threatened to bring down the president. As the direct heir to the only opposition party during most of the dictatorship, the PMDB was a decisive parliamentary force in the subsequent decades, often the largest single party in congress.6 Prior to this alliance the PT relied on punctual parliamentary support to implement
7
its program. This support was arithmetically unstable given the large and growing number of parties in congress and the appearance of corruption cases in the PT.7
In 2010, Dilma Rousseff was elected president with the objective to extend Lula’s achievements. She was re-elected by a tight margin in 2014 against the PSDB candidate Aécio Neves with 51.64 percent of votes. In 2016, during the sharpest recession the country had experienced since the early 1980s, alleged accounting manipulations in the budget initiated an impeachment process against Rousseff, which saw vice-president Michel Temer (PMDB) take over the role. The process was preceded by the termination of the PT-PMDB alliance, which would explode with the on-going revelations of the Lava Jato bribery investigations. The 2018 election occurred in a context of exceptional political and ideological polarization. Lula, then in prison for corruption charges, was refused the possibility to run as the PT’s candidate. He was replaced by his running mate, the former mayor of São Paulo Fernando Haddad. Jair Bolsonaro – a former military captain, and congressman for 27 years – of the far-right Social Liberal Party (PSL) topped the first round of the presidential election with 46 percent of votes against only 29 percent for Haddad and 12 percent for Ciro Gomes of the PDT. Bolsonaro was elected president with 55 percent of votes in the second round, promoting an economically liberal (pro-market) and socially conservative agenda (strongly opposing same sex-marriage, abortion and secularism), with a strong anti-political-elite stance (especially on the PT and its left-wing partners).
2.3 From Collor de Mello to Bolsonaro: Political Transitions and Economic Change
As documented above, political change in Brazil since redemocratization can be defined by the rise and fall of the PT. These changes coincided with the improved macroeconomic conditions of the 2000s, the sharp recession of the mid-2010s, and the growing salience of corruption scandals. The victory of Bolsonaro in 2018 can in large part be attributed to unique contextual factors. That being said, party politics in Brazil go beyond the restricted role of charismatic leaders and short-term material gains.
8
In spite of a political system characterized by high party fragmentation and vote-seeking strategies, the PT emerged in the 1980s as a radical left party with a strong ideological and organizational basis (Ames 2001; Secco 2011). The party originally mobilized large networks of highly educated, middle-class urban populations who believed in the viability of socialism and in the party’s redistributive stance. During the 1990s, however, popular support for Cardoso’s Plano Real “suggested that the PT’s promises to combat deep structural causes of poverty and inequality (for example, land distribution) were much less attractive to poor voters than immediate albeit limited improvements” (Hunter 2007). The PT’s victory in 2002 was largely the result of a strategic shift to the center-left, even if some fundamental ideologies were still represented, which ensured the support of unions and the urban middle class (Samuels 2004; Hunter 2007). Even if Lula’s welfare programs should be thought of in continuity with previous governments, there is extensive evidence that minimum wage increases and welfare programs during his first mandate, and in particular the Bolsa Família, led to a dramatic change in the Workers’ Party’s voting base, as poor voters, especially those concentrated in the historically deprived states of the Northeast, with low levels of economic security massively turned towards the PT (Hunter and Power 2007; Zucco and Power 2013). Since then, the PT’s core principles and policy proposals have remained in line with the ideological underpinnings set during this period.
The second Lula government was marked by higher economic growth than the preceding term, a period often referred to as the Milagrinho (“Mini Miracle”). This shift was spurred mainly from the domestic expenditure side, as federal investments expanded at around 28 percent per year. Household consumption doubled its growth from the preceding period, while the real value of the minimum wage and of social assistance transfers continued to rise (Carvalho 2018). These injections made Brazil quite robust to the global financial crisis, allowing Lula to leave office with high approval ratings. But these indicators began to slow down during Dilma’s first term. The price of commodities fell over the period, depressing the value of exports, while the government cut back on spending and increasingly turned to supply-side polices (tax and credit policy) to steer the economy, which precipitated a domestic recession during the PT’s final two years in power.
9
The structure of income inequality in Brazil is unique in the concentration observed at the very top of the distribution, where 150,000 people accumulate close to 15 percent of the country’s national income (Assouad, Chancel and Morgan 2018). It has also always been characterized by a tight relationship between low intergenerational mobility and a strong education gradient. Since the 1988 Constitution, the general level of education has expanded significantly, with the share of individuals having attempted to study at university rising from 8 percent to 24 percent, while the share of illiterates and primary educated decreased from 70 percent to 26 percent between 1989 and 2018.8 That being said, educational inequalities remain very
significant: as much as 10 percent of the voting age population declared having never completed primary education in 2018.
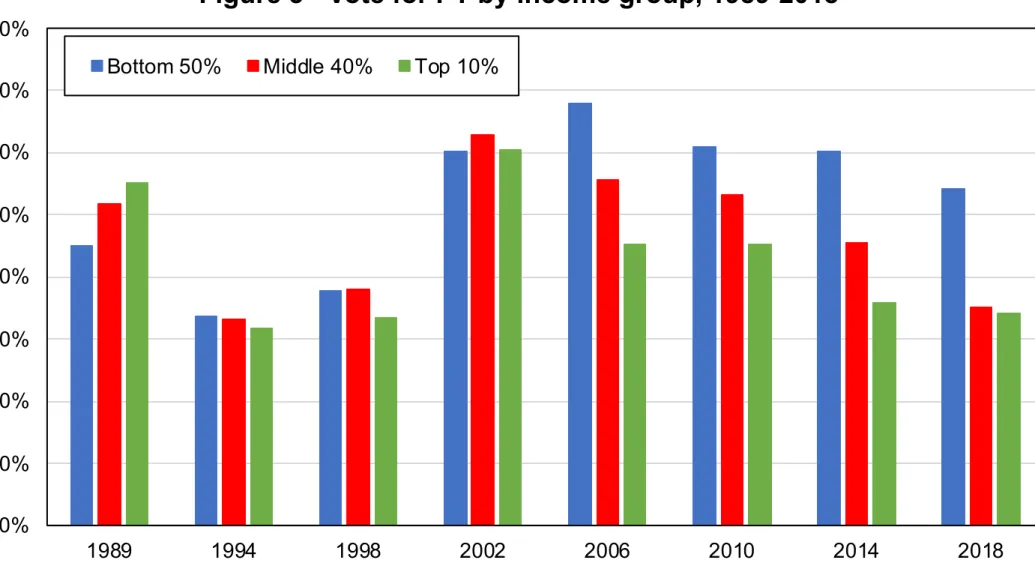
How have these inequalities translated into different forms of political representation since 1989? Figure 3 shows the share of votes received by the PT among three broad groups: the poorest 50 percent, the next 40 percent, and the richest 10 percent of earners.9 A complete reversal of the link between income and support for the PT has gradually occurred in the past thirty years. In 1989, support for the PT was highest in the top decile; in 2018, by contrast, low-income voters had become substantially more likely to vote for the PT than other voters. Two separate phases can be identified. In the elections of 1994, 1998 and 2002, income was not significantly associated with vote choice in the second round of presidential elections. This corresponds to the period of widespread support for Cardoso’s macroeconomic policies, which were not particularly targeted at specific groups, as well as Lula’s landslide victory in 2002. This election was followed by a clear rupture in 2006: the share of top 10 percent voters supporting Lula dropped by 15 percentage points, while the share of bottom 50 percent voters supporting him increased significantly. This goes in line with the electoral impact of new social investment policies, in particular concerning Bolsa Família, the minimum wage and the expansion of public services outside of cities.
8 See appendix Table A3.
9 We focus on the determinants of support for the PT in the second round of presidential elections. This has the
advantage of showing how voters have been divided into two broad coalitions representing different ideological
10
Higher support for the PT among poorer earners continued in the elections of 2010, 2014 and 2018, even though the PT did receive decreasing vote shares among all voters. A particularly interesting evolution is the unprecedented convergence of the middle class and the elites in the last election: while the middle 40 percent were less likely to vote against the PT than the top 10 percent in 2006, 2010 and 2014, they became approximately as likely to do so in 2018. The 2018 election, therefore, divided the electorate into two groups: the poor, who voted in majority for Fernando Haddad, and the rest of the population which was more biased against the PT than in any other election.10
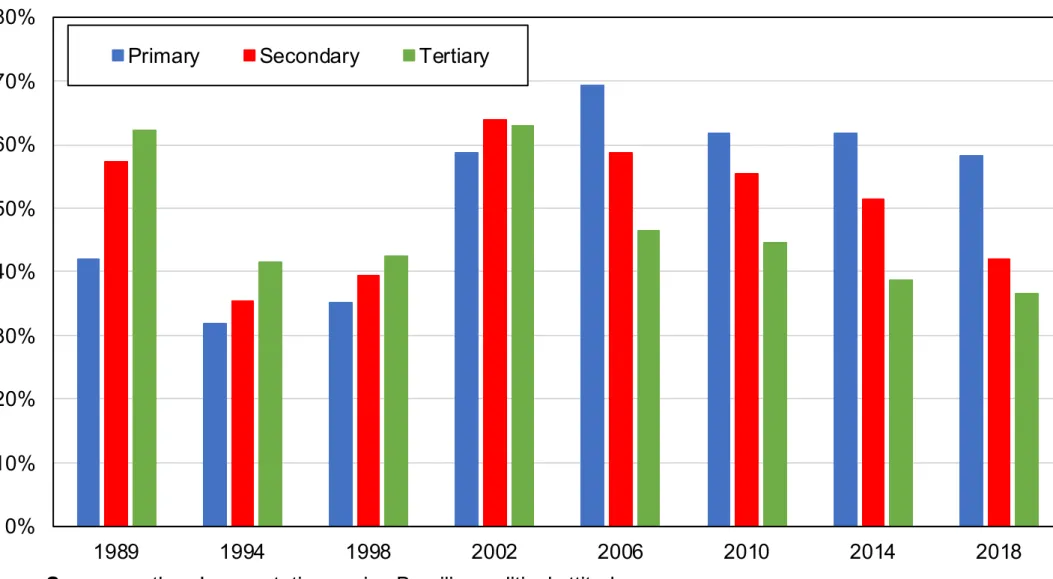
The same reversal is visible when looking at education (Figure 4). In 1989, about 62 percent of tertiary-educated voters voted for Lula, compared to only 42 percent of illiterates or voters with only primary education; in 2018, it was almost the exact opposite. Interestingly, a difference with the income gradient is that the PT was consistently supported by higher educated voters in 1994 and 1998, while top income earners were not more or less likely to vote for Lula in these two elections. This is consistent with the existing literature which points to the educated “middle class” as being the original supporters of the PT.
Figure 5 plots the difference between the share of poorest 50 percent earners voting PT, and the share of top 50 percent voting PT between 1989 and 2018, before and after controlling for other individual variables. There has been a complete reversal in the relative support of the PT among the poor: they used to be more supportive of conservative parties and have gradually become significantly biased towards the Workers’ Party. Controlling for education, age, gender, region and rural-urban location does reduce the independent importance of income.11
This is because higher support for the PT among the poor is in part due to increasing votes
10 Unfortunately, the income variable available from Datafolha surveys does not allow further decompositions of
votes within the bottom 50 percent. Evidence from the Comparative Study of Electoral Systems does however
suggest that support for the PT also decreases with income within the bottom 50 percent of income earners: see appendix Figure C2.
11 Regression-based figures including 95 percent statistical compatibility intervals are included in the appendix.
11
coming from lower educated voters, rural voters and poorer regions – in particular the Northeast (see the following section). After accounting for the independent effects of all these variables, income appears to be non-significant in 1989: all things being equal, poorer voters were not more or less likely to vote for Lula. However, the overall trend is robust to the consideration of other covariates, and in 2018 the bottom 50 percent were still more likely to support the PT by about 10 percentage points.
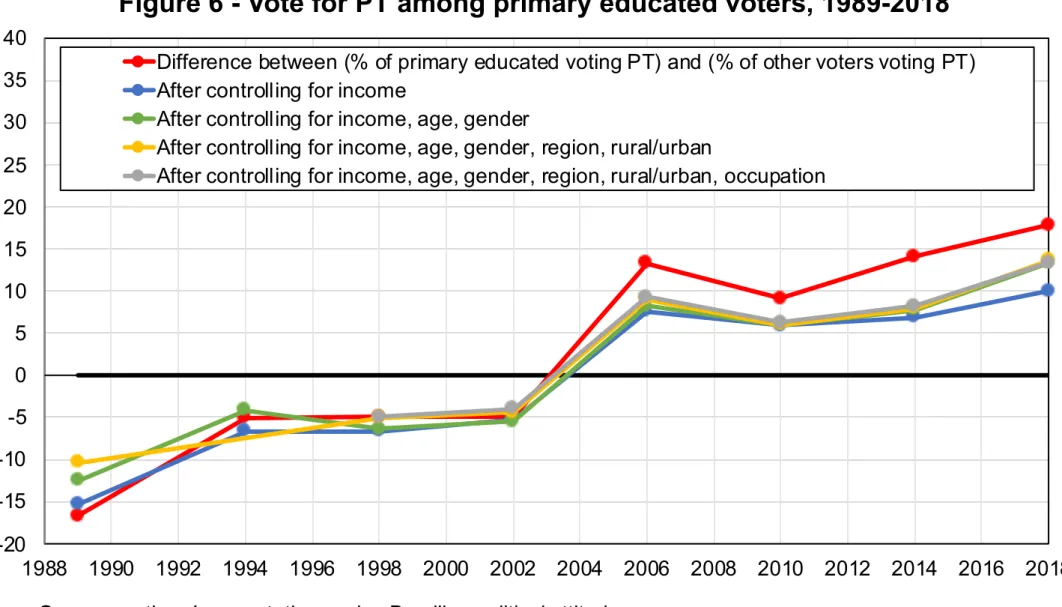
A similar evolution is visible when comparing popular votes for the PT coming from illiterates and primary educated voters with those from voters with a higher level of education (Figure 6). An important difference with income, however, is that education remained significant at the beginning of the period after accounting for the effects of other individual variables: lower-educated voters were less likely to vote for the PT by 10 percentage points in 1989. Thus, income and education should not be seen as synonymous. This education gradient was also associated with significant differences in voting behaviors across age groups: until the early 2000s, younger cohorts corresponding to the new, higher-educated generations were more likely to support Lula than Collor or Cardoso.12
In summary, the analysis of electoral behaviors in Brazil points to a unique case of a policy-driven shift to new class cleavages. The political system of the 1990s seems to have involved the PT’s restricted core of higher-educated, urban voters, next to a sparse coalition of volatile voters supporting the candidate considered to be most credible at fighting inflation and promoting growth. The social policies implemented during the early 2000s, and their relative success at reducing multidimensional poverty and labor income inequalities at the bottom of the distribution, have coincided with the emergence of new class allegiances. In a comparative perspective, the convergence of economic and intellectual elites towards the right of the political spectrum stands in contrast with the dynamics visible in other Western democracies. In Europe and the US, university graduates have become increasingly supportive of social-democratic, socialist and green parties since the early 1970s, while top income earners still remain more likely to vote for right-wing parties (see Piketty 2018). In Brazil, by contrast, it was higher-educated voters (alongside higher-income voters) who were relatively more
12
inclined towards Bolsonaro, with over 63 percent of them voting for the PSL candidate in the second round of the presidential election (Figure 4).
4. The Regionalization of Political Conflicts
Brazil has always been characterized by an important regional divide. Demographically, about 45 percent of the voting-age population has been concentrated in the richer Southeastern region since 1989, as compared to about 25 percent in the Northeast, 15 percent in the South and 15 percent in the North and Centre of the country.13 In tandem with the evolution of the income and education cleavages, the spatial distribution of PT voters has also undergone a notable shift. In the 1989 runoff, about 52 percent of residents from the richer Southeastern and Southern regions opted for Lula, compared to 43 percent of voters in the Northeast (Figure 7). Lula thus captured the relatively more well-off, educated and younger voters residing in urban places: 60 percent of urban dwellers voted for the PT candidate in 1989.14 Over time, as the PT vote share grew, the gap between the ‘urban South’ and the ‘rural North’ closed, and eventually reversed in favor of the Northeast from 2002 onwards. The PT claimed 75 percent of the Northeastern electorate in 2006 – a share that would fall over time but never significantly below 65 percent. By contrast in the South and Southeast the PT vote faced a secular decline since 2002, falling from 60 percent to about 35 percent.
By the end of the 2010s, in terms of magnitude, the single strongest predictor of the PT presidential vote is being a resident of the Northeast – historically the most deprived region in the country (Arretche 2019). The difference between the share of voters living in the Northeast region voting PT and the share voters living in other regions voting PT reached over 25 percentage points in 2018, after having been -5 percentage points in 1989 (Figure 8). Even after controlling for income, education and other socio-demographic characteristics, similar magnitudes remain. The dramatic change seems to have taken place during Lula’s first presidential term (2002-2006), as transfers and infrastructural investment benefited the most disadvantaged families in Brazil, which in terms of numbers are overwhelmingly located in the
13 See appendix Table A3. 14 See appendix Figure A7.
13
Northeastern states. With a program heavily tilted towards poverty eradication and material upgrading, the urban-biased vote that the PT used to get has gradually disappeared (Figure 9).
As we document below, this geographical shift is consistent with the party’s gains among informal workers, weakly inserted in the labor market, at the expense of formal wage earners concentrated in the South and Southeast. The comparison of its evolution in the historically- more-progressive Southeast and in the historically-more-conservative Northeast is telling in this regard. Indeed, this has been seen by historians of the PT as a by-product of its development from a radical worker’s party of São Paulo’s syndicalists and intelligentsia to a more pragmatic multi-class national party (Secco 2011). Its priorities gradually shifted from focusing on the structural causes of the country’s developmental impediments to directly committing resources to eradicate material deprivation, whose severity presented substantial spatial heterogeneity. In this process, the presidency – given the vast powers attributed to the post in Brazil’s federal system – was used as a springboard to make electoral gains in parliamentary, state and municipal elections for the party, particularly in the Northeast. This subsequently fed back into votes for its presidential candidates when local coalitions worked to the PT’s advantage, notably in successfully implementing social programs visibly attached to the incumbent president (Alves, 2018).15
While it is true that the PT’s support in the Northeast has waned since 2006, it has done so proportionately less than in the other regions – falling by 10 percentage points by 2018 rather than 20 points in the case of the Southeast (Figure 7). Whether the PT will be able to maintain its dominance of the Northeast since it has lost the presidency will be a test of time. This will likely depend on whether the party has truly transformed the region’s historic elite-voter linkages and built sustainable programmatic electoral allegiances. The latter would be consistent with the literature’s emphasis on the penetration of the party’s social programs since
15 Interestingly, according to post-electoral surveys from the ESEB project, the increased identification of the
electorate with the PT in the Northeast came at the expense of a fall in partisan identification with the PMDB –
14
200216, especially for those low-income primary educated voters who were already more inclined towards the PT in 1998 and 2002 (Figure 8), independently of whether they were transfer-program beneficiaries (Bohn 2011; Samuels and Zucco 2014).
5. Other Sociological Determinants of Electoral Behavior in Brazil
We conclude our long-run analysis by looking more specifically at other forms of political divides. Race was at the heart of the country’s political and economic history (see the first section). Inequalities between racial groups have remained significant until today, with a larger share of slave descendants still living in the poorer Northeast region and achieving lower average income and education levels.17 In 2018, over 40 percent of Brazilians declared themselves as being Pardos or Morenos, more or less corresponding to a “mixed” identity, while 39 percent self-identified as “Whites” (Brancos), 15 percent as “Blacks” (Pretos) and 5 percent as belonging to other groups.18 The large share of individuals in the “multiracial” category speaks for Brazil’s unique history of racial mixing and relative depoliticization of racial identities.
In contrast to other colonial states like South Africa, where political unification and democratization at the turn of the twentieth century was restricted to the White population and based upon an ideology of racial unity, Brazil’s 1891 constitution did not contain any reference to race which would formally exclude former slaves from political participation. Such exclusion did effectively take place in the following decades through literacy requirements, but it was not explicitly based upon race. In South Africa, the search for white unity would lead to racial categories becoming increasingly rigid, and their institutional codifications would have long-run consequences on the representation of political and social inequalities. Almost the
16 For instance, Hunter and Power (2007) using state-level data; and Soares, Dillon and Terron (2008) using
municipal-level data.
17 On the causal effect of racial affiliations on education opportunities see Marteleto and Dondero (2016). 18 See appendix Table A3.
15
exact opposite happened in Brazil, where governments of the early twentieth century instead pushed for a process of incorporation dedicated to “Whitening” the populations of Indian or African blood. This would contribute to putting regional affiliations, rather than racial identities, at the heart of political conflicts (Lieberman 2017).
Available data does not allow us to track the evolution of the link between racial identities and political affiliations since redemocratization, but recent evidence points to significant, though moderate, differences in vote choices across racial groups. In 2018, 34 percent of Whites voted for the PT, as compared to 50 percent of Pardos/Morenos and 57 percent of Blacks.19 This is consistent with the history of the PT, which has given more attention to Afro-Brazilian activists as it broadened its appeal beyond the southern white working class to encompass all occupational categories over time (Warner 2005). Two interesting facts are however important to stress. First, these differences are low in comparative perspective when considering the electoral behaviors of ethnic minorities. In France, for example, differences in vote shares for left-wing parties between Muslims and non-Muslims have reached levels higher than 30 percentage points in recent years, and the same bias towards the Democratic Party is visible in the United States when considering the Afro-American vote (see Piketty 2018). In South Africa, where the apartheid regime left a long-lasting legacy, democratization has come with a party system almost entirely structured on racial lines.
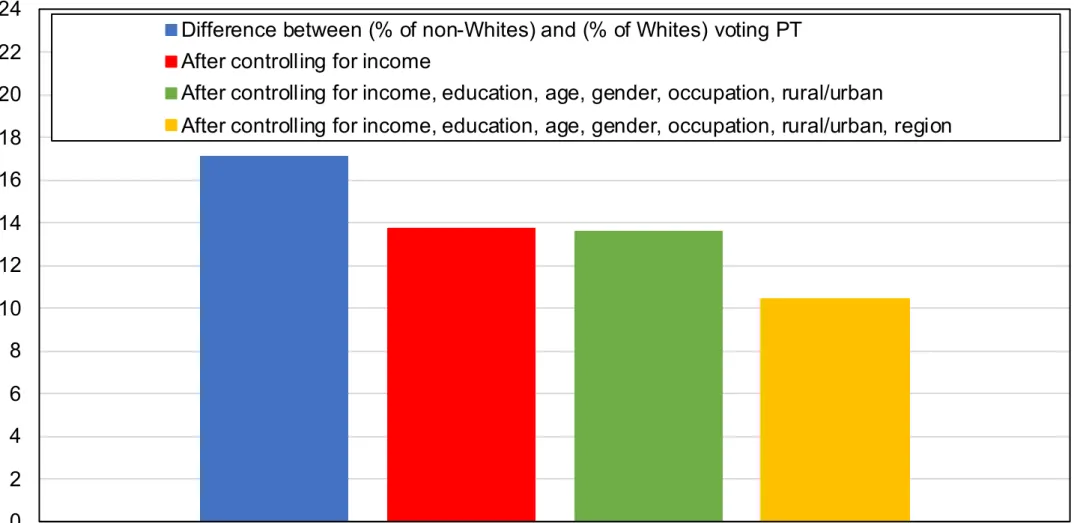
Secondly, racial differences in vote choice in Brazil are partly driven by the other forms of political cleavages identified in the rest of this paper. The difference between the share of non-Whites and the share of non-Whites voting for the PT was about 17 percentage points in 2018, but this difference drops to 14 percentage points when controlling for income and to 10 percentage points when controlling for education, age, gender, occupation, rural/urban location and region (see Figure 10). Race therefore does have an independent effect on support for the PT, but this effect is relatively weak. Evidence based on other surveys suggests comparable patterns since 2002: if anything, relative support for the PT among non-Whites was slightly higher in 2014 than in 2018, and was lowest in 2002.20
19 See appendix Figure A8. 20 See appendix Figure C6.
16
The study of occupation goes in line with the conclusion that income, education and geographical characteristics are at the heart of changing political identifications in Brazil. In most developed countries, self-employed workers and farmers have consistently been significantly more likely to support conservative parties than wage earners in the past decades (Evans and Graaf 2012). This is not the case in Brazil, where differences across broad occupational categories have remained weak and mostly explained by differences in earnings, education levels and location.21
Two interesting changes which are orthogonal to economic status are however worth mentioning. The first one is what seems to be the growing importance of religious identities in the last election. Between 2014 and 2018, the gap in support for the PT between protestants and other religious groups grew significantly, from about 5 percentage points to 17 percentage points, and this change is robust to controlling for other individual characteristics (see Figure 11). This is consistent with Bolsonaro’s particular appeal among Evangelicals. Again, it is nonetheless important to stress that such gaps are significantly lower than those found in many other developed, and developing countries (e.g., India, see Banerjee, Gethin and Piketty 2019). The voting behaviors of women have also followed patterns which are at odds with the long-run trends visible in other dimensions. At first strongly biased against the PT, in particular in 2002, they became much more supportive of the party in recent years: in 2018, they were more likely to support Haddad than Bolsonaro by 10 percentage points.22 It is possible that such changes are due to candidate effects rather than more profound differences in policy or ideological positions.
6. Understanding the Rise of Bolsonaro: Growth, Inequality, and the Squeezed Middle Class
Exactly one year prior to the 2018 election, Brazilian voters were asked about the issues which would be most decisive in determining their vote. Contrary to what one might except,
21 See appendix Figures A9, A10, and A11. 22 See appendix Figures A14 and A15.
17
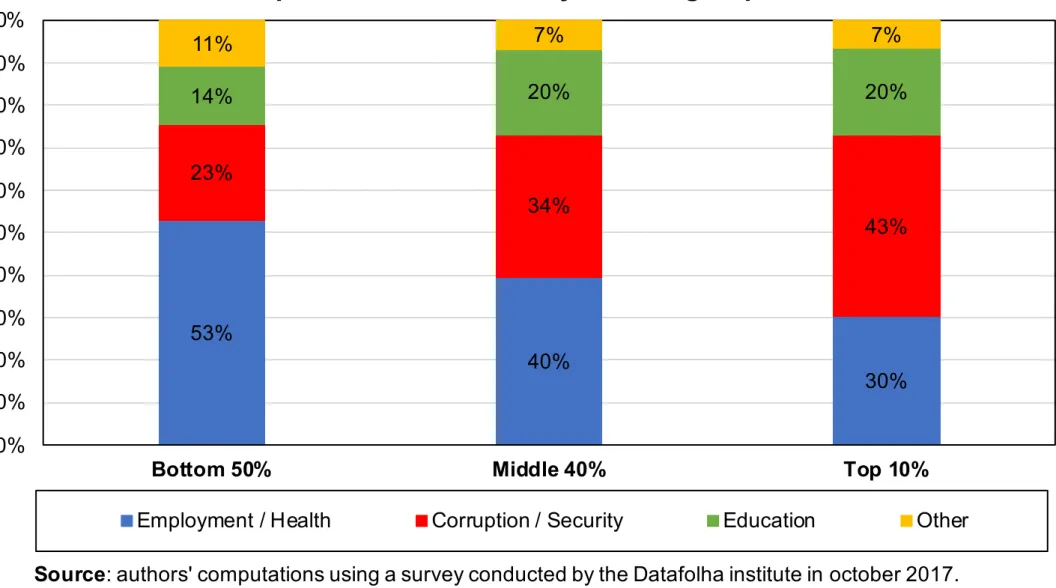
corruption was not the most important problem for a majority of Brazilians at the time: 32 percent of survey respondents chose health, 16 percent selected education and 14 percent insisted on job creation being the policy areas which would primarily influence their candidate choice. “Fighting against corruption” was chosen by only 18 percent of individuals. Strikingly, the intersection of issue-relevance with personal socio-economic characteristics appears to be fundamental in explaining the polarization of the Brazilian electorate.
Figure 12 decomposes the most important issues reported by survey respondents by the income group to which they belong. Poorer voters appear to be significantly more likely to emphasize health and employment matters, while richer citizens tend to attach greater importance to corruption and public security. It is striking to note that while the poor have been the most affected group by homicides in Brazil, they seem to give more weight to improvements in their material conditions, especially if violence is seen as a symptom of poverty.
The rise of Bolsonaro can thus be explained by his ability to appeal to voters on both types of issues. By positioning himself against the corruption and the violence “tolerated” by the current democratic system and by the incumbent government, he attracted a large portion of the middle and upper classes. And by blaming the post-2014 recession and unemployment rise on the PT, by supporting cuts to taxes and public spending, as well as further privatization programs, he has appeased a broad group comprised of poorer voters, and many middle-class citizens and business elites. Amidst the “crisis of representation”, the fact that Bolsonaro was a political “outsider” facilitated his popularity (Alves 2018). The geography of the 2018 election supports this conclusion: only the northeastern region gave a majority to the PT’s candidate, Fernando Haddad. These were voters who remained loyal to the party that they associated with vastly improving their economic opportunities, independently of the recent economic downturn, and who perceived that they had a lot to lose from the consequences of Bolsonaro’s economic program.
While issues such as corruption, security, or even religion, played a role in bringing Bolsonaro to power, economic-class divisions tied to geography appear to be the strongest cleavage in Brazilian society today. But these did not form overnight. The distribution of economic growth during the expansionary part of the PT’s time in office (2002-2014) is a key metric by which to judge subsequent political developments. While average national income per adult grew at
18
18 percent over the period, the majority of the gains was split between two distant groups – the poorest half of the population and the very richest part. Most families in the Bottom 50 percent (concentrating households from the Northeast) saw their incomes grow by nearly twice the national average.23 Growth was lowest for individuals between the 70th percentile and 99th percentile in the distribution.24 This “squeezed middle class” can be seen as Brazil’s
“left-behind”. Above them, significant income growth was captured by the Brazilian elite over the period due to a mix of favourable external conditions (commodity prices, exchange rates) and favourable internal conditions (large public investments, rising household consumption, industrial credit subsidies, and stable tax rates). Notably, these were the groups less likely to vote for the party that oversaw their prosperity.
Thus, the middle classes have been pitted against the least privileged groups in society for their share of national income, which would become increasingly scarce after the economic slowdown from 2014. Furthermore, with prices beginning to rise from 2013, following rising labour costs – including for services routinely used by the upper-middle class (e.g. domestic service) –, this cohort would increasingly lose faith in a Workers’ Party that was perceived to be only directly concerned for the poor or indirectly benefiting the very rich. On top of this, the subsequent economic decline, increased violence, and a mirage of corruption charges against high-profile politicians across the political spectrum, but especially from the PT, along with a return of a more invigorated Lula to the electoral process, made elites increasingly hostile to further PT-led executives.
7. Conclusion
Brazil has a long history of political divisions and social inequality. More than thirty years since the adoption of universal suffrage, Brazilian redemocratization can largely be characterized by the rise and fall of the Workers’ Party, from its early roots among the white, highly-educated young wage earners of Southern states to its metamorphosis into a national multi-class party in the early 2000s and progressively into a party of the poor and marginalized
23 On the regional composition of income groups, see appendix Figures B3 and B4. 24 See appendix Figure A16.
19
citizenry from 2006 onwards. The PT’s fall may not be as definitive as the trend may be suggesting given its stranglehold of the populous Northeast region – today the strongest individual predictor of voting for the PT. Compared to other contemporary democracies, the evolution of political cleavages in Brazil has been marked by important temporal shifts. But the singularity of Brazil is that voting patterns have taken an inverse course to those in more advanced countries. Rather than evolving towards a multi-elite party system, Brazilian political cleavages – as expressed in presidential elections – have increasingly come to be defined on unidimensional class lines, with high-education and high-income voters converging in their rejection of the ‘traditional’ center-left party.
PT’s gradual process of consolidating mass support after the implementation of social investment policies is remarkably similar to the dynamics visible in Thailand at about the same period, when Thaksin Shinawatra’s agricultural subsidies and minimum wage increases contributed to a new polarization of the political space along class lines (see Gethin and Jenmana 2019). In both cases, it was redistributive policies during periods of strong economic growth which drove new divisions between the “rich” and the “poor”. It would be wrong to posit that such political mobilization can be solely reduced to the outcome of the “populist” rhetoric of a charismatic leader. Both in Thailand and Brazil, this mobilization also came with new, persistent party identifications. The emergence of class cleavages in Brazil therefore goes beyond short-run appeals and can be understood as rooted in a broader process of mass polarization brought about by how the fruits of economic growth were distributed. The rise of a political outsider like Bolsonaro in 2018 should equally be understood as a product of decisions made by the incumbent party and the contextual factors which allowed the PT to sow the seeds of its declining popularity.
20
References
J. A. Alves, Transformation or Substitution? The Workers’ Party and the right in Northeast Brazil. Journal of Politics in Latin America 10, no. 1 (2018): 99-132.
B. Ames, The Deadlock of Democracy in Brazil (University of Michigan Press, 2001)
M. Arretche, ed., Paths of Inequality in Brazil (Springer, 2019).
M. Arretche, “The Geography of Access to Basic Services in Brazil,” in Paths of Inequality in Brazil: A Half-Century of Changes, ed. M. Arretche (Springer, 2019).
L. Assouad, L. Chancel and M. Morgan, “Extreme Inequality: Evidence from Brazil, India, the Middle East, and South Africa,” American Economic Association: Papers & Proceedings 108 (2018): 119–123.
A. Banerjee, A. Gethin, T. Piketty, “Growing Cleavages in India? Evidence from the Changing Structure of Electorates, 1962-2014”, Economic and Political Weekly 54, no. 11 (2019): 34-44.
S. R. Bohn, “Social policy and vote in Brazil: Bolsa Família and the shifts in Lula's electoral base”, Latin American Research Review 46, no. 1 (2011): 54-79.
L. Carvalho, Valsa Brasileira: Do Boom ao Caos Econômico (Editora Todavia, 2018).
G. Evans and N. D. de Graaf, Political choice matters: explaining the strength of class and religious cleavages in cross-national perspective (Oxford University Press, 2012).
C. Furtado, “Political Obstacles to Economic Growth in Brazil,” International Affairs 41, no. 2 (1965): 252–266.
A. Gethin and T. Jenmana, “Extreme Inequality, Democratisation and Class Struggles in Thailand” (WID.world Issue Brief 2019/1).
W. Hunter, “The Normalization of an Anomaly: The Workers’ Party in Brazil”, World Politics 59, no. 3 (2007): 440–475.
W. Hunter and T. J. Power, “Rewarding Lula: Executive Power, Social Policy, and the Brazilian Elections of 2006,” Latin American Politics and Society 49, no. 1 (2007): 1–30. E. S. Lieberman, Race and Regionalism in the Politics of Taxation in Brazil and South Africa (Cambridge University Press, 2003).
21
J. L. Love, “Political Participation in Brazil, 1881-1969,” Luso-Brazilian Review 7, no. 2 (1970): 3–24.
L. Marteleto and M. Dondero, “Racial Inequality in Education in Brazil: A Twins Fixed-effect Approach”, Demography 53, no. 4 (2016): 1185–1205.
M. Morgan and P. Souza, “Distributing Growth During Late-Development: New Evidence on Long-Run Inequality in Brazil” (Working Paper, 2019).
T. Piketty, “Brahmin Left vs Merchant Right: Rising Inequality and the Changing Structure of Political Conflict. Evidence from France, Britain and the US 1948-2017” (WID.world Working Paper 2018/7).
D. Samuels, “From Socialism to Social Democracy: Party Organization and the Transformation of the Workers’ Party in Brazil,” Comparative Political Studies 37, no. 9 (2004): 999– 1024.
D. J. Samuels and C. Zucco, “Lulismo, Petismo, and the Future of Brazilian Politics.” Journal of Politics in Latin America 6, no. 3 (2014): 129–158.
L. Secco, História do PT 1978-2010 (Ateliê Editorial, 2011).
G. Soares, G., A. E. Dillon, and S. L. Terron. “Dois Lulas: a geografia eleitoral da reeleição (explorando conceitos, métodos e técnicas de análise geoespacial)”, Opinião Pública 14, no. 2 (2008): 269-301.
L. F. Veiga, “Os partidos brasileiros na perspectiva dos eleitores: mudanças e continuidades na identificação partidária e na avaliação das principais legendas após 2002”, Opinião Pública 13, no. 2 (2007): 340-365.
L. A. Warner, “The Workers’ Party and the Elimination of Racial Inequality: A New Stage in the Politicization of Race in Brazil” (Working Paper, 2005).
C. Zucco and T. J. Power, “Bolsa Família and the Shift in Lula’s Electoral Base, 2002–2006: A Reply to Bohn,” Latin American Research Review 48, no. 2 (2013): 3–24.
0%
10%
20%
30%
40%
50%
60%
70%
80%
90%
100%
187
2
188
6
189
0
189
4
189
8
190
0
190
2
190
6
191
0
191
4
191
8
191
9
192
0
192
2
192
6
193
0
193
4
194
5
194
7
195
0
195
4
195
5
195
8
196
0
196
2
196
6
197
0
197
8
198
2
198
6
198
9
199
0
199
4
199
8
200
2
200
6
201
0
201
4
201
8
P
e
rce
n
ta
g
e
o
f t
h
e
vo
tin
g
a
g
e
p
o
p
u
la
tio
n
Figure 1 - Literacy and Political Participation in Brazil: 1872-2018
Literacy rate
Voters (parliamentary elections)
Voters (presidential elections)
Source: Literacy rate is from Ipeadata, except 1950 and 1960, which are from Censo Demográfico 1960
(IBGE). The estimates for 1872-1890 are imputed from the literacy rates of the total population. Estimates for
1900-2018 are imputed from the literacy rates of the population aged 15 and over. Voter data is from the IBGE
Censuses and Love (1970) for 1886-1930, and from International IDEA Voter Turnout Database for 1945-2018.
Note: the literacy rate refers to the proportion of the voting age population who can read and write. Voters are
the people who actually voted in all presidential and parliamentary elections as a share of the voting age
population defined in Table 2 for the different periods. Between 1886 and 1934 no data was found for
parliamentary elections. Between 1960 and 1989 no direct elections for the president were held.
20%
30%
40%
50%
60%
70%
80%
1988 1990 1992 1994 1996 1998 2000 2002 2004 2006 2008 2010 2012 2014 2016 2018
Figure 2 - Presidential election results, 1989-2018: Second round
PT
PRN / PSDB / PSL
Source: authors' computations using official election results.
Note: the figure shows the share of votes received by Brazilian political parties in the second round of the
presidential elections of 1989, 1994, 1998, 2002, 2006, 2010, 2014 and 2018. PT: Partido dos
Trabalhadores; PRN: Partido da Reconstrução Nacional; PSDB: Partido da Social Democracia Brasileira;
PSL: Partido Social Liberal.
0%
10%
20%
30%
40%
50%
60%
70%
80%
1989
1994
1998
2002
2006
2010
2014
2018
Figure 3 - Vote for PT by income group, 1989-2018
Bottom 50%
Middle 40%
Top 10%
Source: authors' computations using Brazilian political attitudes surveys.
Note: the figure shows the share of votes received by the Workers' Party in the second round of
presidential elections among voters belonging to different household income groups. The bottom 50%
have been increasingly more likely to support the PT in comparison to voters belonging to other income
groups.
0%
10%
20%
30%
40%
50%
60%
70%
80%
1989
1994
1998
2002
2006
2010
2014
2018
Figure 4 - Vote for PT by education level, 1989-2018
Primary
Secondary
Tertiary
Source: authors' computations using Brazilian political attitudes surveys.
Note: the figure shows the share of votes received by the Workers' Party in the second round of
presidential elections among voters with different levels of education. Primary-educated voters have been
increasingly more likely to support the PT in comparison to other voters.
-10
-5
0
5
10
15
20
25
30
35
1988 1990 1992 1994 1996 1998 2000 2002 2004 2006 2008 2010 2012 2014 2016 2018
Figure 5 - Vote for PT among low-income earners, 1989-2018
Difference between (% of bottom 50% earners voting PT) and (% of top 50% earners voting PT)
After controlling for education
After controlling for education, age, gender
After controlling for education, age, gender, region, rural/urban
After controlling for education, age, gender, region, rural/urban, occupation
Source: authors' computations using Brazilian political attitudes surveys.
Note: the figure shows the difference between the share of bottom 50% earners voting PT and the share of
top 50% earners voting PT in the second round of presidential elections, before and after controls.
-20
-15
-10
-5
0
5
10
15
20
25
30
35
40
1988 1990 1992 1994 1996 1998 2000 2002 2004 2006 2008 2010 2012 2014 2016 2018
Figure 6 - Vote for PT among primary educated voters, 1989-2018
Difference between (% of primary educated voting PT) and (% of other voters voting PT)
After controlling for income
After controlling for income, age, gender
After controlling for income, age, gender, region, rural/urban
After controlling for income, age, gender, region, rural/urban, occupation
Source: authors' computations using Brazilian political attitudes surveys.
Note: the figure shows the difference between the share of primary-educated voters voting PT and the share
of other voters voting PT in the second round of presidential elections, before and after controls.
0%
10%
20%
30%
40%
50%
60%
70%
80%
90%
1989
1998
2002
2006
2010
2014
2018
Figure 7 - Vote for PT by region, 1989-2018
South
Southeast
North / Centre-West
Northeast
Source: authors' computations using Brazilian political attitudes surveys.
Note: the figure shows the share of votes received by the Workers' Party in the second round of
presidential elections among voters living in different Brazilian regions.
-10
-5
0
5
10
15
20
25
30
35
40
45
1988 1990 1992 1994 1996 1998 2000 2002 2004 2006 2008 2010 2012 2014 2016 2018
Figure 8 - Vote for PT in the Northeast region, 1989-2018
Difference between (% of Northeast voting PT) and (% of other regions voting PT)
After controlling for income
After controlling for income, education, age, gender
After controlling for income, education, age, gender, rural/urban
After controlling for income, education, age, gender, rural/urban, occupation
Source: authors' computations using Brazilian political attitudes surveys.
Note: the figure shows the difference between the share of voters living in the Northeast region voting PT
and the share voters living in other regions voting PT in the second round of presidential elections, before
and after controls.
-25
-20
-15
-10
-5
0
5
10
15
20
25
30
1988 1990 1992 1994 1996 1998 2000 2002 2004 2006 2008 2010 2012 2014 2016 2018
Figure 9 - Vote for PT among rural areas, 1989-2018
Difference between (% of rural areas voting PT) and (% of urban areas voting PT)
After controlling for income
After controlling for income, education, age, gender
After controlling for income, education, age, gender, region
After controlling for income, education, age, gender, region, occupation
Source: authors' computations using Brazilian political attitudes surveys.
Note: the figure shows the difference between the share of voters living in rural areas voting PT and the
share urban areas voting PT in the second round of presidential elections, before and after controls.
0
2
4
6
8
10
12
14
16
18
20
22
24
2018
Figure 10 - Vote for PT among non-Whites, 2018
Difference between (% of non-Whites) and (% of Whites) voting PT
After controlling for income
After controlling for income, education, age, gender, occupation, rural/urban
After controlling for income, education, age, gender, occupation, rural/urban, region
Source: authors' computations using Brazilian political attitudes surveys.
Note: the figure shows the difference between the share of self-declared non-white voters voting PT and the
share of white voters voting PT in the second round of presidential elections, before and after controls.
-25
-20
-15
-10
-5
0
5
10
15
20
25
30
2002
2004
2006
2008
2010
2012
2014
2016
2018
Figure 11 - Vote for PT among protestants, 1989-2018
Difference between (% of protestants voting PT) and (% of other voters voting PT)
After controlling for income, education, age, gender, employment, marital status
Source: authors' computations using CSES surveys.
Note: the figure shows the difference between the share of protestants and the share of catholics,
non-believers and other voters voting PT in the second round of presidential elections, before and after controls.
53%
40%
30%
23%
34%
43%
14%
20%
20%
11%
7%
7%
0%
10%
20%
30%
40%
50%
60%
70%
80%
90%
100%
Bottom 50%
Middle 40%
Top 10%
Figure 12 - Reason determining candidate choice in the 2018
presidential election by income group
Employment / Health
Corruption / Security
Education
Other
Source: authors' computations using a survey conducted by the Datafolha institute in october 2017.
Note: the figure shows the distribution of answers by income group to the question of the most important
issue which would at the time be most decisive in their vote in the 2018 election.
Democracy and the Politicization of Inequality
in Brazil, 1989-2018
Appendix
Amory Gethin
Marc Morgan
March 2021
Democracy and the Politicization of Inequality in Brazil, 1989-2018
*Appendix
Amory Gethin Marc Morgan 3 March 2021
Abstract
Thi doc men lemen o o king a e Democracy and the Politicization of Inequality in Brazil, 1989-2018 . I contains all appendix tables and figures.
* Amory Gethin (amory.gething@psemail.eu), Marc Morgan (marc.morgan@psemail.eu): Paris School of
Economics World Inequality Lab. We thank Gedeão Locks, Clara Martínez-Toledano, Thomas Piketty, and Thiago Scarelli for helpful comments.
0%
10%
20%
30%
40%
50%
60%
70%
80%
1988 1990 1992 1994 1996 1998 2000 2002 2004 2006 2008 2010 2012 2014 2016 2018
S
h
a
re
o
f
vo
te
s
Figure A1 - Presidential election results, 1989-2018: First round
PT
PDT / PPS / PSB / PSOL / PV / Other left
PSDB / PRN / PSL / PRONA / Other right
PMDB / Others
Source: authors' computations using official election results.
Note: the figure shows the share of votes received by selected Brazilian political parties in the first round of presidential
elections. PT: Partido dos Trabalhadores; PDT: Partido Democrático Trabalhista; PPS: Partido Popular Socialista; PSB: Partido Socialista Brasileiro; PSOL: Partido Socialismo e Liberdade; PV: Partido Verde; PSDB: Partido da Social Democracia Brasileira; PRN: Partido da Reconstrução Nacional; PSL: Partido Social Liberal; PRONA: Partido de Reedificação da Ordem Nacional; PMDB: Partido do Movimento Democrático Brasileiro.
0%
5%
10%
15%
20%
25%
30%
35%
40%
45%
50%
55%
1990
1994
1998
2002
2006
2010
2014
2018
S
h
a
re
o
f
se
a
ts
Figure A2 - Parliamentary election results, 1990-2018
PT
PMDB
PSDB
PDT / PPS / PSB / PSOL / PV / Other left
PRN / PFL / PPB / PSL / Other right
Source: authors' computations using official election results.
Note: the figure shows the share of seats obtained by selected Brazilian political parties in the parliamentary elections. PT:
Partido dos Trabalhadores; PMDB: Partido do Movimento Democrático Brasileiro; PSDB: Partido da Social Democracia Brasileira; PDT: Partido Democrático Trabalhista; PPS: Partido Popular Socialista; PSB: Partido Socialista Brasileiro; PSOL: Partido Socialismo e Liberdade; PV: Partido Verde; PRN: Partido da Reconstrução Nacional; PFL: Partido da Frente Liberal; PPB: Partido Progresista; PSL: Partido Social Liberal.
0%
10%
20%
30%
40%
50%
60%
70%
80%
1989
1994
1998
2002
2006
2010
2014
2018
Figure A3 - Vote for PT by education group, 1989-2018
Bottom 50%
Middle 40%
Top 10%
Source: authors' computations using Brazilian political attitudes surveys.
Note: the figure shows the share of votes received by the Workers' Party in the second round of
presidential elections among voters with different levels of education. Bottom 50% educated voters have
been increasingly more likely to support the PT in comparison to voters with higher levels of education.
-20
-15
-10
-5
0
5
10
15
20
25
30
35
1988 1990 1992 1994 1996 1998 2000 2002 2004 2006 2008 2010 2012 2014 2016 2018
Figure A4 - Vote for PT among lower educated voters, 1989-2018
Difference between (% of bottom 50% educated voting PT) and (% of top 50% voting PT)
After controlling for income
After controlling for income, age, gender
After controlling for income, age, gender, region, rural/urban
After controlling for income, age, gender, region, rural/urban, occupation
Source: authors' computations using Brazilian political attitudes surveys.
Note: the figure shows the difference between the share of bottom 50% less educated voters voting PT and the
share of other voters voting PT in the second round of presidential elections, before and after controls. Error bars are at the 95% compatibility level.
0%
10%
20%
30%
40%
50%
60%
70%
80%
1989
1994
1998
2002
2006
2010
2014
2018
Figure A5 - Vote for PT by age group, 1989-2018
20-29
30-49
50+
Source: authors' computations using Brazilian political attitudes surveys.
Note: the figure shows the share of votes received by the Workers' Party in the second round of
presidential elections among voters belonging to different age groups.
-10
-5
0
5
10
15
20
25
30
1988 1990 1992 1994 1996 1998 2000 2002 2004 2006 2008 2010 2012 2014 2016 2018
Figure A6 - Vote for PT among young voters, 1989-2018
Difference between (% of aged 20-29 voting PT) and (% of aged 30+ voting PT)
After controlling for education
After controlling for education, income, gender
After controlling for education, income, gender, region, rural/urban
After controlling for education, income, gender, region, rural/urban, occupation
Source: authors' computations using Brazilian political attitudes surveys.
Note: the figure shows the difference between the share of voters aged 20 to 29 voting PT and the share voters aged
30 or more voting PT in the second round of presidential elections, before and after controls. Error bars are at the 95% compatibility level.