HAL Id: cea-01669226
https://hal-cea.archives-ouvertes.fr/cea-01669226
Submitted on 23 Mar 2020HAL is a multi-disciplinary open access archive for the deposit and dissemination of sci-entific research documents, whether they are pub-lished or not. The documents may come from teaching and research institutions in France or abroad, or from public or private research centers.
L’archive ouverte pluridisciplinaire HAL, est destinée au dépôt et à la diffusion de documents scientifiques de niveau recherche, publiés ou non, émanant des établissements d’enseignement et de recherche français ou étrangers, des laboratoires publics ou privés.
Software Tools of the Computis European Project to
Process Mass Spectrometry Images
Marie-France Robbe, Jean-Pierre Both, Brendan Prideaux, Ivo Klinkert,
Vincent Picaud, Thorsten Schramm, Alfons Hester, Victor Guevara, Markus
Stoeckli, Andreas Roempp, et al.
To cite this version:
Marie-France Robbe, Jean-Pierre Both, Brendan Prideaux, Ivo Klinkert, Vincent Picaud, et al.. Soft-ware Tools of the Computis European Project to Process Mass Spectrometry Images. European Journal of Mass Spectrometry, IM Publications, 2014, 20 (5), pp.351 - 360. �10.1255/ejms.1293�. �cea-01669226�
Software tools of the Computis European project to process mass
spectrometry images
Marie-France Robbea*, Jean-Pierre Botha, Brendan Prideauxc, Ivo Klinkertd, Vincent Picauda, Thorsten Schrammb, Alfons Hesterb, Victor Guevarae, Markus Stoecklic, Andreas Roemppb, Ron M.A. Heerend, Bernhard Spenglerb, Serge Haana
* Correspondence to: Dr Marie-France Robbe, French Atomic Energy Commission (CEA), Laboratory of Tools for Data Analysis (DRT-LIST-DM2I-LOAD), Building 565 Digiteo, Gif-sur-Yvette cedex, F-91191, France, Tel: +33 1 69 08 87 49, E-mail: marie-france.robbe@cea.fr
a French Atomic Energy Commission (CEA), Technology Research Division, Building 565, Gif-sur-Yvette cedex, F-91191, France
b Justus Liebig University (JLU), Schubertstraβe 60, Building 16, D-35392 Giessen, Germany
c NOVARTIS, Lichstraβe 35, WSJ-507.1101, CH-4002 Basel, Switzerland
d Dutch Foundation for Fundamental Research of Matter (FOM), Institute for Atomic and Molecular Physics (AMOLF), Kruislaan 407, 1098 SJ, Amsterdam, The Netherlands
e Power Computing & Communication UvA B.V., PO Box 2535, Kruislaan 403, 1000 CM, Amsterdam, The Netherlands
Keywords: imaging mass spectrometry, image processing, visualization, clustering, image
registration, standard format
Abstract
Among the needs usually expressed by teams using mass spectrometry imaging, often arise user-friendly software able to quickly manage huge data volume and to provide efficient assistance for the interpretation of data. To answer this need, the Computis European project developed several complementary software tools to process mass spectrometry imaging data. Data Cube Explorer provides a simple spatial and spectral exploration for MALDI-ToF and ToF-SIMS data. SpectViewer offers visualization functions, assistance to the interpretation of data, classification functionalities, peak list extraction to interrogate biological database, image overlay and can process data issued from MALDI-ToF, ToF-SIMS and DESI equipments. EasyReg2D is able to register two images, in ASCII format, issued from different technologies.
The collaboration between teams being hampered by the multiplicity of equipments and data formats, the project also developed a common data format (imzML) to facilitate the exchange of experimental data and their interpretation by the different software tools. The BioMap platform for visualization and exploration of MALDI-ToF and DESI images was adapted to parse imzML files, enabling its access to all project partners and more globally to a larger community of users.
Considering the huge advantages brought by the imzML standard format, a specific editor (vBrowser) for imzML files and converters from proprietary formats to imzML were developed to enable the use of imzML format by a broad scientific community. This initiative is paving the way towards the development of a large panel of software tools able to process mass spectrometry imaging datasets in the future.
Since the emergence of mass spectrometry imaging almost twenty years ago in SIMS,1-2-3-4 and MALDI technologies,5-6-7 this technique appeared as a major discovery tool in life sciences for detection, localization and identification of molecules in biological tissues,8-9 and for understanding the cellular processes involved in both health and disease,10.
Since then, the technology was perfected,11 to improve the sensitivity, accuracy and spatial resolution of mass spectrometry imaging instruments,12-13-14-15 and to optimize ionization and reproducibility with appropriate sample preparation and treatment methods not introducing analyte delocalization or degradation,16-17-18-19-20. The range of molecules was considerably extended so that it is now possible to measure molecular weights above 200 kDa,21-22 to reach mass measurement accuracy of sub-parts per million,23-24 and to detect a particular compound in the order of low fmol/µ²,25.
Datasets acquired with state-of-the-art instrumentation often include thousands of mass spectra, each of which comprising thousands of mass channels, therefore mass spectrometry imaging outputs regularly amount gigabytes of data and it is essential to develop automated software to analyze the huge spectra rapidly and efficiently,26-27 and specific methods adapted to process such amount of data,28-29-30-31.
For imaging mass spectrometry, available software is limited to proprietary software developed by the equipment manufacturers and linked to specific equipment (flexImaging from Bruker Daltonics, TissueView from AB Sciex, SurfaceLab from IonTof), and very few free of charge software such as BioMap or MITICS,32. If all these software tools provide image reconstruction and exploration functions, few of them include processing functionalities such as clustering or multivariate analysis,33-34-35-36 to help users in data analysis and interpretation.
To contribute to the improvement impetus of mass spectrometry imaging technology, the Computis European project (2006-2010) http://www.computis.org/ was devoted to the development of high-resolution imaging instruments, software affording a large panel of analytical functions, and to use these new capacities in biological and medical applications. The Computis project dedicated large efforts to the development of software tools for data processing and visualization. Many basic but largely used features such as zooming, region-of-interest analysis, image cropping, intensity-scale and color palette for image display, intensity profiles, peak and pixel picking, true-data or binned-data display, were developed. More specialized processing functions such as denoising and baseline subtraction, clustering, multivariate analysis and image registration, were also elaborated with the constraint to identify methods adapted to the management of enormous amounts of spectral data obtained from the imaging of tissue sections.
Three software tools were developed during the Computis project: Data Cube Explorer for a simple exploration of data and classification with the Kohonen network, SpectViewer for exploration, classification, data interpretation and connection with biological databases, and EasyReg2D for image registration.
One of the goals of the Computis project was to develop software compatible with data of all partners. Nevertheless, the multiplicity of data formats - issued from the use by the partners of various devices from several manufacturers in MALDI and SIMS imaging - quickly resulted difficult to manage. The need clearly appeared to have a common format allowing the comparison of images and datasets from the different partners.
To address this limitation, the partners examined the different standards available: netCDF/ANDI-MS,37 from ASTM International, mzXML,38-39 from the Institute of Systems Biology, mzData,40 from Human Proteome Organization (HUPO) and the joint format
mzML,41-42 (released in 2008 but under development at the time). However, it appeared that mzML could not completely describe a 2D MS imaging experiment as some 2D parameters (including x/y position, scan direction/pattern, pixel size) were not available and that data storage was not efficient enough. Therefore the Computis European project developed the imzML data format,43-44-45 for imaging MS data and Justus Liebig University took the leadership of this development.
In the imzML format, the MS imaging data is divided in two separate files. The mass spectral data is stored in a binary file to ensure efficient storage. All metadata (instrumental parameters and sample details) are stored in a XML file with an extended controlled vocabulary to include specific parameters of mass spectrometry imaging. The two files (XML and binary) are connected by offset values in the XML file and are unambiguously linked by a universally unique identifier. The resulting datasets are comparable in size to the raw data and the separate metadata file allows flexible handling of large datasets. Specifications and example files for imzML can be downloaded at http://www.imzML.org.
Considering the advantages brought by the imzML standard format and its interest for the mass spectrometry community, the Computis project developed a specific editor for imzML files and converters from proprietary formats to imzML format to help the scientific community to use the imzML format. As all data formats of the Computis partners could not be read by the BioMap platform developed by Novartis, BioMap was also adapted to parse imzML files, enabling its access to all project partners and more globally to a larger community of users.
Data Cube Explorer
Data Cube Explorer is a user-friendly tool under Windows to provide an easy spectral and spatial exploration of MALDI-ToF and ToF-SIMS imaging mass spectrometry datasets. It enables zooming within spectra and scrolling through the dataset masses for images with a manual greyscale tuning to improve image contrast. Regions Of Interest can be selected with the display of the associated spectra. Developed by the Dutch Foundation for Fundamental Research of Matter (FOM-Amolf), Data Cube Explorer,46-47-48 can be downloaded at
http://www.maldi-msi.org.
The “self-organizing map” functionality classifies images according to the intensity of all pixel places and automatically selects a given number of images as different as possible. The classification method used is unsupervised competitive learning, also known as Kohonen neural network,49. For performing this analysis, the image data set is converted into a set of images, defined by a start mass and an end mass, the mass bin per image and the step size to move to a next image. A threshold value is used to distinguish between images containing noise and images containing real image data.
One after the other, the images are fed into the network; a winning output image is calculated, where winning means that the “distance” of the fed image to the output images is minimal. The distance is defined as root mean square of the difference in the pixel intensities of all pixel places. The winning output image (and the images around it defined by the neighborhood value) are adapted to the input image with an learning rate factor. During the process both the neighborhood value and the learning rate are reduced (to respectively 1 and 0).
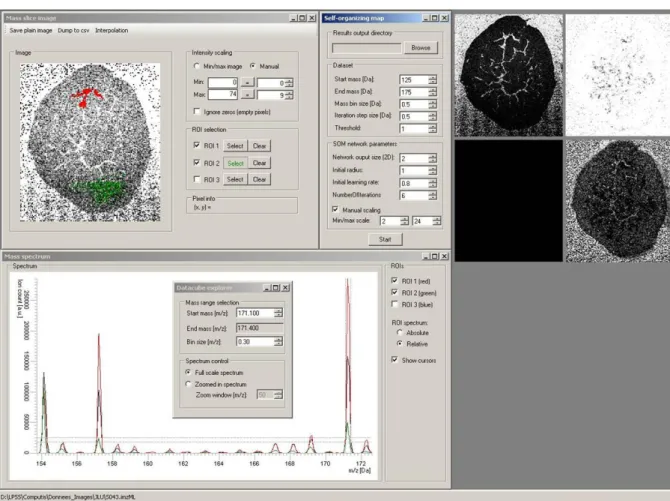
Figure 1 illustrates the use of Data Cube Explorer on a rodent urinary bladder dataset (image from Justus Liebig University). An image of the peak at m/z 171.10 Th is presented as well as
spectra associated to the entire image, and the two Regions of Interest selected in the image. The self-organizing map is able to bring out the most interesting images in the dataset.
Figure 1: Application of Data Cube Explorer on a rodent urinary bladder dataset
Bottom: Selection of a mass interval 171.1<m/z<171.4 in the spectrum; display of the sample average spectrum (black line) and the spectra of the selected regions of interest (red and green lines)
Top left: Image of the mass interval selected in the spectrum and selection of two Regions of Interest by coloring the area by moving the computer mouse
Top center: Parameters for the self-organizing map computation (zone of the spectrum, number of images, parameters of the self-organizing map algorithm)
Top right: Images selected by the self-organizing map method (143.1 Th, 153.1 Th, 156 Th, 171.2 Th)
SpectViewer
SpectViewer is a software module developed by French Atomic Energy Commission (CEA) under Windows and Linux for processing and visualization of MALDI-ToF, ToF-SIMS and DESI mass spectrometry imaging, with several tools providing user assistance for the interpretation of data. SpectViewer handles datasets in Analyze 7.5 (Applied Biosystems), GRD generated by SurfaceLab6 software (IonTof), BrukerFlex (Bruker), Orbitrap (ThermoFisher) and imzML formats. SpectViewer is available through partnership with French Atomic Energy Commission.
In addition to classical data display and exploration functionalities (spectrum and image display, peak and pixel picking, zooming on spectra and images, ROI selection), SpectViewer
extracts the peak list for faster molecule identification with public biological databanks, and provides some more specialized treatments such as denoising spectra or structure analysis by clustering methods. SpectViewer offers a fast processing and display of original data: no binning for MALDI and DESI data, no binning or user-defined binning for SIMS data. It also enables to overlay the images of two or three peaks of the dataset to compare their respective locations in the sample.
As assistance to the interpretation of data, SpectViewer computes several indicators:
The relative variance spectrum is an indicator of how much the image corresponding to a
peak deviates from a uniform Poisson noise image. This simple and fast tool greatly highlights peaks that have a highly contrasted spatial distribution.
Moran index,50 is an autocorrelation indicator measuring the spatial auto-covariance of a
point with the neighbour points. This index evaluates if a local pattern is clustered, dispersed or random. It highlights peaks associated to clustered spatial areas, which is particularly adapted to detect thin local structures such as membranes, in images.
The correlation matrix can be calculated between all peaks (computed from binned data)
or between one given m/z and all other bins of m/z. The correlation spectrum associated to one given m/z brings out correlated m/z, which are often co-localised or complementary with the given m/z.
SpectViewer also includes several clustering tools to perform spatial (i.e. pixel-based) classification or spectral (i.e. m/z-based) classification. The K-means clustering is one of the simplest and fastest classification methods. The time for running a K-means clustering,51 usually lasts only some seconds. Stochastic K-means,52 optimizes both the cluster position and the cluster number. The random projection tree clustering,53-54 consists in classifying data by random tree coupled to random projection sorting rules and a dimensionality reduction method. The hierarchical clustering performs clustering inside a zone defined by a preceding clustering,55.
The diffusion map method,56-57-58 uses the eigenfunctions of a Markov transition matrix, defining a random walk on the data, to represent spectral data as a cloud of points in the Euclidean space. The eigenvectors of the Markov matrix are used as coordinates of the data set. The diffusion distance between a pair of points is calculated as a L2 Euclidean distance weighted by the eigenvalues of the Markov matrix. By keeping only the top eigenvectors, it is possible to reduce the dimensionality of the problem with a limited precision loss. Then a clustering analysis can be performed in the reduced data.
According to our experience, it is necessary to have several classification methods available as no method is able to classify perfectly all biological samples. The K-means algorithm is often giving good results at little CPU cost and provides structured classification images that can be physically interpreted. But in some cases, the K-means method is not able to classify data and more complex methods, such as the diffusion map method, are necessary.
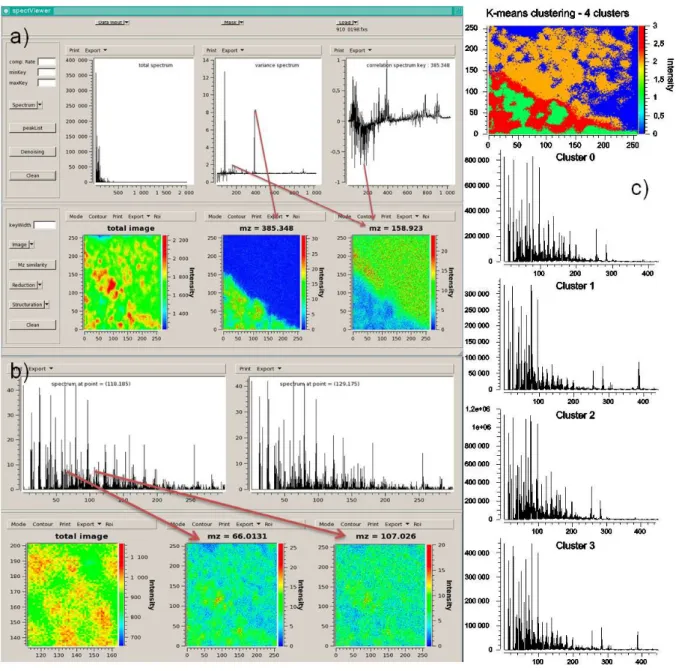
The use of SpectViewer is presented on a coronal section of mouse brain tissue (part of the corpus callosum and caudate putamen of 256*256 µm²) analyzed by French National Center for Scientific Research – Institute for Natural Substance Chemistry (CNRS-ICSN) in positive mode with Tof-SIMS equipment.
Figure 2a presents the total image with the associated total spectrum, the relative variance spectrum enabling to discriminate interesting peaks in the spectrum, and the correlation spectrum with m/z 385.34 Th. The relative variance highlights cholesterol (m/z 385.34 Th) in
the corpus callosum and m/z 158.92 Th in the caudate putamen. Peak at m/z 158.92 Th is also inversely correlated to m/z 385.34 Th. Both peaks provide complementary images.
Figure 2b displays a zoom of the total image with m/z included in 1 to 100 Th, as the red spots are particularly visible below 100 Th. In order to characterize the high-intensity spots in the caudate putamen (red spots in the total image), the spectra of pixel (x=118, y=185) in a red spot and pixel (x=129, y=175) in a green zone were displayed. By comparison of the spectra, it appears that m/z = 66.01 and 107.02 Th are localized in the spots.
Figure 4c shows a K-means classification on pixels with 4 clusters, associated to the cluster spectra. The cluster image shows cluster 0 in blue, cluster 1 in green, cluster 2 in orange and cluster 3 in red (color correspondence is indicated in the bar scale on the right side of the cluster image). The corpus callosum and the caudate putamen are well separated and subzones fitting with the spots are identified.
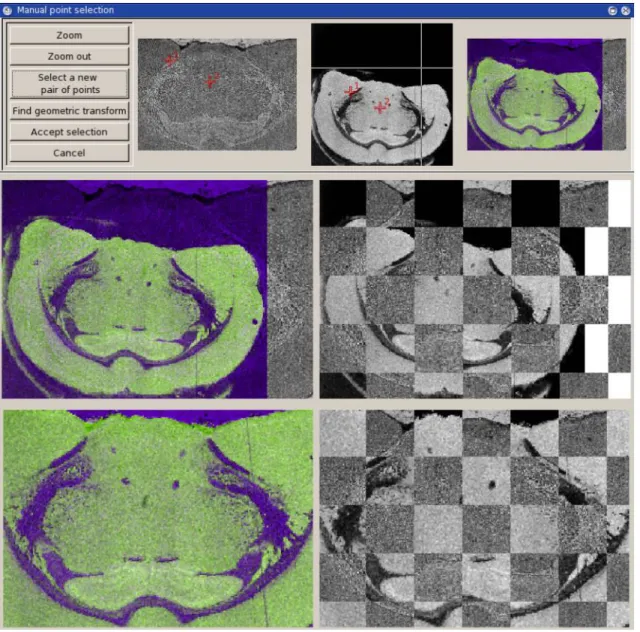
EasyReg2D
EasyReg2D is a data fusion module developed by French Atomic Energy Commission (CEA) under Linux to register two images. The method supports multimodal registrations, for example microscopic image coming from a histopathology analysis with an image extracted from mass spectrometry data. Input image format is a plain ASCII file, containing a bidimensional array of gray intensity values (integers or floating numbers). Images in standard formats (jpeg, tiff, gif, bmp) can be converted in ASCII format by ImageJ free software http://rsbweb.nih.gov/ij/.
The geometric transformation registering the two images is an affine transform (6 degrees of freedom in 2D); the merit function is the mutual information,59-60. The merit function is minimized using a Quasi-Newton method. If needed, the graphical user interface allows the user to provide the optimizer with a good starting point (semi-manual registration).
Figure 3 shows the application of EasyReg2D on a microscopy image and a Tof-SIMS image of a rat brain tissue provided by French National Center for Scientific Research – Institute for Natural Substance Chemistry (CNRS-ICSN). Registration is initialized with two user-defined starting values (top). Initial images are superimposed without registration (middle) and after registration (bottom).
Figure 3: Application of EasyReg2D on a rat brain tissue dataset
BioMap
BioMap,61 is a free image analysis platform for Mass Spectrometry and Magnetic Resonance Imaging developed by Novartis under IDL. Visualization is based on multi-planar reconstruction allowing the extraction of arbitrary slices from a 3D-volume. Initially dedicated to data in Analyze format for MSI, Novartis adapted BioMap during the Computis project to also read imzML format. BioMap is available under Windows and Linux for MALDI-ToF and DESI data. It can be downloaded at http://www.maldi-msi.org
Well-known by proteomics teams for its visualization capacities and biology well-adapted functionalities, BioMap allows spectrum and image display with numerous colour tables, geometrical transformations (translation, rotation, flipping and resizing of images), adjustment of intensity, zooming on images and spectra, selection and treatment of multiple ROIs, statistical and histogram analysis, geometrical operations, and annotation of images. Simple calculations on images are available: spatial or temporal filtering, baseline correction, detrending (removal of a linear drift of the signal).
In order to manage large datasets with limited memory computers, BioMap offers the possibility to download and process only part of a dataset (a range of m/z). Display functions enabling to view simultaneously all images of a dataset or to create a movie are particularly useful to find the interesting m/z. Co-registration enables to superimpose and compare several images issued from different slices of a sample or different compatible samples, or to compare the position of patterns appearing at different m/z.
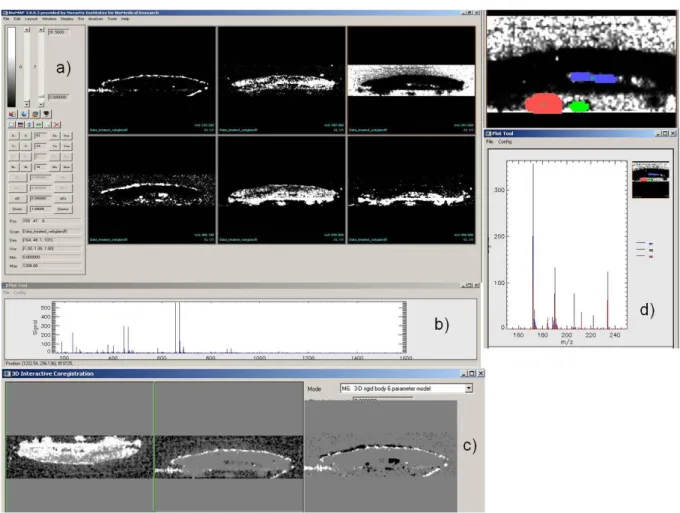
An example of BioMap is presented on a human cadaveric abdominal skin biopsy which was treated topically with an anti-acne development compound at m/z 466 (image from Novartis). The tissue was sectioned to provide a cross section of the full thickness of the skin (from epidermis to hypodermis/subcutaneous fat).
Figure 4: Application of BioMap on a sebaceous gland dataset
Figure 4a displays some characteristic m/z in positive mode, highlighting specific parts of the image: 227.22 Th,62 (halaminol A C14H29NO, a sphingoid base with an antimicrobial activity present at the skin surface), 265.9 Th, 290.44 Th (dihydrotestosterone), 466 Th (anti-acne compound), 655.63 Th,63 (18:1 cholesteryl ester C45H73D5O2) and 860.9 Th. Figure 4b shows the total spectrum of the sample.
Figure 4c illustrates the co-registration function of Biomap. Complementary images at m/z 290.44 and 655.63 Th were co-registered after a rotation of 180° of the first image. The image at m/z 228.2 Th was superimposed with the one at m/z 291 Th and the one at m/z 466.1 Th to show the position of this thin zone compared to the others.
In figure 4d, three Regions Of Interest (ROI) were selected and the spectra of each ROI are displayed.
vBrowser editor and imzML plug-in
VBrowser provides a single frontend application to the networked resources. It renders a file-based GUI for the access of the resources, similar to an explorer-like browser. It supports Grid-based file systems like Grid-FTP, SSH-FTP, SRM, LFC and SRB out of the box while presenting them to the user in a homogeneous and familiar tree-like structure. vBrowser is developed by Power Computing & Communication and is part of the Dutch Virtual Laboratory for e-sciences,64-65.
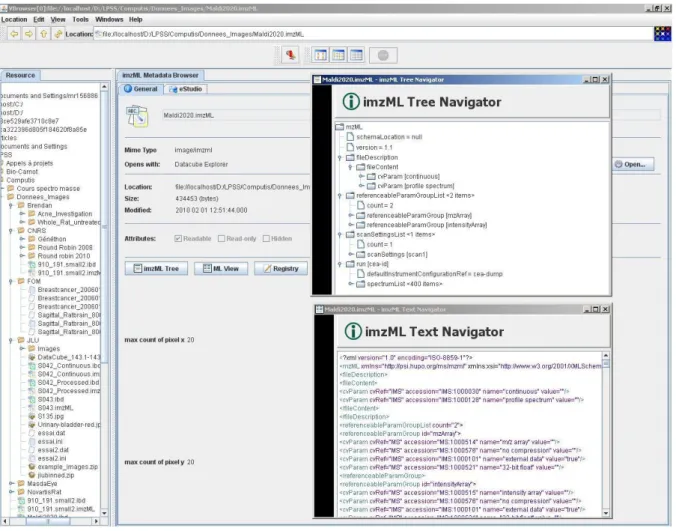
The imzML plugin (Figure 5) from VBrowser provides advanced features for browsing imzML data files. It provides both tree-like and text based navigation of imzML metadata.
The imzML metadata can be represented as an organized tree, an XML text, or can be edited with any text editor.
Figure 5: imzML metadata browser for file exploration and navigation in imzML data
imzML converters
Two converters were developed under Windows to generate imzML files out of proprietary formats. The “raw to imML converter” was developed by Justus Liebig University for raw files from Thermo Fisher Scientific. This tool can also combine multiple raw files into one imzML file, which can be used to process DESI imaging data. It can be freely downloaded on
http://www.imzml.org.
The converter “ToimzML” was developed by French Atomic Energy Commission for Analyze 7.5 files from Applied Biosystems, GRD files generated by SurfaceLab6 (versions 6.0, 6.1 and 6.2) from Ion-Tof, BrukerFlex files and Orbitrap files from ThermoFisher. It is available on demand at marie-france.robbe@cea.fr, with a manual and example files.
Conclusions
To extend the panel of software tools able to process mass spectrometry imaging datasets, two user-friendly tools for visualization and data analysis with multiple processing functionalities were specially developed by the Computis European project. Data Cube Explorer is an easy visualization freeware for MALDI-ToF and ToF-SIMS images, with an image-classification tool. SpectViewer offers, in addition to visualization functions, an assistance to the interpretation of data, classification functionalities, image overlay, and peak list extraction to interrogate biological databases. SpectViewer is able to deal with original datasets (no binning) issued from MALDI-ToF, ToF-SIMS and DESI equipments. The capacities of
SpectViewer are complemented by EasyReg2D data fusion module for multimodal registration of images.
The well-known BioMap free platform was adapted to parse imzML files, thus enlarging the access to its multiple visualization and processing capacities, particularly dedicated to biologists, to a larger community of users.
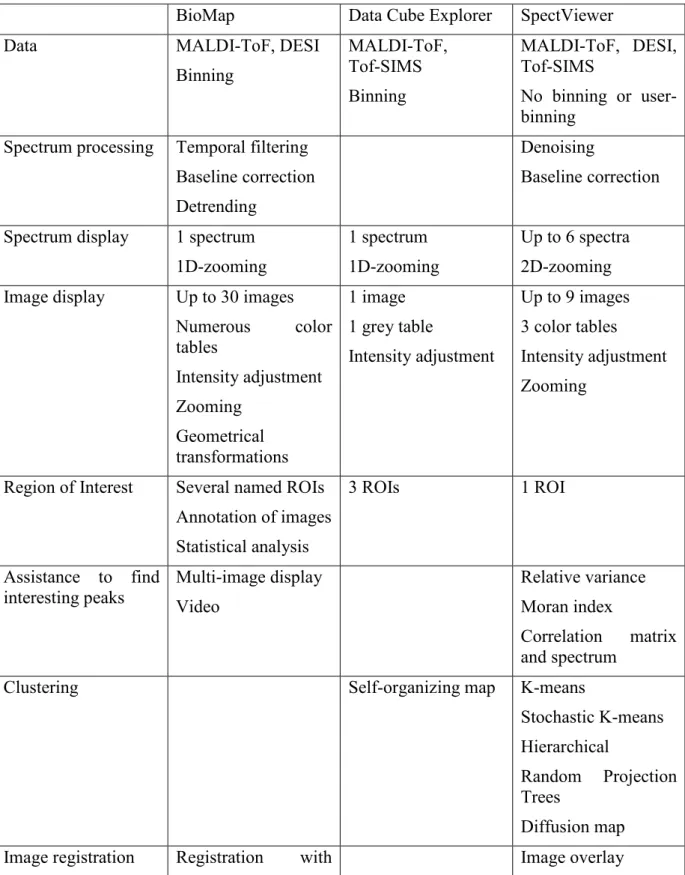
Table 1 summarizes the main functionalities offered by the three visualization and processing software tools.
BioMap Data Cube Explorer SpectViewer Data MALDI-ToF, DESI
Binning MALDI-ToF, Tof-SIMS Binning MALDI-ToF, DESI, Tof-SIMS No binning or user-binning
Spectrum processing Temporal filtering Baseline correction Detrending
Denoising
Baseline correction
Spectrum display 1 spectrum 1D-zooming
1 spectrum 1D-zooming
Up to 6 spectra 2D-zooming Image display Up to 30 images
Numerous color tables Intensity adjustment Zooming Geometrical transformations 1 image 1 grey table Intensity adjustment Up to 9 images 3 color tables Intensity adjustment Zooming
Region of Interest Several named ROIs Annotation of images Statistical analysis 3 ROIs 1 ROI Assistance to find interesting peaks Multi-image display Video Relative variance Moran index Correlation matrix and spectrum
Clustering Self-organizing map K-means
Stochastic K-means Hierarchical
Random Projection Trees
Diffusion map Image registration Registration with Image overlay
different models of 2 images (identical number of pixels)
Registration via EasyReg2D
Peak list Parametrical peak list
extraction Table 1: Main functionalities of BioMap, Data Cube Explorer and SpectViewer
The joint efforts of the Computis project partners led to a major success: the development of software tools able to process imaging datasets issued from the majority of the mass spectrometry imaging instruments thanks to the definition of the common imzML format and the development of converters from equipment proprietary formats towards this standard format. In order to make easier the use of imzML format, the Computis project developed the vBrowser editor for imzML files to offer a comfortable lecture of imzML datasets with a tree-like display of imzML keywords.
Proteomics and mass spectrometry teams have now at their disposal a complete range of software tools to visualize and process mass spectrometry imaging data. Teams are no longer limited to the use of proprietary software to process their data; they can now choose the best suited software for their application and can process and compare images issued from different instruments with the same software.
Acknowledgement
Financial support from the FP6 program of the European Commission (COMPUTIS project n°LSHG-CT-2005-518194) is gratefully acknowledged.
References
1. R.T. Short, J.M. McMahon, W.M. Holland and P.J. Todd, “Charge compensation for imaging large insulating samples by using secondary ion tandem mass spectrometry”, Journal
of the American Society for Mass Spectrometry 5, 37-43 (1994).
2. J.M. McMahon, N.N. Dookeran and P.J. Todd, “Organic ion imaging beyond the limit of static secondary ion mass spectrometry”, Journal of the American Society for Mass
Spectrometry 6, 1047-1058 (1995).
3. M.C. Mony and E. Larras-Regard, “Imaging of subcellular structures by scanning ion microscopy and mass spectrometry - Advantage of cryofixation and freeze substitution procedure over chemical preparation”, Biology of the Cell 89, 199-210 (1997).
4. M.L. Pacholski and N. Winograd, “Imaging with mass spectrometry”, Chemical Reviews
99, 2977-3005 (1999).
5. R. Caprioli, T.B. Farmer and J. Gile, “Molecular imaging of biological samples: localization of peptides and proteins using MALDI-TOF MS”, Analytical Chemistry 69, 4751-4760 (1997).
6. M. Stoeckli, T.B. Farmer and R. M. Caprioli, “Automated mass spectrometry imaging with a matrix-assisted laser desorption ionization time-of-flight instrument”, Journal of the
American Society for Mass Spectrometry 10, 67-71 (1999).
7. B. Spengler, M. Hubert, et al., “MALDI Ion Imaging and Biolocial Ion Imaging with a new Scanning UV-Laser Microprobe”, Proceedings of the 42nd Annual Conference on Mass Spectrometry and Allied Topics, Chicago, Illinois, May 19 - June 3, 1994.
8. M.S Stoeckli, P. Chaurand, D.E. Hallahan and R.M. Caprioli, “Imaging mass spectrometry: A new technology for the analysis of protein expression in mammalian tissues”, Nature medicine 7, 493-496 (2001).
9. Y. Yasui, D. McLerran, B.L. Adam, M. Winget, M. Thornquist and Z. Feng, “An automated peak identification/calibration procedure for high-dimensional protein measures from mass spectrometers”, Journal of Biomedicine and Biotechnology 2003:4, 242-248 (2003).
10. P. Chaurand, S.A. Schwartz and R.M. Caprioli, “Imaging mass spectrometry: a new tool to investigate the spatial organization of peptides and proteins in mammalian tissue sections”,
Current Opinion in Chemical Biology 6, 676-681 (2002).
11. L.A. McDonnell and R.M.A. Heeren, “Imaging mass spectrometry”, Mass Spectrometry
Reviews 26, 606-643 (2007).
12. B. Spengler and M. Hubert, “Scanning microprobe matrix-assisted laser desorption ionization (SMALDI) mass spectrometry: Instrumentation for sub-micrometer resolved LDI and MALDI surface analysis”, Journal of the American Society of Mass Spectrometry 13, 735-748 (2002).
13. A.F.M. Altelaar, I.M. Taban, L.A. McDonnell, P.D.E.M. Verhaert, R.P.J. de Lange, R.A.H. Adan, W.J. Mooi, R.M.A. Heeren and S.R. Piersma. High-resolution MALDI imaging mass spectrometry allows localization of peptide distributions at cellular length scales in pituitary tissue sections, International Journal of Mass Spectrometry 260, 203-211 (2007). 14. M. Froesch, S.L. Luxembourg, D. Verheijde and R.M. A. Heeren, “Imaging mass spectrometry using a delay line detector”, European Journal of Mass Spectrometry 16 (1), 35-45 (2010).
15. A. Römpp, S. Guenther, Z. Takats and B. Spengler, “Mass spectrometry imaging with high-resolution in mass and space (HR² MSI) for reliable investigation of drug compound distributions on the cellular level”, Analytical and Bioanalytical Chemistry 401, 65-73 (2011). 16. S.A. Schwartz, M.L. Reyzer and R.M. Caprioli, “Direct tissue analysis using matrix-assisted laser desorption/ionization mass spectrometry: practical aspects of sample preparation”, Journal of Mass Spectrometry 38, 699-708 (2003).
17. R. Lemaire, M. Wisztorski, A. Desmons, J.C. Tabet, R. Day, M. Salzet and I. Fournier, “MALDI-MS direct tissue analysis of proteins: Improving signal sensitivity using organic treatments”, Analytical Chemistry 78, 7145-7153 (2006).
18. E.H. Seeley, S.R. Oppenheimer, D. Mi, P. Chaurand and R.M. Caprioli, “Enhancement of protein sensitivity for MALDI imaging mass spectrometry after chemical treatment of tissue sections”, Journal of the American Society of Mass Spectrometry 19, 1069-1077 (2008). 19. J.O.R. Gustafsson, S.R. McColl and P. Hoffmann, “Imaging mass spectrometry and its methodological application to murine tissue”, Journal of Proteomics & Bioinformatics 1 (December 2008).
20. J. Yang and R.M. Caprioli, “Matrix sublimation/recrystallization for imaging proteins by mass spectrometry at high spatial resolution”, Analytical Chemistry 83, 5728-5734 (2011). 21. P. Chaurand and R.M. Caprioli, “Direct profiling and imaging of peptides and proteins from mammalian cells and tissue sections by mass spectrometry”, Electrophoresis 23, 3125-3135 (2002).
22. P. Chaurand, S.A. Schwartz, M.L. Reyzer and R. Caprioli, “Imaging mass spectrometry: Principles and potentials”, Toxicologic pathology 33, 92-101 (2005).
23. I.M. Taban, A.F.M. Altelaar, et al., “Imaging of peptides in the rat brain using MALDI-FTICR mass spectrometry”, Journal of the American Society for Mass Spectrometry 18 (1), 145-151 (2007).
24. A. Römpp, S. Guenther, et al., “Histology by Mass Spectrometry: Label-Free Tissue Characterization Obtained from High-Accuracy Bioanalytical Imaging”, Angewandte Chemie
International Edition 49 (22), 3834-3838 (2010).
25. D.S. Cornett, M.L. Reyzer, P. Chaurand and R.M. Caprioli, “MALDI imaging mass spectrometry: molecular snapshots of biological systems”, Nature methods 4 (10), 828-833 (2007).
26. C. Murayama and Y. Kimura, “Imaging mass spectrometry: principle and application”,
Biophysics Reviews 1, 131-139 (2009).
27. A. Biswas, K.C. Mynampati, S. Umashankar, S. Reuben, G. Parab, R. Rao, V.S. Kannan and S. Swarup, “MetDAT: a modular and workflow-based free online pipeline for mass spectrometry data processing, analysis and interpretation”, Bioinformatics 26 (20), 2639-2640 (2010).
28. D. Hong and F. Zhang, “Weighted elastic net model for mass spectrometry imaging processing”, Mathematical Modelling of Natural Phenomena 5 (3), 115-133 (2010).
29. F.Z. Zhang and D. Hong, “Elastic net-based framework for imaging mass spectrometry data biomarker selection and classification”, Statistics in medicine 30, 753-768 (2011).
30. T. Hayasaka, N. Goto-Inoue, M. Ushijima, I. Yao, A. Yuba-Kubo, M. Wakui, S. Kajihara, M. Matsuura and M. Setou, “Development of imaging mass spectrometry (IMS) dataset extractor software, IMS convolution”, Analytical and Bioanalytical Chemistry 401, 183-193 (2011).
31. J.M. Fonville, C. Carter, O. Cloarec, J.K. Nicholson, J.C. Lindon, J. Bunch and E. Holmes, “Robust data processing and normalization strategy for MALDI mass spectrometric imaging”, Analytical Chemistry 84, 1310-1319 (2012).
32. O. Jardin-Mathé, D. Bonnel, J. Franck, M. Wisztorski, E. Macagno, I. Fournier and M. Salzet, “MITICS (MALDI Imaging Team Imaging Computing System): A new open source mass spectrometry imaging software”, Journal of Proteomics 71, 332-345 (2008).
33. G. McCombie, D. Staab, M. Stoeckli and R. Knochenmuss, “Spatial and spectral correlations in MALDI mass spectrometry images by clustering and multivariate analysis”,
Analytical Chemistry 77, 6118-6124 (2005).
34. E.R. Muir, I.J. Ndiour, N.A. Le Goasduff, R.A. Moffitt, T. Liu, M.C. Sullards, A.H. Merrill Jr, Y. Chen and M.D. Wang, “Multivariate analysis of imaging mass spectrometry data”, Proceedings of the 7th IEEE International Conference on BioInformatics and BioEngineering, 14-17 October 2007, Boston, USA, 472-479.
35. L.A. Klerk, A. Broersen, I.W. Fletcher, R. van Liere and R.M.A. Heeren, “Extended data analysis strategies for high resolution imaging MS: New methods to deal with extremely large image hyperspectral datasets”, International Journal of Mass Spectrometry 260, 222-236 (2007).
36. M. Hanselmann, M. Kirchner, B.Y. Renard, E.R. Amstalden, K. Glunde, R.M.A. Heeren and F.A. Hamprecht, “Concise representation of mass spectrometry images by probabilistic latent semantic analysis”, Analytical Chemistry 80 (24), 9649-9658 (2008).
37. ASTM Standard E1947 – 98, “Standard Specification for Analytical Data Interchange Protocol for Chromatographic Data”, ASTM International, West Conshohocken, PA, doi: 10.1520/E1947-98R09, 2009.
38. P.G.A. Pedrioli, J.K. Eng, R. Hubley, M. Vogelzang, E.W. Deutsch, B. Raught , B. Pratt, E. Nilsson, R. Angeletti, R. Apweiler, K. Cheung, C.E. Costello, H. Hermjakob, S. Huang, R.K. Julian, E. Kapp, M.E. McComb, S.G. Oliver, G. Omenn, N.W. Paton, R. Simpson, R. Smith, C.F. Taylor, W. Zhu and R. Aebersold, “A common open representation of mass spectrometry data and its application in a proteomics research environment”, Nature
Biotechnology 22 (11), 1459-1466 (2004).
39. S.M. Lin, L. Zhu, A.Q. Winter, M. Sasinowski and W.A. Kibbe, “What is mzXML good for?”, Expert Review of Proteomics 2 (6), 839-845 (2005).
40. S. Orchard, L. Montechi-Palazzi, E.W. Deutsch, P.A. Binz, A.R. Jones, N. Paton, A. Pizarro, D.M. Creasy, J. Wojcik and H. Hermjakob, “Five years of progress in the Standardization of Proteomics Data”, 4th Annual Spring Workshop of the HUPO-Proteomics Standards Initiative, April 23–25, 2007, Ecole Nationale Supérieure (ENS), Lyon, France.
Proteomics 7 (19), 3436–3440 (2007).
41. E.W. Deutsch, “mzML: A single, unifying data format for mass spectrometer output”,
Proteomics 8 (14), 2776–2777 (2008).
42. L. Martens, M. Chambers, M. Sturm, D. Kessner, F. Levander, J. Shofstahl, W.H. Tang, A. Römpp, S. Neumann, A.D. Pizarro, L. Montecchi-Palazzi, N. Tasman, M. Coleman, F. Reisinger, P. Souda, H. Hermjakob, P.A. Binz and E.W. Deutsch, “mzML—a Community Standard for Mass Spectrometry Data”, Molecular & Cellular Proteomics 1 (2011). doi: 10.1074/mcp.R110.000133–6.
43. A. Römpp, “Imaging mzML (imzML) – a common data format for imaging mass spectrometry”, HUPO PSI Workshop, Turku, Finland, 26-29 April 2009.
44. A. Römpp, T. Schramm, A. Hester, I. Klinkert, J.P. Both, R.M.A. Heeren, M. Stoeckli and B. Spengler. Chapter “imzML: Imaging Mass Spectrometry Markup Language: A Common Data Format for Mass Spectrometry Imaging inData Mining in Proteomics: From Standards to Applications”, in Methods in Molecular Biology 696, Humana Press, New York, pp. 205-224 (2011).
45. T. Schramm, A. Hester, I. Klinkert, J.P. Both, R.M.A. Heeren, A. Brunelle, O. Laprévote, N. Desbenoit, M.F. Robbe, M. Stoeckli, B. Spengler and A. Römpp, “imzML – a common data format for the flexible exchange and processing of mass spectrometry imaging data”,
Journal of Proteomics 75 (16), 5106-5110 (2012).
46. J.O.R. Gustafsson, M.K. Oehler, A. Ruszkiewicz, S.R. McColl and P. Hoffmann, “MALDI Imaging Mass Spectrometry (MALDI-IMS)-Application of spatial proteomics for ovarian cancer classification and diagnosis”, International Journal of Molecular Sciences 12 (1), 773-794 (2011).
47. D.F. Smith, A. Kharchenko, M. Konijnenburg, I. Klinkert, L. Paša-Tolić and R.M.A. Heeren, “Advanced mass calibration and visualization for FT-ICR mass spectrometry imaging”, Journal of the American Society of Mass Spectrometry 23 (11), 1865-1872 (2012).
48. I. Klinkert and R.M.A. Heeren, “Methods for Full Resolution Data Exploration and Visualization for large 2D and 3D Mass Spectrometry Imaging Datasets”, in preparation (2013).
49. T. Kohonen, “Self-organized formation of topologically correct feature maps”, Biological
Cybernetics 43, 59-69 (1982).
50. G. Carlo and X. Guyon, Modélisation et statistiques spatiales, Springer, Heidelberg, Collection Mathématiques et applications 63 (2008).
51. T. Hastie, R. Tibshirani and J. Friedman, The elements of statistical learnings – Data
mining, inferences and predictions, Springer Series in Statistics, New York (2001).
52. C. Boutsidis, A. Zouzias, M.W. Mahoney and P. Drineas, “Stochastic dimensionality reduction for K-means clustering”, Cornell University Library: arXiv:1110.2897 (2011). 53. S. Dasgupta and Y. Freund, “Random projection trees and low dimensional manifolds”, Proceedings of the 40th annual ACM symposium on Theory of computing, May, New York, NY, USA, 537–546 (2008). STOC '08. Victoria, British Columbia, Canada.
54. D. Yan, L. Huang and M.I. Jordan, “Fast approximate spectral clustering”, Proceedings of the 15th ACM Conference on Knowledge Discovery and Data Mining (SIGKDD), June 28-July 1, 2009, Paris, France, 907-916.
55. T.P. Rebotier and K.A. Prather, “Aerosol time-of-flight mass spectrometry data analysis: a benchmark of clustering algorithms”, Analytica Chimica Acta 585 (1), 38-54 (2007).
56. S. Lafon and A.B. Lee, “Diffusion maps and coarse graining: a unified framework for dimensionality reduction - Graph partitioning and data set parameterization”, IEEE
Transactions on Pattern Analysis and Machine Intelligence 28 (9), 1393-1403 (2006).
57. S. Lafon, Y. Keller and R.R. Coifman, “Data fusion and multicue data matching by diffusion maps”, IEEE Transactions on Pattern Analysis and Machine Intelligence 28 (11), 1784-1797 (2006).
58. R.R. Coifman and S. Lafon, “Diffusion Maps”, Applied and Computational Harmonic
Analysis 21, 5-30 (2006).
59. P. Viola and W. M. Wells III, “Alignment by maximization of mutual information,” Proceedings of the 5th Int. Conf. Computer Vision, Boston, MA, June 20–23, 1995, 16–23. 60. P. Thévenaz and M. Unser, “Optimization of Mutual Information for Multiresolution Image Registration”, IEEE Transactions on Image Processing 9 (12), 2083-2099 (2000). 61. N. Hosokawa, Y. Sugiura and M. Setou, Ion image reconstruction using BioMap
software. Imaging Mass Spectrometry, Springerlink, Part V, Japan, pp. 113-126 (2010).
62. D.R. Drake, K.A. Brogden, D.V. Dawson and P.W. Wertz, “Antimicrobial lipids at the skin surface”, Journal of Lipid Research 49, 4-11 (2008).
63. B. In Ro and T.L. Lawson, “The role of sebaceous gland activity and scalp microfloral metabolism in the etiology of seborrheic dermatitis and Dandruff”, Journal of Investigative
dermatology, Symposium proceedings 10, 194-197 (2005).
64. H. Afsarmanesh, R.G. Belleman, A.S.Z. Belloum, A. Benabdelkader, J.F.J. van den Brand, G.B. Eijkel, A. Frenkel, C. Garita, D.L. Groep, R.M.A. Heeren, Z.W. Hendrikse, B.L.O. Hertzberger, J.A. Kaandorp, E.C. Kaletas, V. Korkhov, C.T.A.M. de Laat, P.M.A. Sloot, D. Vasunin, A. Visser and H.H. Yakali, “VLAM-G: a grid-based virtual laboratory”,
65. I. Klinkert, L.A. McDonnell, S.L. Luxembourg, A.F.M. Altelaar, E.R. Amstalden van Hove, S.R. Piersma and R.M.A. Heeren, “Tools and strategies for visualization of large image data sets in high-resolution imaging mass spectrometry”, Review of Scientific Instruments 78, paper 0053716 (2007).