HAL Id: cea-02916955
https://hal-cea.archives-ouvertes.fr/cea-02916955
Submitted on 18 Aug 2020Lithium Ruthenate in Basic Solutions
Reshma Rao, Michal Tulodziecki, Binghong Han, Marcel Risch, Artem
Abakumov, Yang Yu, Pinar Karayaylali, Magali Gauthier, María
Escudero-escribano, Yuki Orikasa, et al.
To cite this version:
Reshma Rao, Michal Tulodziecki, Binghong Han, Marcel Risch, Artem Abakumov, et al.. Reactivity with Water and Bulk Ruthenium Redox of Lithium Ruthenate in Basic Solutions. Advanced Functional Materials, Wiley, In press, 31 (2), pp.2002249. �10.1002/adfm.202002249�. �cea-02916955�
Reshma R Rao1,a,#,*, Michał Tulodziecki2,b,#, Binghong Han3,c,#*, Marcel Risch2,d, Artem
Abakumov4, Yang Yu3, Pinar Karayaylali1,e, Magali Gauthier2,f, María Escudero-Escribano5, Yuki Orikasa6, Yang Shao-Horn1,2,3*
1 Department of Mechanical Engineering, Massachusetts Institute of Technology,
Cambridge, Massachusetts 02139, United States
2 Research Laboratory of Electronics, Massachusetts Institute of Technology, Cambridge,
Massachusetts 02139, United States
3 Department of Materials Science and Engineering, Massachusetts Institute of
Technology, Cambridge, Massachusetts 02139, United States
4 Center for Energy Science and Technology, Skolkovo Institute of Science and
Technology, Nobel str. 3, 143026 Moscow, Russia
5 Department of Chemistry, University of Copenhagen, Universitetsparken 5, 2100
København Ø, Denmark
6 Department of Applied Chemistry, Ritsumeikan University, Kusatsu 525-8577, Japan
#Contributed equally *Corresponding authors
E-mail: reshma.rao@imperial.ac.uk, bhan@exponent.com, shaohorn@mit.edu Current Address
a Molecular Science Research Hub, Imperial College White City, London W12 0BZ,
United Kingdom
b Umicore, Watertorenstraat 33,2250 Olen, Belgium c Exponent Inc., Natick, MA 01760
d Nachwuchsgruppe Gestaltung des Sauerstoffentwicklungsmechanismus,
Helmholtz-Zentrum Berlin GmbH, 14109 Berlin, Germany
e Faurecia Clean Mobility, Biberbachstraße 9, 86154, Augsburg, Germany
f Université Paris-Saclay, CEA, CNRS, NIMBE, LEEL , 91191 Gif-sur-Yvette, France.
Abstract
The reactivity of water with Li-rich layered Li2RuO3 and partial exchange of Li2O with
H2O within the structure has been studied under aqueous (electro)chemical conditions.
Upon slow delithiation in water over long time periods, micron-size Li2RuO3 particles
structurally transform from an O3 structure to an O1 structure with a corresponding loss of 1.25 Li ions per formula unit. The O1 stacking of the honeycomb Ru layers is imaged using high-resolution HAADF-STEM, and the resulting structure is solved from X-ray powder diffraction and electron diffraction. In situ X-ray absorption spectroscopy suggests that reversible oxidation/reduction of bulk Ru sites is realized on potential cycling between 0.4 VRHE and 1.25 VRHE in basic solutions. In addition to surface redox
pseudocapacitance, the partially delithiated phase of Li2RuO3 shows high capacity which
can be attributed to bulk Ru redox in the structure. This work demonstrates that the interaction of aqueous electrolytes with Li-rich layered oxides, can result in the formation of new phases with (electro)chemical properties that are distinct from the parent material. This understanding is important for the design of aqueous batteries, electrochemical capacitors and chemically stable cathode materials for Li-ion batteries.
Layered transition metal oxides are an attractive class of materials that form the host structure for ion intercalation, which is the basis of several energy storage and conversion technologies such as Li-ion batteries[1]-[3], Na-ion batteries[4],[5] and electrochemical capacitors[6],[7]. The versatility of these materials lies in the fact that their chemical bonding and electronic structure can be modified by tuning the chemistry[8], incorporating structural[9],[10] or co-intercalated water[11], solvent molecules[12], ions[13], cation exchange[14], or by the use of polymeric and molecular species[15], providing a large range of functionalities.
Lithium-rich layered oxides, Li2MO3 (M = Mn, Ru, Ir) have gained increasing attention
in the last few years as positive electrode materials for Li-ion batteries due to their high capacity, which has been attributed to additional anionic redox processes beyond the conventional metal redox mechanisms[16]-[20]. Recently, in acidic solutions, layered Li3IrO4 has been shown to ion-exchange Li+ for H+ [21],[22]. In addition, chemical
delithiation studies[23],[24] on Li2MnO3 have shown that exchange of lithium ions by
protons is one possible means to compensate for the Li+ extraction at very low Li contents even under anhydrous non-aqueous environments, possibly by protons generated by the oxidation of electrolyte[25],[26]. The possibility of multiple (electro)chemical processes, specifically the triggering of the oxygen redox and ion-exchange reactions makes these materials very attractive for energy storage and conversion applications. Ion-exchanged layered oxides can exhibit (electro-)chemical and structural properties that are very different from their parent oxide. For instance, the ion exchange of Li+ by H+ in the layered Li2MnO3 is accompanied by a transition from the C2/c to the R-3m structure,
possibly due to the stabilization of the latter by strong hydrogen bonds[27]. Such a structural transformation is absent for spinel LiMn2O4 where the charge associated with
the delithiation process is accommodated solely by the Mn3+/4+ redox couple[28]. While the insertion of protons in the lattice is detrimental for the chemical stability of non-aqueous Li-ion battery positive electrode materials[23],[24], and is considered as a side reaction for aqueous Li-ion battery positive electrode materials where only Li+ insertion in the host material is desired[29], it is advantageous for increasing the pseudocapacitance or capacity in aqueous solutions. Such strategies have been exploited to increase the pseudocapacitance of Ru, Ir and Mn based materials, where the pseudocapacitance is associated with the faradaic charge-transfer in the surface or near surface region over a given potential range[6]. A prominent example is that of perruthenic acid nanosheets that were synthesized by Sugimoto et al[30]. by exchanging potassium ions from potassium perruthenate with protons via a topotactic proton-exchange reaction. The lamellar structure allows for electron conduction within the layers and proton conduction between the layers, which is a significant advantage compared to the state-of-the-art hydrous amorphous RuO2 electrodes that compromise on electronic conductivity due to the
discontinuous oxide framework[31]. Recent studies reveal that a new protonic iridate phase, H3+xIrO4, formed by room temperature acid leaching of Li-rich Li3IrO4[21],[22],
neutral/basic solutions leads to the formation of a material with new crystal structure and electrochemical properties differing from those of Li2RuO3. Structurally, Li2RuO3 differs
from the layered LiMO2 structures as Li2RuO3 has 1/3of the Li ions in the transition
metal layer, resulting in a formula of Li(Li1/3M2/3)O2[32]. Each Li-substituted transition
metal layer consists of a honeycomb lattice of edge sharing RuO6 octahedra forming
hexagonal rings centered with the LiO6 octahedra. Slow delithiation process by treating
the sample with water at room temperature for extended time periods (~1 month) results in the extraction of 1.25 Li+ ions per formula unit, with the formation of a structure that exhibits enhanced capacity. High-resolution transmission electron microscopy coupled with electron and X-ray powder diffraction reveal that the resultant structure is a modulated O1-type hexagonal closed packed structure, formed by shearing of the oxygen closed packed planes upon delithiation. In situ X-ray absorption studies confirm that this phase is capable of undergoing bulk Ru-redox in basic solution that results in the large capacity (~120 mAh/goxide) of the resultant phase. The unique interaction of Li-based
layered compounds with water induces structural and chemical transformations to form a phase with improved electrochemical activities providing a new avenue for material design for energy conversion and storage applications.
2. Results and Discussion
2.1. Cyclic voltammogram of as-prepared Li2RuO3 in 0.1 M KOH
Li2RuO3 was shown to exhibit two reversible redox processes in Ar-saturated 0.1 M
solid-state synthesis similar to previous work by Goodenough et al[32]. and Tarascon et al.[16],
and powder X-ray diffraction data of as-synthesized Li2RuO3 revealed a slightly
improved fit for a P21/m structure[33],[34] with a = 4.939 Å, b = 8.770 Å, c = 5.889 Å, β =
124.453o, χ2 = 2.4 (Figure S1A) than a C2/c structure with a = 4.941 Å, b = 8.773 Å, c = 9.867 Å, β = 100.073o, and χ2 = 3.09 (Figure S1B). While space group C2/c has been commonly used for Li2RuO3[32],[35],[36], the energetic difference among these two
structures from DFT results is comparable with kT (~30 meV/f.u.).
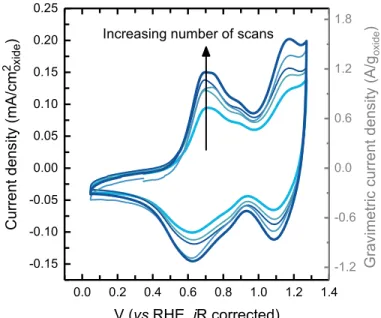
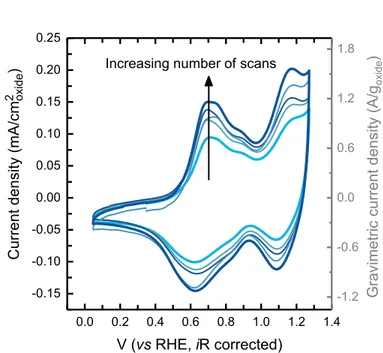
Cyclic voltammograms of the as prepared Li2RuO3 particles in 0.1 M KOH show large
pseudocapacitance and redox currents ~0.10 mA/cm2oxide (~1 A/goxide) compared to other
Ru, Ir and Mn based oxides (Li2Ru0.5Ir0.5O3, Li2Ru0.5Mn0.5O3, Li2Ru0.5Sn0.5O3, Li2IrO3,
LaMnO3, Li2MnO3, RuO2), which have current densities ranging from ~0.1-0.25 A/goxide
(Figure S2). The cyclic voltammograms of Li2RuO3 show two distinct redox peaks at 0.7
VRHE and 1.1 VRHE. These distinct redox transitions at ~0.7 VRHE and ~1.1 VRHE could be
attributed to the partial dissociation of –H2O and deprotonation of adsorbed –H2O/OH on
surface coordinatively unsaturated Ru sites, respectively, following previous assignments based on redox features from rutile RuO2 (110) single crystals[37],[38]. Interestingly, these
redox features were found to grow with each successive cyclic voltammetry scan, which were performed every 2 hours and the electrode was kept at open circuit during 2 hours between scans (cyclic voltammograms without 2 hour potentiostatic holding at open
absorption spectroscopy in the following sections.
Figure 1: Cyclic voltammogram (CV) of as-prepared Li2RuO3 drop-cast on glassy
carbon disk electrode in Ar-saturated 0.1 M KOH at 10 mV/s using a three-electrode cell.
CV measurements were performed every 2 hours between 0.05 and 1.25 VRHE for 6
cycles and the electrode was left at open circuit (~0.9 VRHE) between adjacent
measurements. The light blue curve corresponds to the first scan and the dark blue curve corresponds to the sixth scan. The nominal oxide loading is 0.255 mgoxide/cmdisk2 and the
carbon loading is 0.05 mgcarbon/cmdisk2.
Unlike rutile RuO2, a well known catalyst for oxygen evolution[39]-[42], Li2RuO3 was not
stable at OER-relevant potentials. Oxidative currents measured from cyclic voltammogram scans up to 1.7 VRHE decreased rapidly after the first scan and become
diminished after 50 cycles (Figure S4A). TEM imaging of the electrode after 50 cycles shows faults along the layers across individual crystals, indicating the instability of the layered structure at OER potentials (Figure S4B,C), presumably attributable to considerable oxygen loss and Ru dissolution. Thus we limited our measurements of these reversible redox processes in Figure 1 to 1.25 VRHE in this study.
0.0 0.2 0.4 0.6 0.8 1.0 1.2 1.4 -0.15 -0.10 -0.05 0.00 0.05 0.10 0.15 0.20 0.25 G ra vi m e tr ic c u rr e n t d e n si ty ( A /gox id e ) C u rr e n t d e n si ty ( m A /c m 2 oxid e ) V (vs RHE, iR corrected) F F F F % (6) F
Increasing number of scans
-1.2 -0.6 0.0 0.6 1.2 1.8
2.2. Lithium loss and structural changes of Li2RuO3 exposed to water and 0.1 M
KOH
Li2RuO3 pellets were exposed to water, 0.1 M KOH and held at three potentials (0.40,
0.65 and 0.90 VRHE) in 0.1 M KOH for 24 h. These potentials were chosen since they
were at lower and higher potentials relative to the redox peak at 0.7 VRHE shown in Figure 1. The changes in the crystal structure were analyzed using XRD and leached Li
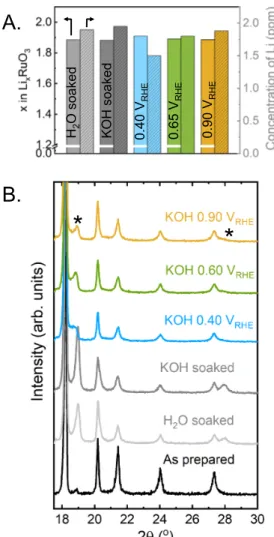
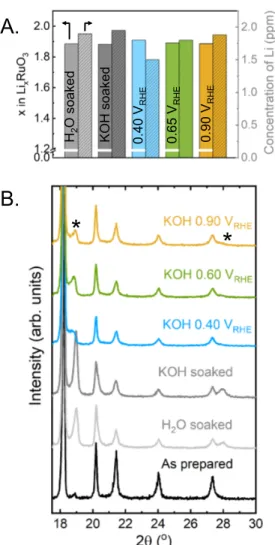
and Ru concentrations in the electrolyte were measured using mass spectrometry with inductively coupled plasma (ICP-MS). Comparable lithium concentrations were detected in the solutions at these five conditions (Figure 2A), where Li2RuO3 pellets lost ~0.1 Li
per formula unit. Lithium loss from Li2RuO3 was accompanied with the appearance of a
new minor phase (Figure 2B and Figure S5; the peaks associated with the new phase are marked by *). The amount of the new phase obtained in water and 0.1 M KOH was greater than in the samples held at 0.40, 0.65 and 0.90 VRHE. It was not straightforward
to determine the structural details of the new phase as it remained a minority in these samples (Figure 2B), which will be discussed in more detail in later sections.
Figure 2: (A) The concentration of Li ions in the solution after exposure of Li2RuO3
pellet (50 mg) to water, 0.1 M KOH and after holding at three potentials (0.40, 0.65 and 0.90) in 0.1 M KOH for 24 h, measured by inductively coupled plasma mass spectrometry, and corresponding lithium stoichiometry present in LixRuO3. (B) Parts of
the X-ray powder diffraction data of pellets after exposure described in (A) (CuKα radiation, full patterns are shown in Figure S5).
When the voltage of potentiostatic measurements was increased to 1.1 and 1.25 VRHE
(before and after the second redox transition in Figure 1), oxidative currents were observed and increased markedly with greater applied voltage (Figure 3A). Lithium stoichiometries of 1.8 and 1.4 per formula unit were obtained from ICP-MS analysis (Figure S6) for pellets held after 1.1 and 1.25 respectively. While the XRD pattern of the
H2 O so ake d KO H so ake d 0.40 V R H E 0.65 V R H E 0.90 V R H E
A.
B.
*
*
pellet held at 1.1 VRHE was similar to those exposed to water and 0.1 KOH without
potential holds, having a mixture of the major phase derived from Li2RuO3 and the new
phase (marked by *), that of pellet held at 1.25 VRHE was considerably different (Figure
3B), resembling that of as-prepared Li2RuO3. The XRD pattern of “Li1.4RuO3” was fitted
to a single phase with space group of P21/m, with similar unit cell parameters of a =
4.915 Å, b = 9.019 Å and c = 5.854 Å and β = 123.2o (Figure S7) to those of Li2RuO3
(Figure S1) and Li2-xRuO3 (a = 4.9398 Å, b = 8.6271 Å and c = 9.9353 Å and β = 99.262
Å, space group C2/c) upon lithium de-intercalation in non-aqueous electrolytes[35],[43]. The amount of charge found in the potentiostatic measurement of 1.25 VRHE in Figure 3A is equivalent to 0.5 Li per formula unit, which was comparable to that expected for
removal of 0.6 Li per formula unit electrochemically, indicative of the key role of electrochemical oxidation in lithium removal from Li2RuO3. To provide further insights
into processes responsible for the observed lithium loss and structure changes, we performed X-ray absorption spectroscopy experiments on these electrodes, which are discussed in the next section.
Figure 3: (A) Potentiostatic measurements of pristine 50 mg Li2RuO3 pellets at noted
potentials in 0.1 M KOH. Potentiostatic measurements were made for 24 hours at 0.4 VRHE, 0.65 VRHE, 0.90 VRHE and 1.10 VRHE and for 48 hours at 1.25 VRHE to ensure that
the oxidative current is stabilized at ~0 µA (B) X-ray powder diffraction data of pellets after exposure described in (A) (CuKα radiation, full patterns are shown in Figure S5).
2.3. X-ray absorption spectroscopy of pellets exposed to 0.1 M KOH at different voltages
In order to learn more about the oxidation state changes of Ru cations in Li2RuO3 upon
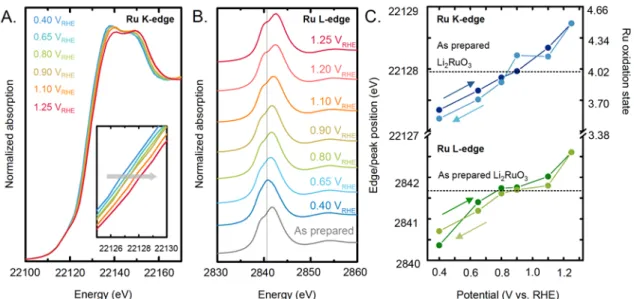
exposure to 0.1 M KOH, in situ X-ray absorption spectroscopy studies of the Ru K-edge (Figure 4A) and the Ru L3-edge (Figure 4B) were performed in a home-made
three-In te nsi ty (a rb . u ni ts)
A.
B.
*
0 750 1500 2250 3000 -600 -400 -200 0 200 1.25 V RHE 1.10 VRHE 0.90 VRHE 0.65 VRHE 0.40 VRHE C ur re nt (µ A ) Time (minutes)*
As prepared H2O soaked KOH soaked KOH 1.10 VRHE KOH 1.25 VRHEelectrode cell (as detailed in reference[44]) as a function of voltage. The working electrode is glassy carbon where a mixture of Li2RuO3 and carbon with volume ratio of 1:19 was
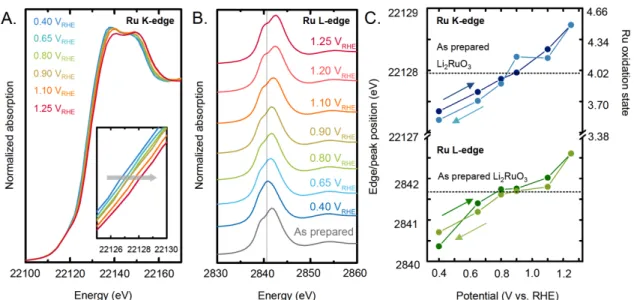
deposited, to form a thin layer of ~10 µm thick. With increasing voltage from 0.4 VRHE,
open circuit potential (~0.9 VRHE) to 1.25 VRHE, both Ru K-edge onset and L-edge white
line position shifted positively, indicative of bulk Ru oxidation[45],[46]. In addition, in the Ru L3-edge the features corresponding to t2g (c.a. 2840 eV) and eg (c.a. 2843 eV) splitting
showed increasing separation as a function of applied potential, indicative of stronger ligand field splitting and oxidation of Ru4+ to Ru4.5+, further supporting the trend of edge onset shift. As the voltage was reduced back to 0.4 VRHE, the edge shift of Ru K-edge and
peak shift of Ru L-edge returned back reversibly, where nearly identical Ru K-edge and L-edge energy was found at each potential (Figure 4C, Figure S8-S11), suggesting that bulk Ru can be oxidized and reduced reversibly in this experiment.
Calibrating Ru K-edge energy collected at each potential to Ru references in previous work[47], the oxidation state of Ru was estimated as a function of potential, as shown in
Figure 4C (right vertical axis). Interestingly, the oxidation state of Ru was found to
change from ~4+ in as-prepared Li2RuO3 and that at open circuit potential (~0.9 VRHE) to
~3.4+ at 0.4 VRHE and ~4.5+ at ~1.25 VRHE,which is in agreement with the presence of
increasing oxidative charge passed at higher potentials (Figure S8). These results suggest that ions can be reversibly removed and intercalated from Li2RuO3 in 0.1 M KOH,
Figure 4: In situ X-ray absorption spectroscopy data in 0.1 M KOH of (A) Ru K-edge
(22.117 keV) in fluorescence mode with an acquisition angle of approximately 45o. Time of acquisition of one spectrum is ~30 min (B) Ru L3-edge (2.8379 keV) in fluorescence
mode with an acquisition angle of approximately 45o. Time of acquisition of one
spectrum is ~ 50 min. Measurements were first collected at open circuit potential and then the potential was increased from 0.4 VRHE to 1.25 VRHE and decreased back to 0.4
VRHE. The working electrode is a glassy carbon where a mix of Li2RuO3 and carbon with
volume ratio of 1:19 was deposited, to form a thin layer of ~10 µm thick. The reference electrode is Ag/AgCl. (C) The shift in the edge position (for the K-edge) and the peak position (for the L-edge) suggests oxidation of bulk Ru with increasing potential. The Ru oxidation state corresponding to the Ru K-edge shift has been extracted from previous work.[47]
2.4. Identification of a new phase with greater redox currents
The formation of phase-pure O3-“Li1.4RuO3” obtained from potentiostatic holding at 1.25
VRHE in 0.1 M KOH did not increase the redox current densities (normalized to oxide
weight) relative to that of pristine Li2RuO3 (Figure 5A). We hypothesize that the
formation of the new phase upon exposure to water and 0.1 M KOH (in Figure 2) is responsible for enhanced redox currents as redox currents were found to increase with greater exposure time to 0.1 M KOH (Figure 1). As nearly identical lithium loss from Li2RuO3 and structural changes were found for pellets exposed to water and 0.1 M KOH
electrolytes with and without applied potentials (Figure 2), these chemical and structural changes and the formation of the new phase could be attributed to chemical reactions between Li2RuO3 and water but not electrochemical reactions. This argument is
supported by the fact that potentiostatic measurements (Figure 3A) showed no oxidation currents, thus no lithium de-intercalation from electrochemical oxidation from Li2RuO3.
We then performed a number of experiments to obtain a single-phase of this new structure including exposure to 1 M LiOH, 1 M H2SO4 and water at 90 oC (Figure S12).
Eventually a single-phase of this new structure was found by soaking Li2RuO3 (50 mg) in
water (20 ml) for ~30 days as seen in Figure 6A and Figure S13 where ICP-MS analysis of the resultant solution revealed ~1.25 lithium loss per formula unit of Li2RuO3 (Figure
Figure 5: (A) Cyclic voltammograms at 10 mV/s of as-prepared Li2RuO3 (in grey),
“Li1.4RuO3” (in red) and “Li0.75H1.25RuO3”(in blue) synthesized by holding at 1.25 VRHE
in Ar-saturated 0.1 M KOH for 48 hours and soaking in water for ~30 days respectively. Oxide particles were deposited on a glassy carbon disk and the nominal oxide loading was 0.255 mgoxide/cmdisk2. Helium ion microscopy images of the particles for the (B) as
prepared and (C) “O1-“Li0.75H1.25RuO3”” in water shows that exposure to water results in
breakdown of particles causing a three-fold increase in surface area. (D) Cyclic voltammograms for the “O1-“Li0.75H1.25RuO3”” sample in Ar-saturated 0.1 M LiOH,
NaOH, KOH, RbOH and CsOH at 10 mV/s. The presence of Li ions in solution results in a decrease in the redox peak currents with cycling (increasing scans are indicated by darker shades of blue). However, there is no change in the bulk structure of the sample soaked in a Li containing solution for a period of ~1 month. This suggests that the influence of Li results in a chemical/structural modification of the surface/interface of the electrode, causing loss of the redox currents (E) Variation of the log of the peak current as a function of the log of the scan rate for the anodic redox peak at ~0.7 VRHE for
“Li1.4RuO3” (in red) and “Li0.75H1.25RuO3” (in blue). A value of 0.5 for the slope suggests
0.0 0.2 0.4 0.6 0.8 1.0 1.2 -10.0 -7.5 -5.0 -2.5 0.0 2.5 5.0 7.5 C u rr e n t (A /g ) Potetial E (V vs RHE) Phase I Phase II Pristine 7.5 5.0 2.5 0.0 -2.5 -5.0 -7.5 -10.0 0.0 0.2 0.4 0.6 0.8 1.0 1.2 i (A/ g) V (vs. RHE, iR corrected) 0.0 0.2 0.4 0.6 0.8 1.0 1.2 -1.0 -0.5 0.0 0.5 C u rr e n t (A /g ) Potetial E (V vs RHE) 0.5 0.0 -0.5 -1.0 0.0 0.4 0.8 1.2
C.
D.
E.
0.0 0.4 0.8 1.2 1.6 2.0 2.5 3.0 3.5 4.0 4.5 Slope = 0.75 lo g( C ur re nt ( m A /g )) log(v (mV/s)) Equation y = a + b*x Weight No Weighting Residual Sum of Squares 0.00102 Pearson's r 0.99925 Adj. R-Square 0.99813Value Standard Error 1st peak positiveIntercept 2.10934 0.01147
Slope 0.58409 0.01132 Equation y = a + b*x Weight No Weighting Residual Sum of Squares 3.93692E-4 Pearson's r 0.99985 Adj. R-Square 0.99962
Value Standard Error 1st peak backward Intercept 1.53626 0.00712 Slope 0.80499 0.00703 Equation y = a + b*x Plot D Weight No Weighting Intercept -0.55648 ± 0.01599 Slope 0.74888 ± 0.01578 Residual Sum of Squares 0.00198 Pearson's r 0.99911 R-Square (COD) 0.99823 Adj. R-Square 0.99778 Slope = 0.58 Equation y = a + b*x Plot D Weight No Weighting Intercept 2.44292 ± 0.01549 Slope 0.74906 ± 0.01528 Residual Sum of Squares 0.00186 Pearson's r 0.99917 R-Square(COD) 0.99834 Adj. R-Square 0.99792
a semi-infinite diffusion case and a value of 1.0 suggests that the reaction is surface controlled.
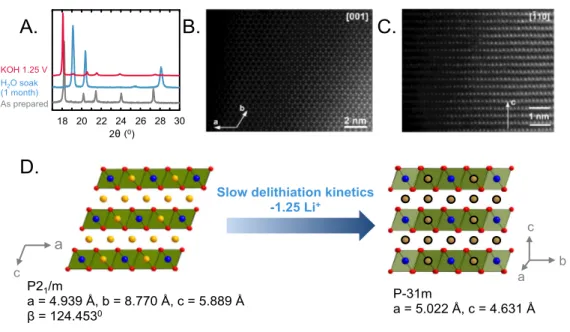
The new structure formed upon exposure of Li2RuO3 in water was found to be a layered
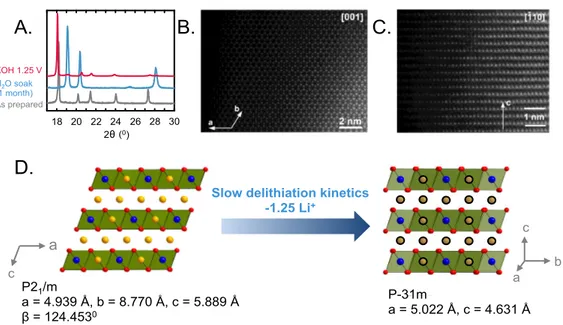
structure with the closed packed oxygen planes sheared to form an O1 structure. The XRD pattern (Figure 6A) and brightest reflections in the electron diffraction patterns (Figure S14) can be indexed with a primitive hexagonal unit cell with a ~5.0 Å and c ~4.6 Å, corresponding to the O1-type hexagonal close packed structure with the P-31m space group. Besides the main reflections, the weaker satellites that are visible in both powder XRD (Figure S15) and electron diffraction patterns (Figure S14) correspond to the modulation vector q = 1/3(a* + b*) + 0.2434(4)c*, as refined using the LeBail fit of powder XRD pattern (Figure S15A). However, due to weakness and small number of observable satellites, the Rietveld refinement of this new structure was performed from the main reflections only (Figure S15B), where the results are summarized in Tables S1-S3. The O1 stacking sequence of the RuO6 octahedral layers was confirmed by high
angle annular dark field scanning transmission electron microscopy (HAADF-STEM) images along the [001] in Figure 6B and [-110] in Figure 6C. While the O1 structure viewed along [001] provides separate projections of the Ru, Li and O columns, only hexagons of the Ru columns are visible in the [001] HAADF-STEM image (Figure 6B). Partially occupied Li positions form columns at the centers of the Ru hexagons, but Li
shifted by 1/3{110}. Similar shearing of close-packed oxygen planes to adopt the CrOOH structure[49] was observed by treating Li2MnO3[27] and Li3IrO4[21] in acid. The new
structure might have a composition of Li0.75H1.25RuO3. Water might have exchanged with
Li2O upon soaking Li2RuO3 in water for ~1 month, Li2RuO3 + 0.625 H2O à
Li0.75H1.25RuO3 + 0.625 Li2O, where the Li2O can further react with water to form LiOH.
Further support for the exchange of Li2O in the structure for H2O comes from Diffuse
Reflectance Infrared Fourier Transform Spectroscopy measurements as shown in Figure S16, where vibrations between 3000 cm-1 and 3400 cm-1 were found for the delithiated sample O1-“Li0.75H1.25RuO3” suggesting the presence of –OH groups within the
structure[50]. Additionally, the absence of any noticeable differences between the open circuit potential for the as prepared and de lithiated sample also suggests no significant change in the Ru oxidations state (Figure S17B). We note that while most studies have reported ion-exchange between Li+ and H+ in acidic solutions[13],[21]-[24] with a high proton concentration, our work demonstrates that Li2O units within the Li2RuO3 structure can be
replaced by H2O upon interaction with water in neutral solutions. Reactivity of
delithiated and Li-rich layered oxides with water is also demonstrated in recent work by Grimaud et al. which shows that the chemical reaction of water with delithiated β-Li2IrO3
(β-IrO3) results in the formation of a protonated iridate structure, β-H2IrO3 with the
evolution of oxygen[51] as well as the work from Yang et al. which shows that reaction of Li2MnO3 in acidic, neutral and basic solutions leads to delithiation and proton
incorporation into the structure[52]. However, it is virtually impossible to localize the hydrogen atoms in the O1-“ Li0.75H1.25RuO3” using conventional laboratory XRD data.
Figure 6: (A) XRD pattern of a pure delithiated phase synthesized by two different
methods – the O3-“Li1.4RuO3” phase in red synthesized by electrochemical delithiation at
1.25 VRHE in 0.1 M KOH and the O1-“Li0.75H1.25RuO3” phase in blue synthesized by
soaking pristine Li2RuO3 in water for 1 month. (B) [001] HAADF-STEM image of
perfect “honeycomb” ordering. (C) [-110] HAADF-STEM image showing a sequence of the hexagonal close-packed layers typical of the O1 structure. (D) Schematic indicating that slow delithiation kinetics upon exposure of as-prepared Li2RuO3 to water results in
the transformation of the O3 structure to an O1 hexagonal close packed structure. Blue, red and yellow spheres represent Ru, O and Li respectively. Exchangeable cations are shown in grey on the right, where these sites can be filled with Li or H.
Remarkably this O1-“Li0.75H1.25RuO3” phase was found to have 10 times greater redox
current densities (normalized by oxide weight) than pristine Li2RuO3 and
O3-“Li0.75H1.25RuO3” obtained electrochemically, Figure 5A. This observation supports our
hypothesis that growing redox currents found in Figure 1 can be attributed to the formation of this new phase found in Figure 2B. The oxide surface area for
O1-18 20 22 24 26 28 30 18 20 22 24 26 28 30 Soaked in H2O for one month 1.25 V KOH Pristine 2θ / ° KOH 1.25 V H2O soak (1 month) As prepared 18 20 22 24 26 28 30 2θ (0)
Slow delithiation kinetics -1.25 Li+ P21/m a = 4.939 Å, b = 8.770 Å, c = 5.889 Å β = 124.4530 P-31m a = 5.022 Å, c = 4.631 Å a c b c a A. B. C. D. v v v v v v v v v v v v v v v
translates to three times greater specific redox current densities for O1-“Li0.75H1.25RuO3”
(Figure S17) than Li2RuO3, which can be attributed to increasing accessibility of Ru sites
in O1-“Li0.75H1.25RuO3”. These redox currents did not come from lithium intercalation
and de-intercalation from the layered structure of O1-“Li0.75H1.25RuO3”. This argument is
supported by the observation that the redox current at 0.7 VRHE of O1-“Li0.75H1.25RuO3”
was found to reduce markedly with subsequent scans from 1 to 7 when 0.1 M KOH was replaced with 0.1 M LiOH and the redox process of 1.1 VRHE disappeared completely
(Figure 5D). On the other hand replacing 0.1 M KOH by 0.1 M solution of NaOH, RbOH and CsOH made negligible changes. Therefore, it is proposed that the increased redox currents can be attributed to the electrochemical redox reaction: O1-"Li0.75H1.25RuO3" + xOH- → O1- "Li0.75H1.25-xRuO3" + xH2O + xe- similar to those
found for nickel hydroxides[53]. Based on the integrated charge of both the redox peaks
at a scan rate of 1 mV/s, x = 0.7 per formula unit of O1-“Li0.75H1.25RuO3” between 0 and
1.2 VRHE, with x ~ 0.4 for the first redox transition. Removing half the protons per
formula unit (~0.6 H+) from O1-“Li0.75H1.25RuO3” would translate to 110 mAh/goxide,
which is in agreement with a capacity of ~120 mAh/goxide obtained from charging by
galvanostatic testing at 18 mA/goxide (Figure S20).
The two different redox processes at 0.7 VRHE and 1.1 VRHE for O1-“Li0.75H1.25RuO3”
exhibit different kinetics – the lower potential redox peak corresponds to a diffusion-limited process involving charge transfer within the bulk and the high potential redox peak corresponds to surface redox pseudocapacitance. The currents as a function of scan rate in the cyclic voltammogram of O1-“Li0.75H1.25RuO3” were examined. These
measurements showed that redox processes centered at ~0.7 VRHE and ~1.1 VRHE Figure 5E, S18) were bulk- and surface-controlled, respectively. For surface-controlled
electrochemical processes the current varies linearly with scan rate ν, whereas for diffusion-controlled processes of ion intercalation, the peak current scales with ν0.5
[54]-[56]. The log-log plot of peak current at 0.7 V
RHE versus scan rate revealed a slope of
0.58, suggesting that bulk redox might govern the redox process, while that at 1.1 VRHE
exhibited a slope of 0.86 (Figure S19), indicative of largely surface redox pseudocapacitance. In contrast, such measurements of O3-“Li1.4RuO3” revealed a slope
of 0.75 for peak current at 0.7 VRHE (Figure 5E), indicative of mixed bulk and surface
control[57],[58].
We further characterized the high-rate capacity exhibited by O1-“Li0.75H1.25RuO3”. This
material exhibited high capacity of ~120 mAh/goxide at 2 mV/s, which reduced to ~40
mAh/ goxide (Figure 7A) at larger scan rates of 200 mV/s. The high capacity at low scan
rates can be attributed to the reversible, bulk Ru redox within the delithiated structure. At high rates, the charge-discharge profiles exhibit a small intercalation plateau, with a dominant pseudocapacitance behavior. O1-“Li0.75H1.25RuO3” showed moderate rate
capability, where gravimetric capacities from ~75 to ~50 mAh/goxide (~270 – 180 C/goxide)
were found at current densities from 10 A/goxide (2.55 mA/cm2geometric) to 30 A/goxide
degradation of O1-“Li0.75H1.25RuO3”. Further studies are required to understand and
improve the cycling performance. In comparison to other crystalline metal oxides shown in Figure 7D, O1-“Li0.75H1.25RuO3” exhibits 2-3 orders of magnitude higher charge per
mass of oxide. Particularly in comparison to as-prepared Li2RuO3, it has an order
magnitude increase in charge, due to the greater bulk Ru redox owing to structural transformation upon delithiation. Similarly high charge has been observed for chemically delithiated Li3IrO4 samples in acidic solutions (0.1 M H2SO4) that form a protonic
phase[21]. Noticeably the charge storage is comparable to amorphous, hydrous RuO2
nanoparticles which have BET surface area ~30-80 m2/g[61], significantly higher than that of O1-“Li0.75H1.25RuO3” (2.42 m2/g). This suggests that developing nanostructures of this
material, using similar strategies adopted for metal oxides such as RuO2 and MnO2 could
increase the surface area per mass and consequently the charge per unit mass by the surface redox capacitance[57],[62],[63].
At slower charging rates of 18 mA/goxide higher capacity is observed, ~120 mAh/goxide
due to the larger contribution of the intercalation Ru redox reaction, which is diffusion limited at fast charging rates. The large capacity in basic solutions, resulting from bulk metal redox provides promising alternatives to aqueous lithium intercalation batteries which are complicated by side reactions such as dissolution of electrode materials in water and/or presence of oxygen and proton cointercalation[29]. However, both the parent Li2RuO3 and water exchanged Li0.75H1.25RuO3 would be unsuitable candidates for
aqueous batteries based on Li+ intercalation/deintercalation due to possible parasitic reactions with water in solution, resulting in exchange of some Li2O units with H2O from
the solution. This is in agreement with results on LiCoO2 and LiCo1/3Ni1/3Mn1/3O2
electrodes in aqueous solutions which show significant degradation at pH< 9 and 11 respectively[29]. The ability of Li-rich layered oxides to interact with water and exchange a significant fraction of Li2O with H2O under mild neutral conditions as opposed to
previous studies which demonstrate ion exchange in acidic solutions, provides new opportunities to synthesize layered oxides that exhibit fast charging/discharging and high energy density.
Figure 7: (A) Capacity normalized to oxide loading as a function of scan rate. (B)
Galvanostatic charge-discharge profiles for current densities of 10 A/g (2.550 mA/cm2
geometric), 15 A/g (3.825 mA/cm2geometric), 20 A/g (5.10 mA/cm2geometric), 25 A/g
(6.375 mA/cm2geometric), 30 A/g (7.650 mA/cm2geometric) 35 A/g (8.925 mA/cm2geometric) and
40 A/g (10.2 mA/cm2geometric), (C) Charge-discharge curves for cycle 1, 500, 1000 and
2000 for a constant current of 20 A/g. All measurements were performed in Ar-saturated 0.1 1 10 100 1000 C ha rg e (C /g ) D Li0.75 H1.25 RuO 3 (1 0 mV/ s) Li0.75 H1.25 RuO 3 (1 mV/ s) A. 0 10 20 30 40 50 60 0.00 0.25 0.50 0.75 1.00 1.25 5 A/g10 A/g 15 A/g 20 A/g 25 A/g 30 A/g 35 A/g P o te n tia l ( V v s R H E ) Time (seconds) H O T X 0.75 AB AF 1.25 1.00 0.75 0.50 0.25 0.00 0 10 20 30 40 50 60 Time (seconds) V (vs. R H E, iR co rr .) 40 A/g 35 A/g 30 A/g 25 A/g 20 A/g 15 A/g 10 A/g B. 1.25 1.00 0.75 0.50 0.25 0.00 V (vs. R H E, iR co rr .) 10 20 30 40 50 Capacity (mAh/goxide)
C. La Mn O3 Li2 Mn O3 Li2 Ru 0.5 Mn 0.5 O3 Li2 Ru 0.5 Sn 0.5 O3 Li2 Ru 0.5 Ir0.5 O3 Li2 RuO 3 H3+x IrO 3 RuO 2 .0.03 H 2 O RuO 2 .0.5 H 2 O Li2 IrO 3 RuO 2 RuO 2 0.1 1 10 100 1000 C ha rg e (C /goxi de ) D. 140 120 100 80 60 40 0 40 80 120 160 200 40 60 80 100 120 140 F % (2) % (4) % (5) % (6) C a p a ci ty s to re d ( m A h /g ) Scan Rate (mV/s) 0 40 80 120 160 200 Scan Rate (mV/s) C ap aci ty (mAh /goxi de )
H2SO4. Data for crystalline RuO2 obtained from Alfa Aesar and hydrated RuO2.0.03H2O
and RuO2.0.5H2O at 2 mV/s scan rate between 0.44RHE and 0.99 VRHE in 0.5 M H2SO4
are also shown for comparison[61],[64].
3. Conclusions
Ru-based oxides exhibit fascinating electrochemical activities that are of relevance to Li-ion battery cathode materials, oxygen evolutLi-ion reactLi-ion catalysts and electrochemical supercapacitors. The interaction of water is important to understand and improve the activity and stability of Ru-based oxides for these applications. In this work, we have demonstrated that Li2RuO3, a Li-rich layered oxide, can react with water to exchange
Li2O within the structure with H2O, under neutral conditions to form a new phase that is
structurally distinct from the parent material. The oxygen close packed planes are sheared to form a modulated O1 structure with a maximum delithiation of 1.25 Li ions per formula unit. The formation of this new phase depends significantly on the delithiation kinetics, where faster kinetics by delithiating at high potentials in aqueous electrochemical conditions or under acidic conditions does not result in a drastic structural transition. The partially water-exchanged phase allows for reversible bulk Ru-redox reactions and thus provides large capacity by bulk Ru Ru-redox as well as pseudocapacitive redox by surface Ru atoms in basic solutions. This new phase exhibits a high ionic and electronic conductivity in the bulk, which is a highly desired property to achieve high mass activities for aqueous electrochemical devices.
Sample Preparation: Li2RuO3 particles were synthesized by mixing RuO2 and Li2CO3
in a molar ratio of 1:2.1 to compensate for Li evaporation at high temperature. The powders were dried at 300oC for 4 hours at a heating rate of 5oC/minute. The dried powders were ground together in a mortar until a homogeneous mixture was obtained and then the powders were pressed into a pellet. The pellet was annealed at 900oC for 24 hours with a heating rate of 2oC. Following the first annealing, the pellet was ground in a mortar again. The reground powder was formed into a pellet, which was annealed at 1000oC for 48 hours with a heating rate of 2oC/minute.
Materials Characterization: X-ray powder diffraction analysis was carried out on a
PANAlytical X’Pert Pro powder diffractometer with Bragg-Brentano geometry with the Cu-Kα radiation (λ1=1.54056 Å, λ2=1.54433 Å). Acquisition was performed using an
X’Celerator detector in the 2θ range from 15o - 90o. Refinements of the XRD patterns with the LeBail and Rietveld methods were obtained using the FullProf[65] and JANA2006[66] programs.
The surface area of the oxide particles was determined by BET analysis on a Quantachrome ChemBET Pulsar from a single-point BET analysis performed after 12 hours outgassing at 100oC. TEM samples were prepared by crushing the powder in a mortar in anhydrous ethanol and depositing drops of suspension onto holey carbon grids. Electron diffraction (ED) patterns and high angle annular dark field scanning
used as the reference electrode. All potentials were calibrated to the reversible hydrogen electrode (RHE) scale. The working electrode was prepared by drop-casting oxide ink on a glassy carbon electrode, as described previously[67], with an oxide loading of 0.25 mgoxide/cm2disk and a mass ratio of 5:1:1 of oxide catalyst to acetylene black carbon to
Nafion®. Where applicable, pellet electrodes were used. 50 mg pellets of pure active material were prepared and attached to a Ti foil using conductive carbon paste. The remaining Ti foil was covered with OmegaBond epoxy to make it electrochemically inactive. The electrolyte was prepared by dissolving appropriate amount of salt in deionized water (18 MΩ). The potential was controlled using a Biologic VSP-300 potentiostat. Cyclic voltammograms and potentiostatic measurements were performed in Ar (99.999% Airgas) saturated and bubbled electrolyte. Ohmic losses were corrected for by subtracting the ohmic voltage drop from the measured potential, using an electrolyte resistance determined by high-frequency alternating current impedance.
In situ X-ray absorption measurements: In situ XAS measurements were performed using a home-made 3 electrode setup in situ cell. The working electrode was a glassy carbon electrode where a mixture of catalyst powder and carbon with a volume ratio of 1:19 was deposited, to form a thin layer, ~10 µm in thickness. An Ag/AgCl (Pine Instrument Co.) reference electrode was used. Ru L-edge measurements were carried out at the Stanford Synchrotron Radiation LightSource (SSRL) on beamline 14-3 with the energy range of 2-5 keV. Acquisition was performed at the Ru L3-edge (2.8379 keV) in
fluorescence mode with an acquisition angle of approximately 45o. Time of acquisition of one spectrum is ~50 minutes. Ru K-edge measurements were performed at beamline
20-BM-B at the Argonne Advanced Photon Source (APS) in fluorescence yield mode using a 4-element Vortex SDD detector in a helium atmosphere. A homemade electrochemical cell[44] having a 100 µm thick glassy carbon working electrode, graphite counter electrode and a Harvard Instr. Ag/AgCl reference electrode was used. All spectra were normalized by subtracting a constant before the shown edge and by division of a constant after the edge.
Density Functional Theory Calculations: We used the Perdew-Burke-Enzerhof
(PBE)[68] formulation of the density functional and projected augmented wave (PAW) potentials implemented in Vienna Ab-initio Simulation Package (VASP)[69]-[70] with Dudarev’s rotationally invariant Hubbard-type U[71] applied on the transition metal where we applied a Ueff = 4 eV on Ru 4d orbital as reported from previous work[72]. A k-point
per reciprocal atom of 8000 was used.
Supporting Information
Supporting Information is available from the Wiley Online Library
Acknowledgements
This work was supported in part by the Skoltech-MIT Center for Electrochemical Energy. This research made use of the Shared Experimental Facilities supported by the
Chengjun Sun and Tianpin Wu for their assistance in the measurements. MR is thankful for financial support from the DFG via CRC 1073, project C05 (Project # 217133147). Use of the Stanford Synchrotron Radiation Lightsource, SLAC National Accelerator Laboratory, is supported by the U.S. Department of Energy, Office of Science, Office of Basic Energy Sciences under Contract No. DE-AC02-76SF00515. The authors thank Anders Filsøe Pedersen, Ifan E.L. Stephens and Ib Chorkendorff for their assistance in carrying out the measurements at SLAC. The authors also thank Yu Katayama, Karthik Akkiraju and Yirui Zhang for their help with the DRIFTS measurements.
Conflict of Interest
References [1] J.-M. Tarascon, M. Armand, In Materials for Sustainable Energy; Co-Published with Macmillan Publishers Ltd, UK, 2010; pp. 171–179. [2] J. B. Goodenough, K.-S. Park, J. Am. Chem. Soc. 2013, 135, 1167. [3] M. Armand, J.-M. Tarascon, Nature 2008, 451, 652. [4] D. Kundu, E. Talaie, V. Duffort, L. F. Nazar, Angew. Chem. Int. Ed. 2015, 54, 3431. [5] B. L. Ellis, L. F. Nazar, Curr. Opin. Solid State Mater. Sci. 2012, 16, 168. [6] V. Augustyn, P. Simon, B. Dunn, Energy Environ. Sci. 2014, 7, 1597. [7] H.-S. Kim, J. B. Cook, H. Lin, J. S. Ko, S. H. Tolbert, V. Ozolins, B. Dunn, Nat. Mater. 2017, 16, 454. [8] B. Xu, D. Qian, Z. Wang, Y. S. Meng, Mater. Sci. Eng. R Rep. 2012, 73, 51. [9] M. L. Freedman, J. Am. Chem. Soc. 1959, 81, 3834. [10] V. Augustyn, B. Dunn, Comptes Rendus Chim. 2010, 13, 130. [11] G. Sai Gautam, P. Canepa, W. D. Richards, R. Malik, G. Ceder, Nano Lett. 2016, 16, 2426. [12] D. Chen, M. Liu, L. Yin, T. Li, Z. Yang, X. Li, B. Fan, H. Wang, R. Zhang, Z. Li, H. Xu, H. Lu, D. Yang, J. Sun, L. Gao, J. Mater. Chem. 2011, 21, 9332. [13] C. Yang, G. Rousse, K. Louise Svane, P. E. Pearce, A. M. Abakumov, M. Deschamps, G. Cibin, A. V. Chadwick, D. A. Dalla Corte, H. Anton Hansen, T. Vegge, J.-M. Tarascon, A. Grimaud, Nat. Commun. 2020, 11, 1. [14] D. Larcher, M. R. Palacín, G. G. Amatucci, J.-M. Tarascon, J. Electrochem. Soc. 1997, 144, 408. [15] Y. Chen, G. Yang, Z. Zhang, X. Yang, W. Hou, J.-J. Zhu, Nanoscale 2010, 2, 2131. [16] M. Sathiya, G. Rousse, K. Ramesha, C. P. Laisa, H. Vezin, M. T. Sougrati, M.-L. Doublet, D. Foix, D. Gonbeau, W. Walker, A. S. Prakash, M. Ben Hassine, L. Dupont, J.-M. Tarascon, Nat. Mater. 2013, 12, 827. [17] E. McCalla, A. M. Abakumov, M. Saubanère, D. Foix, E. J. Berg, G. Rousse, M.-L. Doublet, D. Gonbeau, P. Novák, G. V. Tendeloo, R. Dominko, J.-M. Tarascon, Science 2015, 350, 1516. [18] M. Sathiya, A. M. Abakumov, D. Foix, G. Rousse, K. Ramesha, M. Saubanère, M. L. Doublet, H. Vezin, C. P. Laisa, A. S. Prakash, D. Gonbeau, G. VanTendeloo, J.-M. Tarascon, Nat. Mater. 2015, 14, 230. [19] N. Yabuuchi, K. Yoshii, S.-T. Myung, I. Nakai, S. Komaba, J. Am. Chem. Soc. 2011, 133, 4404. [20] A. R. Armstrong, M. Holzapfel, P. Novák, C. S. Johnson, S.-H. Kang, M. M. Thackeray, P. G. Bruce, J. Am. Chem. Soc. 2006, 128, 8694.
[28] B. Ammundsen, D. J. Jones, J. Rozière, G. R. Burns, Chem. Mater. 1996, 8, 2799. [29] Y. Wang, J. Yi, Y. Xia, Adv. Energy Mater. 2012, 2, 830. [30] W. Sugimoto, H. Iwata, Y. Yasunaga, Y. Murakami, Y. Takasu, Angew. Chem. Int. Ed. 2003, 42, 4092. [31] W. Dmowski, T. Egami, K. E. Swider-Lyons, C. T. Love, D. R. Rolison, J. Phys. Chem. B 2002, 106, 12677. [32] A. C. W. P. James, J. B. Goodenough, J. Solid State Chem. 1988, 74, 287. [33] Y. Miura, Y. Yasui, M. Sato, N. Igawa, K. Kakurai, J. Phys. Soc. Jpn. 2007, 76, 033705. [34] J. Park, T.-Y. Tan, D. T. Adroja, A. Daoud-Aladine, S. Choi, D.-Y. Cho, S.-H. Lee, J. Kim, H. Sim, T. Morioka, H. Nojiri, V. V. Krishnamurthy, P. Manuel, M. R. Lees, S. V. Streltsov, D. I. Khomskii, J.-G. Park, Sci. Rep. 2016, 6, 1. [35] B. Li, R. Shao, H. Yan, L. An, B. Zhang, H. Wei, J. Ma, D. Xia, X. Han, Adv. Funct. Mater. 2016, 26, 1330. [36] Y. Yu, P. Karayaylali, S. H. Nowak, L. Giordano, M. Gauthier, W. Hong, R. Kou, Q. Li, J. Vinson, T. Kroll, D. Sokaras, C.-J. Sun, N. Charles, F. Maglia, R. Jung, Y. Shao-Horn, Chem. Mater. 2019, 31, 7864. [37] R. R. Rao, M. J. Kolb, J. Hwang, A. F. Pedersen, A. Mehta, H. You, K. A. Stoerzinger, Z. Feng, H. Zhou, H. Bluhm, L. Giordano, I. E. L. Stephens, Y. Shao-Horn, J. Phys. Chem. C 2018, 122, 17802. [38] R. R. Rao, M. J. Kolb, N. B. Halck, A. F. Pedersen, A. Mehta, H. You, K. A. Stoerzinger, Z. Feng, H. A. Hansen, H. Zhou, L. Giordano, J. Rossmeisl, T. Vegge, I. Chorkendorff, I. E. L. Stephens, Y. Shao-Horn, Energy Environ. Sci. 2017, 10, 2626. [39] Y. Lee, J. Suntivich, K. J. May, E. E. Perry, Y. Shao-Horn, J. Phys. Chem. Lett. 2012, 3, 399. [40] K. A. Stoerzinger, O. Diaz-Morales, M. Kolb, R. R. Rao, R. Frydendal, L. Qiao, X. R. Wang, N. B. Halck, J. Rossmeisl, H. A. Hansen, T. Vegge, I. E. L. Stephens, M. T. M. Koper, Y. Shao-Horn, ACS Energy Lett. 2017, 2, 876. [41] C. Wei, R. R. Rao, J. Peng, B. Huang, I. E. L. Stephens, M. Risch, Z. J. Xu, Y. Shao-Horn, Adv. Mater. 2019, 31, 1806296. [42] R. Frydendal, E. A. Paoli, B. P. Knudsen, B. Wickman, P. Malacrida, I. E. L. Stephens, I. Chorkendorff, ChemElectroChem 2014, 1, 2075. [43] H. Kobayashi, R. Kanno, Y. Kawamoto, M. Tabuchi, O. Nakamura, M. Takano, Solid State Ion. 1995, 82, 25. [44] D.-H. Ha, B. Han, M. Risch, L. Giordano, K. P. C. Yao, P. Karayaylali, Y. Shao-Horn, Nano Energy 2016, 29, 37. [45] A. F. Pedersen, M. Escudero-Escribano, B. Sebok, A. Bodin, E. Paoli, R. Frydendal, D. Friebel, I. E. L. Stephens, J. Rossmeisl, I. Chorkendorff, A. Nilsson, J. Phys. Chem. B 2018, 122, 878. [46] A. Mamchik, W. Dmowski, T. Egami, I.-W. Chen, Phys. Rev. B 2004, 70. [47] K. Sardar, E. Petrucco, C. I. Hiley, J. D. B. Sharman, P. P. Wells, A. E. Russell, R. J. Kashtiban, J. Sloan, R. I. Walton, Angew. Chem. Int. Ed. 2014, 53, 10960. [48] W. Li, J. R. Dahn, D. S. Wainwright, Science 1994, 264, 1115. [49] A. N. Christensen, P. Hansen, M. S. Lehmann, J. Solid State Chem. 1977, 21, 325.
[51] P. E. Pearce, C. Yang, A. Iadecola, J. Rodriguez-Carvajal, G. Rousse, R. Dedryvère, A. M. Abakumov, D. Giaume, M. Deschamps, J.-M. Tarascon, A. Grimaud, Chem. Mater. 2019, 31, 5845. [52] J. Wu, X. Zhang, S. Zheng, H. Liu, J. Wu, R. Fu, Y. Li, Y. Xiang, R. Liu, W. Zuo, Z. Cui, Q. Wu, S. Wu, Z. Chen, P. Liu, W. Yang, Y. Yang, ACS Appl. Mater. Interfaces 2020, 12, 7277. [53] C. Delmas, In Chemical Physics of Intercalation; Legrand, A. P.; Flandrois, S., Eds.; NATO ASI Series; Springer US: Boston, MA, 1987; pp. 209–232. [54] V. Augustyn, J. Come, M. A. Lowe, J. W. Kim, P.-L. Taberna, S. H. Tolbert, H. D. Abruña, P. Simon, B. Dunn, Nat. Mater. 2013, 12, 518. [55] P. Simon, Y. Gogotsi, B. Dunn, Science 2014, 343, 1210. [56] C. Choi, D. S. Ashby, D. M. Butts, R. H. DeBlock, Q. Wei, J. Lau, B. Dunn, Nat. Rev. Mater. 2020, 5, 5. [57] T. Brezesinski, J. Wang, S. H. Tolbert, B. Dunn, Nat. Mater. 2010, 9, 146. [58] H. Lindström, S. Södergren, A. Solbrand, H. Rensmo, J. Hjelm, A. Hagfeldt, S.-E. Lindquist, J. Phys. Chem. B 1997, 101, 7717. [59] M. S. Whittingham, Solid State Ion. 2004, 168, 255. [60] J. B. Rivest, P. K. Jain, Chem. Soc. Rev. 2013, 42, 89. [61] J. W. Long, K. E. Swider, C. I. Merzbacher, D. R. Rolison, Langmuir 1999, 15, 780. [62] P. Simon, Y. Gogotsi, Nat. Mater. 2008, 7, 845. [63] K. Naoi, P. Simon, Electrochem. Soc. Interface 2008, 4. [64] J. P. Zheng, J. Electrochem. Soc. 1995, 142, 2699. [65] T. Roisnel, J. Rodríguez-carvajal, In In Materials Science Forum. Proceedings of the European Powder Diffraction Conf. (EPDIC 7); 2001; Vol. 378, pp. 118–123. [66] V. Petříček, M. Dušek, L. Palatinus, Z. Für Krist. - Cryst. Mater. 2014, 229, 345. [67] B. Han, M. Risch, Y.-L. Lee, C. Ling, H. Jia, Y. Shao-Horn, Phys. Chem. Chem. Phys. 2015, 17, 22576. [68] J. P. Perdew, K. Burke, M. Ernzerhof, Phys Rev Lett 1996, 77, 3865. [69] G. Kresse, J. Furthmüller, Comput. Mater. Sci. 1996, 6, 15. [70] G. Kresse, J. Hafner, Phys. Rev. B 1993, 47, 558. [71] S. L. Dudarev, G. A. Botton, S. Y. Savrasov, C. J. Humphreys, A. P. Sutton, Phys. Rev. B 1998, 57, 1505. [72] M. Saubanère, E. McCalla, J.-M. Tarascon, M.-L. Doublet, Energy Environ. Sci. 2016, 9, 984.
Figure 1: Cyclic voltammogram (CV) of as-prepared Li2RuO3 drop-cast on glassy
carbon disk electrode in Ar-saturated 0.1 M KOH at 10 mV/s using a three-electrode cell.
CV measurements were performed every 2 hours between 0.05 and 1.25 VRHE for 6
cycles and the electrode was left at open circuit (~0.9 VRHE) between adjacent
measurements. The light blue curve corresponds to the first scan and the dark blue curve corresponds to the sixth scan. The nominal oxide loading is 0.255 mgoxide/cmdisk2 and the
carbon loading is 0.05 mgcarbon/cmdisk2.
0.0 0.2 0.4 0.6 0.8 1.0 1.2 1.4 -0.15 -0.10 -0.05 0.00 0.05 0.10 0.15 0.20 0.25 G ra vi m e tr ic c u rr e n t d e n si ty ( A /gox id e ) C u rr e n t d e n si ty ( m A /c m 2 oxid e ) V (vs RHE, iR corrected) F F F F % (6) F
Increasing number of scans
-1.2 -0.6 0.0 0.6 1.2 1.8
Figure 2: (A) The concentration of Li ions in the solution after exposure of Li2RuO3
pellet (50 mg) to water, 0.1 M KOH and after holding at three potentials (0.40, 0.65 and 0.90) in 0.1 M KOH for 24 h, measured by inductively coupled plasma mass spectrometry, and corresponding lithium stoichiometry present in LixRuO3. (B) Parts of
the X-ray powder diffraction data of pellets after exposure described in (A) (CuKα radiation, full patterns are shown in Figure S5)
H2 O so ake d KO H so ake d 0.40 V R H E 0.65 V R H E 0.90 V R H E
A.
B.
*
*
Figure 3: (A) Potentiostatic measurements of pristine 50 mg Li2RuO3 pellets at noted
potentials in 0.1 M KOH. Potentiostatic measurements were made for 24 hours at 0.4 VRHE, 0.65 VRHE, 0.90 VRHE and 1.10 VRHE and for 48 hours at 1.25 VRHE to ensure that
the oxidative current is stabilized at ~0 µA (B) X-ray powder diffraction data of pellets after exposure described in (A) (CuKα radiation, full patterns are shown in Figure S5).
In te nsi ty (a rb . u ni ts)
A.
B.
*
0 750 1500 2250 3000 -600 -400 -200 0 200 1.25 V RHE 1.10 VRHE 0.90 VRHE 0.65 VRHE 0.40 VRHE C ur re nt (µ A ) Time (minutes)*
As prepared H2O soaked KOH soaked KOH 1.10 VRHE KOH 1.25 VRHEFigure 4: In situ X-ray absorption spectroscopy data in 0.1 M KOH of (A) Ru K-edge
(22.117 keV) in fluorescence mode with an acquisition angle of approximately 45o. Time of acquisition of one spectrum is ~30 min (B) Ru L3-edge (2.8379 keV) in fluorescence
mode with an acquisition angle of approximately 45o. Time of acquisition of one spectrum is ~ 50 min. Measurements were first collected at open circuit potential and then the potential was increased from 0.4 VRHE to 1.25 VRHE and decreased back to 0.4
VRHE. The working electrode is a glassy carbon where a mix of Li2RuO3 and carbon with
volume ratio of 1:19 was deposited, to form a thin layer of ~10 µm thick. The reference electrode is Ag/AgCl. (C) The shift in the edge position (for the K-edge) and the peak position (for the L-edge) suggests oxidation of bulk Ru with increasing potential. The Ru oxidation state corresponding to the Ru K-edge shift has been extracted from previous work.[47]
Figure 5: (A) Cyclic voltammograms at 10 mV/s of as-prepared Li2RuO3 (in grey),
“Li1.4RuO3” (in red) and “Li0.75H1.25RuO3”(in blue) synthesized by holding at 1.25 VRHE
in Ar-saturated 0.1 M KOH for 48 hours and soaking in water for ~30 days respectively. Oxide particles were deposited on a glassy carbon disk and the nominal oxide loading was 0.255 mgoxide/cmdisk2. Helium ion microscopy images of the particles for the (B) as
prepared and (C) “O1-“Li0.75H1.25RuO3”” in water shows that exposure to water results in
breakdown of particles causing a three-fold increase in surface area. (D) Cyclic voltammograms for the “O1-“Li0.75H1.25RuO3”” sample in Ar-saturated 0.1 M LiOH,
NaOH, KOH, RbOH and CsOH at 10 mV/s. The presence of Li ions in solution results in a decrease in the redox peak currents with cycling (increasing scans are indicated by darker shades of blue). However, there is no change in the bulk structure of the sample soaked in a Li containing solution for a period of ~1 month. This suggests that the influence of Li results in a chemical/structural modification of the surface/interface of the electrode, causing loss of the redox currents (E) Variation of the log of the peak current as a function of the log of the scan rate for the anodic redox peak at ~0.7 VRHE for
“Li1.4RuO3” (in red) and “Li0.75H1.25RuO3” (in blue). A value of 0.5 for the slope suggests
a semi-infinite diffusion case and a value of 1.0 suggests that the reaction is surface controlled. 0.0 0.2 0.4 0.6 0.8 1.0 1.2 -10.0 -7.5 -5.0 -2.5 0.0 2.5 5.0 7.5 C u rr e n t (A /g ) Potetial E (V vs RHE) Phase I Phase II Pristine 7.5 5.0 2.5 0.0 -2.5 -5.0 -7.5 -10.0 0.0 0.2 0.4 0.6 0.8 1.0 1.2 i (A/ g) V (vs. RHE, iR corrected) 0.0 0.2 0.4 0.6 0.8 1.0 1.2 -1.0 -0.5 0.0 0.5 C u rr e n t (A /g ) Potetial E (V vs RHE) 0.5 0.0 -0.5 -1.0 0.0 0.4 0.8 1.2
C.
D.
E.
0.0 0.4 0.8 1.2 1.6 2.0 2.5 3.0 3.5 4.0 4.5 Slope = 0.75 lo g( C ur re nt ( m A /g )) log(v (mV/s)) Equation y = a + b*x Weight No Weighting Residual Sum of Squares 0.00102 Pearson's r 0.99925 Adj. R-Square 0.99813Value Standard Error 1st peak positiveIntercept 2.10934 0.01147
Slope 0.58409 0.01132 Equation y = a + b*x Weight No Weighting Residual Sum of Squares 3.93692E-4 Pearson's r 0.99985 Adj. R-Square 0.99962
Value Standard Error 1st peak backward Intercept 1.53626 0.00712 Slope 0.80499 0.00703 Equation y = a + b*x Plot D Weight No Weighting Intercept -0.55648 ± 0.01599 Slope 0.74888 ± 0.01578 Residual Sum of Squares 0.00198 Pearson's r 0.99911 R-Square (COD) 0.99823 Adj. R-Square 0.99778 Slope = 0.58 Equation y = a + b*x Plot D Weight No Weighting Intercept 2.44292 ± 0.01549 Slope 0.74906 ± 0.01528 Residual Sum of Squares 0.00186 Pearson's r 0.99917 R-Square(COD) 0.99834 Adj. R-Square 0.99792
Figure 6: (A) XRD pattern of a pure delithiated phase synthesized by two different
methods – the O3-“Li1.4RuO3” phase in red synthesized by electrochemical delithiation at
1.25 VRHE in 0.1 M KOH and the O1-“Li0.75RuO3” phase in blue synthesized by soaking
pristine Li2RuO3 in water for 1 month. (B) [001] HAADF-STEM image of perfect
“honeycomb” ordering. (C) [-110] HAADF-STEM image showing a sequence of the hexagonal close-packed layers typical of the O1 structure. (D) Schematic indicating that slow delithiation kinetics upon exposure of as-prepared Li2RuO3 to water results in the
transformation of the O3 structure to an O1 hexagonal close packed structure. Blue, red and yellow spheres represent Ru, O and Li respectively. Exchangeable cations are shown in grey on the right, where these sites can be filled with Li or H.
18 20 22 24 26 28 30 18 20 22 24 26 28 30 Soaked in H2O for one month 1.25 V KOH Pristine 2θ / ° KOH 1.25 V H2O soak (1 month) As prepared 18 20 22 24 26 28 30 2θ (0)
Slow delithiation kinetics -1.25 Li+ P21/m a = 4.939 Å, b = 8.770 Å, c = 5.889 Å β = 124.4530 P-31m a = 5.022 Å, c = 4.631 Å a c b c a A. B. C. D. v v v v v v v v v v v v v v v
Figure 7: (A) Capacity normalized to oxide loading as a function of scan rate. (B)
Galvanostatic charge-discharge profiles for current densities of 10 A/g (2.550 mA/cm2geometric), 15 A/g (3.825 mA/cm2geometric), 20 A/g (5.10 mA/cm2geometric), 25 A/g
(6.375 mA/cm2geometric), 30 A/g (7.650 mA/cm2geometric) 35 A/g (8.925 mA/cm2geometric) and
40 A/g (10.2 mA/cm2
geometric), (C) Charge-discharge curves for cycle 1, 500, 1000 and
2000 for a constant current of 20 A/g. All measurements were performed in Ar-saturated 0.1 M KOH electrolyte in a three-electrode cell. Oxide particles were deposited on a glassy carbon disk and the nominal oxide loading was 0.255 mgoxide/cmdisk2. (D)
Comparison of the charge stored for different crystalline oxides, RuO2 (Sigma-Aldrich,
99.9% trace metal base), LaMnO3, Li2MnO3, Li2Ru0.5Mn0.5O3, Li2Ru0.5Sn0.5O3, Li2IrO3,
Li2Ru0.5Ir0.5O3, and as prepared Li2RuO3. The data was extracted from cyclic
voltammograms measured at 10 mV/s in Ar-saturated 0.1 M KOH between 0.65 VRHE
and 1.1 VRHE as shown in Figure S2 and between 0.04 VRHE and 1.3 VRHE forLi2RuO3.
Blue bars show the data for the new phase of chemically delithiated Li2RuO3
(Li0.75H1.25RuO3) measured at 10 mV/s and 1 mV/s in Ar-saturated 0.1 M KOH between
0.04 VRHE and 1.3 VRHE. Data for H3+xIrO3 in 0.1 M H2SO4 has been extracted from
reference[21], where this material was prepared by chemically treating Li3IrO4 in 0.1 M
H2SO4. Data for crystalline RuO2 obtained from Alfa Aesar and hydrated RuO2.0.03H2O
and RuO2.0.5H2O at 2 mV/s scan rate between 0.44RHE and 0.99 VRHE in 0.5 M H2SO4
are also shown for comparison[61],[64]. 0.1 1 10 100 1000 C ha rg e (C /g ) D Li0.75 H1.25 RuO 3 (1 0 mV/ s) Li0.75 H1.25 RuO 3 (1 mV/ s) A. 0 10 20 30 40 50 60 0.00 0.25 0.50 0.75 1.00 1.25 5 A/g10 A/g 15 A/g 20 A/g 25 A/g 30 A/g 35 A/g P o te n tia l ( V v s R H E ) Time (seconds) H O T X 0.75 AB AF 1.25 1.00 0.75 0.50 0.25 0.00 0 10 20 30 40 50 60 Time (seconds) V (vs. R H E, iR co rr .) 40 A/g 35 A/g 30 A/g 25 A/g 20 A/g 15 A/g 10 A/g B. 1.25 1.00 0.75 0.50 0.25 0.00 V (vs. R H E, iR co rr .) 10 20 30 40 50 Capacity (mAh/goxide)
C. La Mn O3 Li2 Mn O3 Li2 Ru 0.5 Mn 0.5 O3 Li2 Ru 0.5 Sn 0.5 O3 Li2 Ru 0.5 Ir0.5 O3 Li2 RuO 3 H3+x IrO 3 RuO 2 .0.03 H 2 O RuO 2 .0.5 H 2 O Li2 IrO 3 RuO 2 RuO 2 0.1 1 10 100 1000 C ha rg e (C /goxi de ) D. 140 120 100 80 60 40 0 40 80 120 160 200 40 60 80 100 120 140 F % (2) % (4) % (5) % (6) C a p a ci ty s to re d ( m A h /g ) Scan Rate (mV/s) 0 40 80 120 160 200 Scan Rate (mV/s) C ap aci ty (mAh /goxi de )
Table of Contents
ToC text
Upon interaction with water, micron-sized particles of Li2RuO3 transform from an O3
structure to an O1 structure by shearing of the oxygen closed pack planes, with the loss of 1.25 Li ions per formula unit by exchanging Li2O with H2O. This novel, resultant phase
allows bulk Ru redox resulting in an order of magnitude increase in the gravimetric capacity in basic solutions.
Exchanged Li0.75H1.25RuO3 As Prepared Li2RuO3 C ap aci ty O3 phase O1 phase 1 month soaking in H2O