Car pride and its bidirectional relations with car
ownership: Case studies in New York City and Houston
The MIT Faculty has made this article openly available. Please share how this access benefits you. Your story matters.
Citation Moody, Joanna and Jinhua Zhao. "Car pride and its bidirectional relations with car ownership: Case studies in New York City and Houston." Transportation Research Part A: Policy and Practice 124 (June 2019): 334-353 © 2019 Elsevier Ltd
As Published http://dx.doi.org/10.1016/j.tra.2019.04.005
Publisher Elsevier BV
Version Author's final manuscript
Citable link https://hdl.handle.net/1721.1/127267
Terms of Use Creative Commons Attribution-NonCommercial-NoDerivs License
Car pride and its bidirectional relations with car ownership:
Case studies in New York City and Houston
Joanna Moody [email protected]
Department of Civil & Environmental Engineering, Massachusetts Institute of Technology, 77 Massachusetts Ave., 1-165, Cambridge, MA 02139, United States
Jinhua Zhao
[email protected] * corresponding author
Edward H. and Joyce Linde Associate Professor of Transportation and City Planning, Department of Urban Studies and Planning, Massachusetts Institute of Technology, 77 Massachusetts Ave., 9-523, Cambridge, MA 02139, United States
Cite as:
Moody, Joanna and Jinhua Zhao. 2019. Car pride and its bidirectional relations with car
ownership: Case studies in New York City and Houston. Transportation Research Part A:
Planning and Policy, 124: 334-353. https://doi.org/10.1016/j.tra.2019.04.005. Received 15 July 2018; Received in revised form 26 March 2019; Accepted 7 April 2019 © 2019 Elsevier Ltd. All rights reserved.
Abstract
The car fulfills not only instrumental transportation functions, but also holds important symbolic and affective meaning for its owners and users. In particular, owning and using a car can be a symbol of an individual’s social status or personal image (‘car pride’). This paper introduces and validates a standard measure of car pride estimated from 12 survey statements using a cross- sectional sample of 1236 commuters in New York City and Houston metropolitan statistical areas. We find that car pride is higher in Houston than in New York City.
We then empirically examine the bidirectional relation between car pride (attitude) and household car ownership (behavior) using structural equation modeling. To identify the bidirectional relationship we use an individual’s general pride as the instrumental variable (IV) for that same individual’s car pride; in the opposite direction, we use the average household vehicle ownership in the respondent’s census block group as the IV for the respondent’s household car ownership. We find that positive and statistically significant relations exist from car pride to car ownership, while the relation in the reverse direction is not statistically significant. On average and in both city subsamples, the relation from car pride to household car ownership (attitude-to- behavior) is much stronger than the reverse (behavior-to-attitude). In fact, in our models car pride is more predictive of car ownership than most individual and household socio-demo- graphics included in traditional ownership forecasting models, including income. Empowered with a well-validated, standard measure for car pride and a robust approach for exploring reciprocal attitude-behavior relations in cross-sectional data, future research can ex- tend the current understanding presented in this paper to explore car pride’s relation with other travel behaviors, the dynamics of these attitude-behavior relations over time, and their implications for policies to promote sustainable travel behavior.
Keywords:
Car pride, Car ownership, Attitude-behavior relations, Structural equation modeling, Instrumental variables, New York City, Houston
1. Introduction
While many studies have demonstrated the strong association between symbolic and affective meaning of cars (including ‘car pride’) and car consumption, current literature does not provide clear definitions and standard measures for capturing these values and comparing their association with different travel behaviors across different populations. In this paper, we add to existing literature by introducing the polytomous car pride scale as a standard instrument for understanding and capturing the attribution of social status and personal image to owning and using a car. We demonstrate the scale’s validity, invariance, and reliability within a sample of commuters in two cities in the United States—New York City, NY and Houston, TX—with distinct travel and land use contexts.
We then use our car pride scale to explore the relation between an individual’s level of car pride and whether or not their household owns a vehicle. Here we might reasonably expect a bidirectional relation, with higher car pride contributing to a greater likelihood of car ownership and owning a car reinforcing higher car pride. An individual with high car pride might be more likely to own a car since they ascribe greater symbolic value to the car as a possession (Dittmar, 1992). Conversely, owning a car may increase car pride as it behooves its owner to ascribe meaning to the car to boost their self-image or have it match their behavior (Aronson, 1992). Using structural equation modeling techniques with instrumental variables, we demonstrate a practical way to probe the bidirectional relation between car pride (attitude) and car ownership (behavior) despite having cross-sectional data. This approach allows us to quantitatively compare the relative strengths of the attitude to behavior and behavior to attitude relations. Understanding the relative strengths of the bidirectional relations between attitude and behavior has important implications for planning and policy, determining whether interventions should target the attitudes (car pride) through informational campaigns and marketing, or the behavior itself (car consumption) through car ownership and usage restrictions or fees.
2. Literature review
For many years utility-based behavioral modeling based on functional value has been the dominant framework for understanding individual decision-making related to car consumption— ownership and usage (Schwanen and Lucas, 2011). In such a framework, each individual makes travel decisions based on the maximization of utility considering the characteristics of the decision-maker, the characteristics of the situation, and the functional attributes of the car— primarily travel time (speed), cost, reliability, convenience and flexibility, and safety (Ben-Akiva and Lerman, 1985). Such an approach has been criticized as privileging the instrumental aspects of car consumption decisions and ignoring the deep context of symbolic and affective relations between people, machines, and spaces of mobility (Sheller and Urry, 2006; Schwanen and Lucas, 2011; Sheller, 2004; Urry, 2004).
Possessing and using a car has symbolic and affective values in addition to instrumental values (Steg et al., 2001; Gärling and Loukopoulos, 2008; Gatersleben, 2007; Steg, 2004; Dittmar, 1992). The symbolic value of car consumption sees the car as a means to express individual identity and social position or group membership. As mobile symbols, the car ‘materializes personality’ and projects how we like to see ourselves, and how we would like others to see us (Gössling, 2017; Sheller, 2004). Affective value is derived from connections with deeper,
non-instrumental needs and desires, such as feelings of independence and freedom, power and control, or excitement and arousal (Steg, 2004; Anable and Gatersleben, 2005). Affective value is linked to emotions evoked by driving a car, which may be anticipated when making choices related to car purchase and use (Sheller, 2004).
2.1. Symbolic and affective values and their associations with car use and ownership Social psychological studies have begun to emphasize and evidence the significance of these more symbolic and affective values (often collectively called ‘attitudes’) in relation to transportation choices. These studies either adopt a qualitative approach through in-depth interviews or use latent variable approaches applied to survey data to quantify attitudes and incorporate them into utility- based models to predict travel behavior.
While a complete review of all studies considering the attitudinal aspects of travel behavior is beyond the scope of this paper, a large body of literature suggests that symbolic and affective values of the car (and other travel modes) correlate with mode choice and car usage. Many studies have shown that symbolic and affective values are associated with the choice to use a car over other modes, particularly public transport (e.g., Miralles-Guasch et al., 2014; Van et al., 2014; Bergstad et al., 2011; Domarchi et al., 2008; Beirão and Sarsfield Cabral, 2007). Other studies have demonstrated that symbolic and a ective values are related to frequency of car use (e.g., Lois and López-Sáex, 2009; Nilsson and Küller, 2000) and intended use of cars in the future (e.g., Pojani et al., 2018; Stradling et al., 1999).
Despite clear links with car usage, the symbolic and affective values of car ownership have been studied less frequently and from fewer theoretical perspectives (Schwanen and Lucas, 2011). While symbolic and affective values are often compared across car- owners and non-car-owners (e.g., Hiscock et al., 2002), few studies have explored how attitudes might influence current or future car ownership. In a recent study in China, He and Thorgersen found that attitudinal factors have a strong association with the intention to buy a car, even after controlling for other personal and situational factors (2017). Others have demonstrated that certain symbolic and affective values are associated with greater purchase intentions for electric vehicles (White and Sintov, 2017; Ashmore et al., 2018a).
2.1.1. Car pride
Cars convey and connote images of status, wealth, and social standing in public spaces in a manner in which few other commodities can (Gössling, 2017; Litman, 2011). The symbolic value of a car is derived from the fact that people can express themselves (personal image) and their social position (social status) by owning or using a car; they can compare their (use of a) car with others and to social norms (Steg, 2004). This attribution of personal image and social status to owning and using a vehicle can elicit feelings of pride (Zhao and Zhao, 2018).
In a cross-sectional sample of residents in Shanghai, China, this ‘car pride’ has been shown to be significantly and positively correlated with car ownership, even after controlling for socioeconomic and location variables. Furthermore, among car-owners in the sample, higher car pride is associated with a higher probability of choosing a car as the primary commute mode, more frequent car use, greater distance traveled, and higher share of car trips (Zhao and Zhao, 2018).
2.2. Limitations of existing studies
In the context of travel mode choice, ‘attitudes’ are often measured using simple, aggregate associations of good and bad or pleasant and unpleasant across different modes, without differentiating different types of symbolic or affective values (Haustein and Hunecke, 2007). Such composite measures of ‘car positivity’ are often di cult to interpret in applied settings and can be hard to connect with actionable recommendations for policy and practice.
Even when specific symbolic or affective values are defined, comparing the results of these studies is di cult. Each study uses different survey instruments to measure the symbolic and affective attributed to driving or owning a car in relatively homogeneous populations in specific cities or regions, often providing little evaluation of the validity and reliability of these ad-hoc measures. Furthermore, it is highly likely that the association among these measures and travel behavior will differ according to an individual’s personal circumstances and in different geographical and physical contexts. Therefore, it is difficult to determine from the literature the order of importance of different symbolic or affective values and how they relate to owning and using a car.
Finally, the direction of causality of these associations of symbolic and affective values and travel behavior is often left unexplored. If bidirectional relations exist and are not adequately modeled, endogeneity can introduce bias in estimated parameters and call into question the veracity of resulting conclusions. Thus there remains a heated debate on the topic of simultaneity of attitude and behavior in transportation research.
2.3. Bi-directionality of the attitude-behavior relationship
As early as the 1970s, transportation research acknowledged that non-instrumental factors (such as attitudes) might play an important role in determining people’s travel behavior. Initial studies investigating the attitude-behavior relationship in transportation focused on assessing the direction of causation. Studies from this period used cross-sectional data in combination with two- stage least squares estimation (Dobson et al., 1978; Reibstein et al., 1980; Tardiff, 1977) or panel data (Tischer and Phillips, 1979). Without exception, these studies found reciprocal relationships between attitudes and travel behavior.
After this initial interest, research into attitude-behavior relationship in the transportation domain declined until the late 1990s (Gärling, Gillholm, and Gärling, 1998). Since then, theoretical frameworks have been developed to study the e ects of attitudes on behavior through the lens of psychological action models (Ajzen and Fishbein, 1980, 2005). The most prominent and influential framework is the Theory of Planned Behavior, which models behavior as a function of “behavioral intention”—a combination of “attitude toward the behavior,” “subjective norm,” and “perceived behavioral control” (Ajzen, 1991, 2005). This model, and ex- tensions thereof, have been extensively applied in the transportation domain (Haustein and Hunecke, 2007; Donald et al., 2014; Bamberg 2006; Bamberg et al., 2003; de Groot and Steg, 2007; Heath and Gifford, 2002; Verplanken et al., 1994). It has also become popular to include attitudes in discrete choice models (Ben-Akiva et al., 2002). However, all of these approaches generally assume that attitudes influence behavior and not the other way around. While researchers typically acknowledge that a reverse relation- ship—from behavior to attitudes—may also exist
(Ajzen, 2015), these possible reciprocal effects are rarely explored, even when panel data are available (e.g. Bamberg et al., 2003 with the exception of Thøgersen (2006)).
Recent work by Kroesen et al. (2017) presents a new framework (in line with the Theory of Cognitive Dissonance) to study attitude-behavior (in)consistency over time and to assess the direction of causality between attitudes and behavior. Using data from a two-wave mobility panel, they estimate cross-lagged panel models and latent transition models. Their results corroborate the existence of a bidirectional attitude-behavior relationship, indicating that use of a mode and the attitude towards using that mode mutually influence each other over time. Contrary to conventional wisdom and commonly used modeling frameworks, however, they find that the effects of behaviors on attitudes are much larger than vice versa in their case study.
While the approach proposed by Kroesen et al. (2017) is a powerful framework for exploring the bidirectionality of the attitude-behavior relationship, it requires longitudinal data. In this paper, we explore the bidirectional relations between attitudes and behavior using an alternative approach that does not rely on panel data. Using cross sectional data in a commonly applied Structural Equation Modeling (SEM) framework, we introduce instrumental variables for our latent (attitudinal) construct and behavioral outcome, enabling us to simultaneously estimate and compare bidirectional attitude-behavior relations.
3. Data
This study is conducted using a sample of 1236 survey responses from two metropolitan statistical areas (MSAs) in the United States defined by the U.S. Census Bureau: the New York-Newark-Jersey City, NY-NJ-PA (NYC) and Houston-The Woodlands-Sugar Land, TX metro area (HOU). The two metropolitan areas were selected for their vastly different urban and transportation contexts. In particular, NYC is selected as the most public transit focused metropolitan area in the U.S., while HOU is selected as a city with decidedly auto-oriented travel patterns (despite some public transit infrastructure).
3.1. Case study cities
The NYC MSA is the largest metropolitan area in the U.S. by population (over 20 million residents in 2017). The NYC MSA is served by the largest public transportation network in the U.S., consisting of 245 miles of subway, multiple commuter rail systems, and a vast network of bus routes (with a fleet of 5710 buses in 2016). This public transportation system consistently reports the highest annual ridership of any system in the U.S. on its subway (2.7 billion), multiple commuter rail systems, and buses (730 million) (APTA, 2018). Household vehicle ownership in the NYC MSA is lower than the national average, despite higher median household incomes. In particular, NYC MSA has a much larger share of zero-car households (22%) than seen in the U.S as a whole (4%) (Data USA, 2018b). In NYC MSA, 30% of commute trips are taken by public transport compared to 5% in the US as a whole; the drive alone share is around 50% compared with 76% in the U.S. (Data USA, 2018b).
On the other hand, the HOU MSA is home to fewer than 7 million people and is served by a public transit system consisting of 22.9 miles of light rail transit and a modest bus network with a fleet of 1230 buses serving annual ridership of 66 million (APTA, 2018). Household vehicle ownership in the HOU MSA is slightly higher than the national average (Data USA, 2018a),
with an even lower share of zero-car households (2.1%) than seen in the U.S. as a whole. In the HOU MSA, only 1.9% of commute trips are taken by public transport, with a drive alone share of 80.8% (Data USA, 2018a).
3.2. Sample
Each respondent in the sample is at least 18 years of age and self-defined as a commuter (traveling from home to work at least three days out of a work week). Participants were recruited by a professional panel and survey company, Qualtrics. Self-reported home address zipcodes were used to screen whether participants lived within the two selected MSAs. Respondents completed the entire survey online and were compensated with a monetary reward for their time. Data collection was controlled for representativeness of the MSA populations using response quotas for age, gender, and household income, but all quotas were relaxed towards the end of data collection due to lagging response rate.
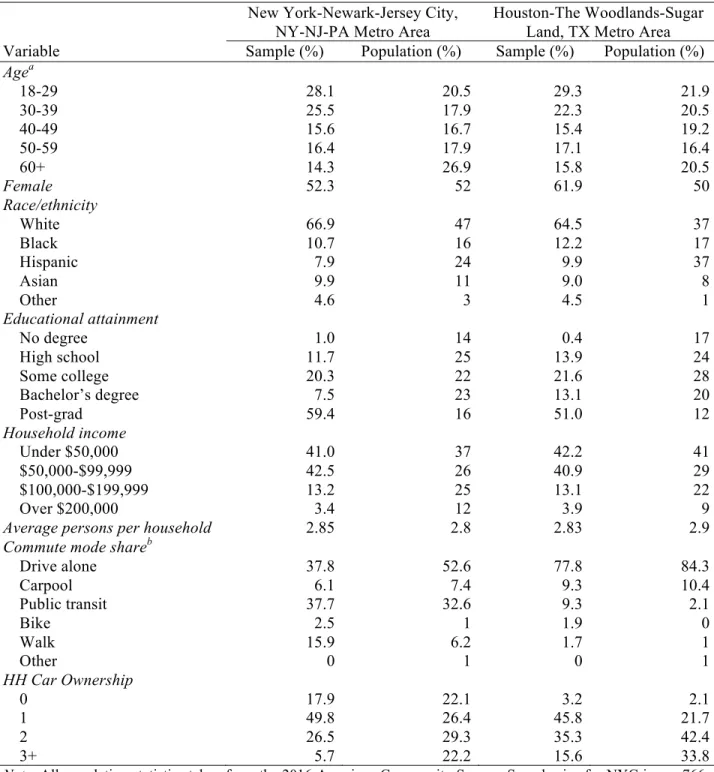
1251 complete responses were collected, but respondents who failed to answer three attention checks throughout the survey were removed. This yielded a final sample size of 1236 responses, with 766 responses in NYC and 470 responses in HOU. Comparison of the sociodemographic characteristics of the sample with those of the populations in the two metro areas, we find that our samples in both cities underrepresent Black and Hispanic residents, residents aged 60 and older, those without high school or college educations, and very high-income households (see Table 1). Furthermore, our samples in both cities overrepresent one-car households and underrepresent households three or more vehicles (see Table 1).
In addition to standard questions about demographic characteristics of respondents—including age, gender, race or origin, household composition, income level, employment, and education— the survey asked respondents to share information about their household car ownership and to complete a basic commute travel diary. The final section of the survey consisted of Likert-format, Likert-scale questions that related different dimensions of pride, social status, and personal image to car use and car ownership. From these Likert-format questions, we derive a measure of car pride.
Table 1. Comparison of sample representativeness against metropolitan area populations
New York-Newark-Jersey City, NY-NJ-PA Metro Area
Houston-The Woodlands-Sugar Land, TX Metro Area Variable Sample (%) Population (%) Sample (%) Population (%) Agea 18-29 30-39 40-49 50-59 60+ 28.1 25.5 15.6 16.4 14.3 20.5 17.9 16.7 17.9 26.9 29.3 22.3 15.4 17.1 15.8 21.9 20.5 19.2 16.4 20.5 Female 52.3 52 61.9 50 Race/ethnicity White Black Hispanic Asian Other 66.9 10.7 7.9 9.9 4.6 47 16 24 11 3 64.5 12.2 9.9 9.0 4.5 37 17 37 8 1 Educational attainment No degree High school Some college Bachelor’s degree Post-grad 1.0 11.7 20.3 7.5 59.4 14 25 22 23 16 0.4 13.9 21.6 13.1 51.0 17 24 28 20 12 Household income Under $50,000 $50,000-$99,999 $100,000-$199,999 Over $200,000 41.0 42.5 13.2 3.4 37 26 25 12 42.2 40.9 13.1 3.9 41 29 22 9
Average persons per household 2.85 2.8 2.83 2.9
Commute mode shareb Drive alone Carpool Public transit Bike Walk Other 37.8 6.1 37.7 2.5 15.9 0 52.6 7.4 32.6 1 6.2 1 77.8 9.3 9.3 1.9 1.7 0 84.3 10.4 2.1 0 1 1 HH Car Ownership 0 1 2 3+ 17.9 49.8 26.5 5.7 22.1 26.4 29.3 22.2 3.2 45.8 35.3 15.6 2.1 21.7 42.4 33.8
Note: All population statistics taken from the 2016 American Community Survey. Sample size for NYC is n = 766 and sample size for HOU is n = 470.
a Sample and population age proportions calculated for those greater than 18 years of age.
b Population data for workers ages 16 and older, excluding those who work at home (5% in NYC and 4% in HOU); in the survey respondents (self-identified commuters ages 18 and older) were allowed to specify multimodal commutes, so sample mode shares are estimated as if each commute-leg was its own trip.
4. The car pride measure
The polytomous car pride scale was derived from a set of Likert-format items measured on a 7-point scale from “strongly disagree” (−3) to “strongly agree” (3) (see Appendix A). Items were designed to assess the degree to which an individual attributes social status and personal image to driving and using a car. In order to ensure that our scale encompasses the full construct of car pride, items relate both driving and owning a car with two facets of pride well established in the social psychology literature. Alpha or hubristic pride is pride related to one’s subjective feelings of superiority in relation to others (for example, “Driving a car makes me feel superior to those who don't”), whereas beta or authentic pride is related to one’s genuine feelings of self-esteem and self-worth (for example, “Driving a car positively affects my perception of myself”) (Tracy and Robins, 2007a, 2007b). Synonyms for social status and personal image used throughout the items are taken from semantic studies conducted by Tracy and Robins (2007a, 2007b). The items in this survey include and expand upon those statements used in previous studies to measure car pride (and car symbolism more generally) using survey instruments (Zhao and Zhao, 2018; Steg, 2004).
As detailed in the appendix, we estimate a series of confirmatory factor analysis (CFA) models to identify 12 survey items that make up a reliable and unidimensional measure of car pride. We demonstrate the content and convergent validity of this 12-item polytomous car pride scale. We then demonstrate the discriminant validity of the car pride measure by estimating a CFA that correlates it with a measure of general authentic pride to show that these are related, but distinct constructs. We then perform a series of multigroup confirmatory factor analyses (MGFA) to determine the degree to which 12-item measurement model for car pride is invariant across the two cities and across car-owners and non-car-owners. We demonstrate that imposing strong factorial invariance across these groups does not lead to substantial loss of model fit.
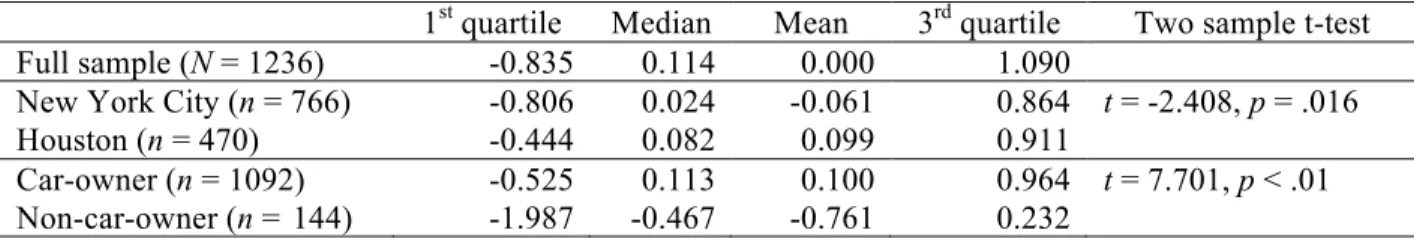
Having established a valid, reliable, and invariant measure of car pride, we can estimate factor scores and compare them across these key subsamples (see Table 2). We find that respondents in New York City have a lower average car pride than respondents in Houston and that this difference in means is statistically significant. This difference across the two cities is not surprising given the very different urban and transportation contexts of New York City and Houston as well as the potential that these contextual differences contribute to differences in attitudes and social norms among their residents.
Table 2. Estimated car pride factor scores across key subsamples
1st quartile Median Mean 3rd quartile Two sample t-test
Full sample (N = 1236) -0.835 0.114 0.000 1.090
New York City (n = 766) -0.806 0.024 -0.061 0.864 t = -2.408, p = .016 Houston (n = 470) -0.444 0.082 0.099 0.911
Car-owner (n = 1092) -0.525 0.113 0.100 0.964 t = 7.701, p < .01 Non-car-owner (n = 144) -1.987 -0.467 -0.761 0.232
Note: Car pride factor scores are estimated using maximum likelihood with robust standard errors to correct for non-normality. The minimum car pride factor score = −3.014 and the maximum = 2.118.
We also find a statistically significant difference in the mean car pride scores of car-owners and owners. We find that car-owners have substantially higher car pride than
non-car-owners, which parallels findings using a related, but different survey measure of car pride in Shanghai (Zhao and Zhao, 2018). This clear difference in means suggests that car pride and car ownership are positively related, but does not provide insight into how the attitude and behavior might reinforce one another. The next section explores these directed relations.
5. Attitude-behavior models: methodology
Having demonstrated the reliability, validity, and invariance of our polytomous car pride scale (see Appendix A), we explore its bidirectional relations with a binary indicator of whether or not the household owns a car using structural equation modeling (SEM). We control for individual sociodemographics—age, gender, race/ethnicity, educational attainment, and employment or student status—as well as household covariates—income, number of people, and number of working adults. Since we have established that there is no significant difference in the structure of the car pride scores across the two cities, we can estimate the average bidirectional model specified in Figure 1 for the pooled sample of respondents from both New York City and Houston. Then, we estimate city-specific effects of car pride on car ownership across the two subsamples using a multigroup analysis.
Figure 1. Path diagram for the structural equation model simultaneously estimating the bidirectional relationship between car pride and household car ownership
Note: The car pride and general authentic (beta) pride constructs are estimated using the measurement models depicted in Figure A1 and Figure A2 in the Appendix, respectively. Variances of and covariances among all observed sociodemographic variables are also estimated.
5.1. Instrumental variables
The simultaneity of the relations between car pride and car ownership leads to endogeneity, which if ignored, could lead to parameter estimates that are biased (Antonakis et al., 2010, 2014). The most common approach to simultaneity issues in cross- sectional data is the use of “instruments” (exogenous sources of variance in the explanatory variable that do not correlated with the error term of the outcome) to purge the endogenous predictor variable from bias (Bollen and Noble, 2011). And neither the explanatory variable nor the outcome variable has a direct or indirect effect on the instrument; nor does any other variable in the model affect both the instrument and the outcome variable (Mulaik, 2009). In order to explore the bidirectional relation in our model, it is necessary to identify instrumental variables for both car pride and household car ownership.
For the direct path from car pride to household car ownership, we use a measure of an individual’s general authentic pride as an imperfect instrumental variable. This measure of general pride is estimated from response patterns on six 7-point Likert-format items designed to capture the respondent’s pride in their life and achievements (see Appendix A). These statements were designed with synonyms of pride taken from the same source as was used to construct the car pride scale (Tracy and Robins, 2007a, 2007b), but without specific relation of social status or personal image to the car (for example, “My peers would say that I am successful” or “I feel a sense of self-worth”). However, unlike the car pride measure, the final measure of general pride did not contain statements covering both facets of pride (Tracy and Robins, 2007a, 2007b), but only the authentic pride related to one’s genuine feelings of self-esteem and self-worth. Although it is reasonable to assume that general pride only predicts household car ownership through its manifestation as car pride, general pride may be correlated with some of the other individual sociodemographics in the model that are also used to explain the outcome of interest. This makes it an imperfect instrumental variable.
For the direct path in the opposite direction from household car ownership to car pride, the average household vehicle ownership in the respondent’s census block group from the 2016 American Community Survey was merged with their individual responses based on their self-reported home location. The average vehicle ownership in the home census block group is highly correlated with whether or not the respondent’s household owns a car. But it may also be an imperfect instrumental variable if an individual’s car pride is directly related to the average vehicle ownership in their census block group (perhaps by way of social comparison).
Finally, in specifying any instrumental variable SEM model, consistency of parameter estimates can only occur if the cross- equation disturbances are estimated. One must build into the model the very correlation that we are trying to correct for with the instrumental variable: the correlation between the error term of the predictor variable (x) and the outcome variable (y) (Allison, 2018). Estimating this correlation acknowledges any unmodeled common cause of x and y, which must be included in the model; failing to estimate it suggests that x is exogenous and does not require instrumenting (Antonakis et al., 2010).
5.2. Estimation method
Limited information estimators, such as two-stage least squares (2SLS) or instrumental-variable estimation, is recommended for simultaneous equations where one or more predictors are endogenous (Antonakis et al., 2010, 2014). This estimator is recommended because, if there is a
misspecification in one part of a complicated model, this misspecification will not bias estimates in other parts of the model as would occur when using full-information estimators like maximum likelihood (the usual estimator in most structural- equation modeling programs) (Bollen, 1996; Bollen et al., 2007). 2SLS estimation incorporating latent variables is available in Stata and R1;
however, these programs cannot handle categorical outcomes (such as household car ownership) with observed predictors.
Therefore, for our model, we must settle for using full information estimators, such as maximum likelihood or weighted least squares. While more sensitive to model misspecification, these full information approaches have been shown to provide parameters equivalent to those produced by 2SLS for models with a single instrument for each endogenous variable (Allison, 2018; Burgess et al., 2014). We estimate our bidirectional model using the weighted least square mean and variance adjusted (WLSMV) estimators with theta parameterization using a probit link function in Mplus version 8.1 (Muthén and Muthén, 1998–2018; Asparouhov, 2016). This simultaneous estimation allows for causal inference on the relative strength of the relation from attitude to behavior and vice versa.
5.3. City multigroup analysis
We might reasonably expect differences in the bidirectional relations between car pride and car ownership across our two cities given their different urban and transport contexts. Therefore, after estimating the average model on the pooled sample of survey respondents, we conduct a multigroup analysis that allows the reciprocal paths between car pride and household car ownership to differ across the two city subsamples.2 First, we estimate an unconstrained multigroup model that allows all structural relations to differ across the two city subsamples (while imposing strong invariance constraints on the car pride and general pride measurement models). Then we estimate a model that constrains both of the directed paths between car pride and car ownership to be equal across groups. Because these models are hierarchically nested, we can use a chi-square difference test to determine whether there are statistically significant differences in these paths across groups.
6. Attitude-behavior models: results
6.1. Bidirectional relation between car pride and car ownership
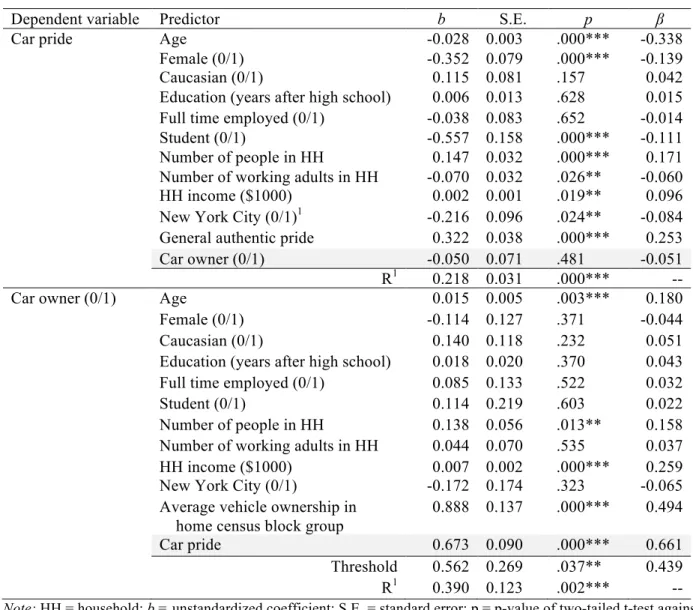
We estimate the model with bidirectional relationship between the continuous latent variable (car pride) and a binary outcome (household car ownership) as in Figure 1. This allows us to directly compare the magnitudes of the two causal directions (see Table 3). We find that the path from car pride to car ownership is positive and statistically significant (b = 0.673, S.E. = 0.090, p < .01, β = 0.661). In fact, an individual’s car pride (attitude) is a stronger predictor of household car ownership (behavior) compared to the individual and household sociodemographic characteristics captured in our survey and used in traditional ownership forecasting, including income.
1 See the MIIVsem package by Fisher et al. (2019) that builds on the popular lavaan package (Rosseel, 2018). 2 Multigroup analysis is the recommended approach when considering moderation by discrete variables (Sauer and 2 Multigroup analysis is the recommended approach when considering moderation by discrete variables (Sauer and Dick, 1993; Baron and Kenny, 1986).
Considering the opposite path from car ownership to car pride, we find it is not statistically different from zero (b = −0.050, S.E. = 0.071, p = .481, β = −0.051). Comparing the statistical significance and relative magnitudes of the standardized regression coefficients for the car pride to car ownership and car ownership to car pride relations, we conclude that car pride (attitude) influences car ownership (behavior) much more strongly than the reverse (behavior reinforcing attitude). This suggests that, the overall effect between car pride and car ownership is positive, following the direction traditionally assumed by the Theory of Planned Behavior: from attitude to behavior.
Table 3. Direct path parameter estimates for simultaneous estimation of the bidirectional relation between car pride and car ownership
Dependent variable Predictor b S.E. p β
Car pride Age -0.028 0.003 .000*** -0.338
Female (0/1) -0.352 0.079 .000*** -0.139 Caucasian (0/1) 0.115 0.081 .157 0.042 Education (years after high school) 0.006 0.013 .628 0.015 Full time employed (0/1) -0.038 0.083 .652 -0.014 Student (0/1) -0.557 0.158 .000*** -0.111 Number of people in HH 0.147 0.032 .000*** 0.171 Number of working adults in HH -0.070 0.032 .026** -0.060 HH income ($1000) 0.002 0.001 .019** 0.096 New York City (0/1)1 -0.216 0.096 .024** -0.084
General authentic pride 0.322 0.038 .000*** 0.253 Car owner (0/1) -0.050 0.071 .481 -0.051 R1 0.218 0.031 .000*** --
Car owner (0/1) Age 0.015 0.005 .003*** 0.180 Female (0/1) -0.114 0.127 .371 -0.044 Caucasian (0/1) 0.140 0.118 .232 0.051 Education (years after high school) 0.018 0.020 .370 0.043 Full time employed (0/1) 0.085 0.133 .522 0.032 Student (0/1) 0.114 0.219 .603 0.022 Number of people in HH 0.138 0.056 .013** 0.158 Number of working adults in HH 0.044 0.070 .535 0.037 HH income ($1000) 0.007 0.002 .000*** 0.259 New York City (0/1) -0.172 0.174 .323 -0.065 Average vehicle ownership in
home census block group
0.888 0.137 .000*** 0.494 Car pride 0.673 0.090 .000*** 0.661 Threshold 0.562 0.269 .037** 0.439 R1 0.390 0.123 .002*** -- Note: HH = household; b = unstandardized coefficient; S.E. = standard error; p = p-value of two-tailed t-test against b = 0; β = standardized coefficient; statistical significance at * = 10% level, ** = 5% level, *** = 1% level
Overidentified model fit: !!(332, N = 1,236) = 1084.086, p < .01, CFI = 0.877, TLI = 0.859, RMSEA = 0.043 with 90% CI = [0.040, 0.046], SRMR = 0.095.
Correlation between error terms: car pride with car owner (b = -0.577, S.E. = 0.153, p < .01, β = -0.519).
1 Being from New York City is predictive of lower car pride than being from Houston. This effect is only marginally significant, but parallels the results of the comparison in mean car pride scores across the two city subsamples seen in Table 2.
6.2. Differences across cities
The bidirectional relation measured in the model above represents the average across all respondents in both U.S. cities. However, given the different mobility patterns and infrastructure in New York City and Houston, we might expect to see different relations between car pride and car ownership across the two cities. Therefore, we test whether city differences exist in the bidirectional relations between car pride and car ownership using multigroup analysis. We test two separate models of the data, one where the bidirectional relations between car ownership and car pride are fit independently in the two city subsamples (“free”), and one where these relations are constrained to have the same coefficients across the entire sample (“constrained”) (see Table 4).
With the free model as the baseline, we can compare whether constraining the coefficients to be the same in both cities leads to significantly worse fit between the model-implied variance-covariance matrix and the variance-variance-covariance matrix observed in our data. Using a chi-square difference test, we find that constraining the paths between car pride and car ownership to be equal across the two city subsamples does not result in statistically significant worsening of model fit: !!!(2) = 2.198, p = .333. This suggests that there are no significant differences in the
bidirectional relations between car pride and car ownership between our subsamples of New York City and of Houston commuters.
Table 4. Bidirectional relations between car pride and household car ownership by city subsamples
Dependent variable Predictor Model bNYC bHOU βNYC βHOU
Car pride Car owner (0/1) Free -0.017 -0.317 -0.018 -0.201 Constrained -0.027 -0.025 -0.019 Car owner (0/1) Car pride Free 0.596*** 0.802*** 0.560 1.236 Constrained 0.750*** 0.815 1.091
Note: Coefficients are standardized separately for the two city subsamples.
Even if we treat the two cities separately (as in our free model in Table 4), our finding about the relative magnitudes of the relations between car pride and car ownership do not change. In both New York City and Houston, the path from car pride (attitude) to car ownership (behavior) is positive and much more statistically significant and stronger than the reverse path from car ownership (behavior) to car pride (attitude). Therefore, the general conclusions from the average model presented above hold across both cities.
7. Discussion
In this paper, we empirically examine car pride’s bidirectional relation with household car ownership using structural equation modeling. Our use of instrumental variables allows us to explore the bidirectionality of the relation between car pride and car ownership in cross-sectional data. In our combined sample of commuters in two U.S. cities, we find that car pride is positively and significantly predictive of household car ownership. In fact, car pride has a larger impact on car ownership than most other individual or household sociodemographic included in the model. In the reverse direction, we find no statistically significant effect. Comparing the statistical significance and magnitudes of both directed relations, we find that car pride (attitude) predicts household car ownership (behavior) much more strongly than car ownership (behavior)
reinforces car pride (attitude). When considering car pride and car ownership, these results support the direction of the attitude-behavior relation assumed by the Theory of Planned Behavior.
We also consider whether there are differences in car pride and its relations with car ownership between our two case study cities. First, we consider measurement invariance across the two cities and demonstrate that both cities share the same factor structure and interpretation of car pride (see Appendix A). Second, we consider average car pride scores between the two cities. Third, we consider whether the bidirectional relations between car pride and car ownership differ between the two cities.
Comparing average car pride between the two cities, we find that commuters in New York City report significantly lower car pride than commuters in Houston, even after controlling for individual and household sociodemographics of the two city samples. This suggests that the lower car pride observed among commuters in New York City cannot be fully explained by differing individual characteristics in the city subsamples. In other words, an individual’s car pride is related to the urban and transportation contexts in which they live. In particular, individuals living in the Houston metropolitan area, where urban form and transportation infra- structure provide little alternative to car ownership and use, have higher car pride than similar individuals (by sociodemographics) living in the New York City metropolitan area. Thus, we nd distinct differences in car pride between the two cities and speculate that individual car pride may be positively related to car dependence (as a function of the metropolitan context in which the individual lives).
Finally, we consider whether the relations between car pride and car ownership differ between our two cities. We find no statistically significant difference in the bidirectional relations between car pride and car ownership between the two cities, despite the cities’ different average levels of car pride. This suggests that car pride is positively predictive of household car ownership despite different baseline levels of car pride in our two cities. It also suggests that our findings from the combined sample hold across both cities: when it comes to the relations between car pride and car ownership, attitude predicts behavior much stronger than the reverse. 7.1. Limitations and future work
The results and conclusions presented here are for a limited sample of commuters in two cities in the United States. Even within these two cities, our sample underrepresents key segments of the population, particularly Black and Hispanic residents, those with low educational attainment, and those living in households with very high incomes and more than three vehicles. Therefore, care should be taken in generalizing the results beyond middle class, Caucasian residents of these two metropolitan regions.
While the two cities in this study were selected specifically for their different transportation and urban contexts in order to test the invariance and sensitivity of our car pride measure across different groups of people, future research should continue to evaluate the performance of the car pride scale in other samples of individuals and cities both within and outside the U.S. Such studies could also extend the structural understanding presented in this paper to explore car pride’s relation with other travel behaviors such as commute mode choice, frequency of car usage or vehicle miles traveled, price and type of car purchased, or propensity to use new
transportation technologies and services. For each type of behavior, it will be important to continue to consider the bidirectionality of attitude-behavior relationships and to address this reciprocity using instrumental variables, longitudinal data, or other experimental techniques appropriate for causal inference.
Furthermore, while the focus of this study was on the attitudes and behaviors of individuals, the symbolic and affective values of car consumption (‘car culture’) extend beyond individuals through flows, circulations, distributions, intensifications, and interferences among people, things, and places (Sheller, 2004). Therefore, a more thorough study of car pride and other symbolic and affective values of car consumption could also consider meso-level aggregation of specifically located car cultures and macro-level patterns of regional, national, and transnational emotional, cultural, and material geographies around car consumption (Ashmore et al., 2018b; Gössling, 2017; Sheller, 2004). Cross-cultural studies of attitudes and their impact on travel behavior come with their own methodological challenges (Ashmore et al., 2017), but would help clarify the extent to which the results in this study generalize to other populations.
Recognizing these limitations and the need for continued work, this study provides a solid foundation for the continued exploration of the bidirectional relations between an individual’s car pride and their transportation decisions and reinforces the need for proper methodologies to handle simultaneity when studying attitudes and behaviors.
8. Conclusions
In this paper we introduce and validate the polytomous car pride scale—a 12-item Likert-scale measure of the attribution of social status and personal image to driving and owning a vehicle— for a sample of 1236 commuters in New York City, NY and Houston, TX in the United States. We provide the foundation for a standard, quantifiable measure of car pride that can be compared over time and across people, providing consistent, specific, and actionable information for future transportation planning and policymaking.
Using cross-sectional data with appropriate causal modeling techniques, our instrumental variable approach allows us to answer the question of whether attitude causes behavior or vice versa. We find that a positive and statistically significant relation exists from car pride to car ownership, but not in the reverse direction. On average and in both city subsamples, the relation from car pride to household car ownership (attitude-to-behavior) is much stronger than the reverse (behavior-to-attitude).
This explicit exploration of causal bidirectionality has important implications for behavioral research, model development, and policy interventions—particularly those intended to reduce car ownership and usage and promote sustainable travel behaviors (Chorus and Kroesen, 2014). Current efforts to reduce car ownership and usage often focus on regulations targeting individual’s travel behavior, such as license restrictions or congestion charging, that have proved politically difficult to implement. However, our results suggest that interventions targeting attitudes such as car pride may also be effective in influencing behavior through attitude change. Empowered with our standard measure of car pride, researchers and policymakers can now
evaluate the impact of such interventions using pre- and post- studies in accordance with evidence policy-making frameworks.
Acknowledgements
The authors would like to thank Professor Dana McCoy and Emily Hanno of Harvard University for their methodological guidance during the early development of this research. Financial support for data collection was provided by the New England University Transportation Center. This research is part of the MIT Energy Initiative’s Mobility of the Future study.
Appendix A. Car pride measure development and evaluation
In this section, we discuss the development and evaluation of a polytomous (7-point Likert-scale) measure of individual car pride. Many potential survey items were piloted in a survey of respondents in New York City, NY and Houston, TX in the United States. From this U.S. city data, 12-items are selected to make up a polytomous measure of car pride, which demonstrates strong psychometric properties. We estimate a series of confirmatory factor analysis (CFA) models to identify reliable and unidimensional measures of car pride and of general authentic pride.
All CFA models presented in this section are estimated using maximum likelihood with robust standard errors (MLR) estimation to correct for the non-normality of the Likert-format survey items in Mplus version 8.1 (Muthén and Muthén, 1998–2018). We compare the overall model fit to established standards: a chi-square test statistic that is not statistically different from zero, CFI and TLI greater than 0.90, and RMSEA and SRMR less than 0.08 (Kline, 2016). By applying MLR estimation, we treat as continuous our polytomous items measured on a 7-point Likert scale. This is a common practice given that most literature suggests that maximum likelihood performs reasonably well with five or more response categories whereas weighted least squares with mean and variance adjustment (WLSMV) is recommended with two or three response categories (Beauducel and Herzberg, 2006; Dolan, 1994).
A.1. Convergent validity of the car pride scale
Our survey contains 20 items associating driving and owning a car with social status and personal image. We estimate a CFA model with all 20 items loading onto one factor (see Table A1). From this 20-item model, we identify the items for which the majority of the item variance is explained by the single factor (standardized factor loading of > 0.70 and an R2 > 0.5) as suggested by Kline (2016) to ensure convergent validity. We consider this subset of 12 items to ensure that together they provide adequate coverage over the construct of interest—including statements relating both facets of pride to both car ownership and car usage. These 12 items have a Cronbach’s alpha of 0.94, suggesting suitable internal consistency.
Table A1. Confirmatory factor analysis results for all 20 car pride items Item code Statement Unstandardized factor loading S.E. Two-tailed p-value Standardized factor loading R2 Q28_2 I feel more accepted in my
community when I drive a car
1.000a 0.695 0.483
Q28_3 Driving meets my self esteem or personal image
1.080 0.031 0.00 0.753 0.567
Q28_4 Driving a car makes me feel superior to those who don't
1.201 0.050 0.00 0.729 0.532
Q28_5 I feel like I don’t belong driving a car [reverse coded]
-0.369 0.064 0.00 -0.227 0.051
Q28_6 Driving a car positively affects my perception of myself
1.088 0.039 0.00 0.735 0.540
Q28_8 Driving to work suits my job/position
0.778 0.043 0.00 0.517 0.268
Q51_1 A car is a sign of social status 1.000 0.051 0.00 0.677 0.458
Q51_2 I would be ashamed if future financial circumstances prevented me from driving
0.791 0.045 0.00 0.506 0.256
Q51_3 I would love to be seen more often driving
1.100 0.050 0.00 0.727 0.528
Q51_4 If more people saw me in/with my car, I would drive more
1.163 0.054 0.00 0.726 0.527
Q51_5 I gain respect from my peers because I drive a car
1.202 0.052 0.00 0.754 0.569
Q31_1 Having a car is connected with one's social image
1.133 0.048 0.00 0.790 0.624
Q31_2 I deserve to own and express myself with a great car
1.134 0.049 0.00 0.803 0.645
Q31_3 Others would see me as more successful if I owned a better car or more cars
1.144 0.051 0.00 0.757 0.574
Q31_4 I have achieved in life and therefore I deserve a good car
1.099 0.050 0.00 0.786 0.617
Q31_5 Having a car is connected with one’s social image
0.688 0.046 0.00 0.594 0.353
Q53_6 I feel owning a car is a positive component of my identity
1.119 0.044 0.00 0.824 0.680
Q53_7 Having a car makes me feel superior to those who don't
1.123 0.054 0.00 0.698 0.487
Q53_8 I have a sense of accomplishment after buying a car
0.943 0.045 0.00 0.711 0.505
Q53_9 I want to have a successful life and that includes owning a nicer car or more cars
1.115 0.050 0.00 0.764 0.584
Note: Overidentified model fit: !!(60, N = 1,236) = 2808, p < .01, CFI = 0.773, TLI = 0.747, RMSEA = 0.113 with 90% CI = [0.109, 0.116], SRMR = 0.075. Shaded items were removed from the final car pride measure due to standardized factor loadings < 0.72 and R-squared values < 0.52.
a Value fixed to one for model identification and scaling.
We run a subsequent CFA on this subset of 12 items that show the highest factor loadings (Table A2). The overidentified model does not meet established standards of model fit as outlined by Kline (2016). However, an investigation of Lagrangian Multiplier modification indices suggests that adding correlations among error terms of some of the items can significantly improve model
fit. We review each pair of statements for which modification indices are greater than 100 indicating that introducing a correlation term could improve the chi-square of the model by at least 100.
Table A2. Confirmatory factor analysis results for the 12 car pride items without correlated errors
Item code Statement Unstandardized factor loading S.E. Two-tailed p-value Standardized factor loading R2 Q28_3 Driving meets my self esteem or
personal image
1.000 0.731 0.534
Q28_4 Driving a car makes me feel superior to those who don't
1.138 0.045 0.00 0.724 0.524
Q28_6 Driving a car positively affects my perception of myself
1.019 0.034 0.00 0.721 0.519
Q51_3 I would love to be seen more often driving
1.074 0.045 0.00 0.743 0.553
Q51_4 If more people saw me in/with my car, I would drive more
1.141 0.052 0.00 0.746 0.557
Q51_5 I gain respect from my peers because I drive a car
1.166 0.050 0.00 0.766 0.587
Q31_1 Having a car is connected with one's social image
1.076 0.044 0.00 0.786 0.618
Q31_2 I deserve to own and express myself with a great car
1.094 0.041 0.00 0.812 0.660
Q31_3 Others would see me as more successful if I owned a better car or more cars
1.094 0.047 0.00 0.759 0.576
Q31_4 I have achieved in life and therefore I deserve a good car
1.050 0.043 0.00 0.787 0.619
Q53_6 I feel owning a car is a positive component of my identity
1.051 0.036 0.00 0.812 0.660
Q53_9 I want to have a successful life and that includes owning a nicer car or more cars
1.058 0.041 0.00 0.759 0.577
Note: Overidentified model fit: !!(54, N = 1,236) = 1168, p < .01, CFI = 0.833, TLI = 0.796, RMSEA = 0.129 with 90% CI = [0.123, 0.136], SRMR = 0.063.
We introduce a total of 5 correlations among statements that share similar wording or are probing the same specific facet of car pride. We propose a final 12-item CFA model of car pride with correlated error terms as depicted in Figure A1. The CFA model results for the factor structure depicted in Figure A1 are given in Table A3. We find that this 12-item single-factor measure of car pride with correlated error terms fits the data well (!!(49, 1236) = 346, p < .01,
CFI = 0.955, TLI = 0.940, RMSEA = 0.070 with 90% CI = [0.063, 0.077], SRMR = 0.040). Given the large sample size, we overlook the statistically significant chi-square test statistic and note that the CFI and TLI are well above the established threshold of 0.90 for moderate model fit and that RMSEA and SRMR are well below 0.08 (Kline, 2016). The convergent validity of the measure is well-established, with most items having standardized factor loadings close to or greater than 0.7 and R2 values close to or greater than 0.50.
Figure A1. Analytic model for 12-item car pride confirmatory factor analysis
Note: Variances of the item error terms are estimated (but not shown). Symbol key: u = usage; o = ownership; β = authentic pride; α = hubristic pride
Table A3. Confirmatory factor analysis results for the 12 car pride items with correlated errors
Item code Statement Unstandardized factor loading S.E. Two-tailed p-value Standardized factor loading R2 Q28_3 Driving meets my self esteem or
personal image
1.000 0.717 0.515
Q28_4 Driving a car makes me feel superior to those who don't
1.119 0.046 0.000 0.698 0.488
Q28_6 Driving a car positively affects my perception of myself
1.018 0.036 0.000 0.706 0.499
Q51_3 I would love to be seen more often driving
1.009 0.043 0.000 0.685 0.469
Q51_4 If more people saw me in/with my car, I would drive more
1.047 0.048 0.000 0.673 0.453
Q51_5 I gain respect from my peers because I drive a car
1.091 0.047 0.000 0.706 0.498
Q31_1 Having a car is connected with one's social image
1.117 0.049 0.000 0.800 0.640
Q31_2 I deserve to own and express myself with a great car
1.118 0.044 0.000 0.814 0.662
Item code Statement Unstandardized factor loading S.E. Two-tailed p-value Standardized factor loading R2 successful if I owned a better car or
more cars
Q31_4 I have achieved in life and therefore I deserve a good car
1.077 0.047 0.000 0.791 0.626
Q53_6 I feel owning a car is a positive component of my identity
1.102 0.040 0.000 0.834 0.696
Q53_9 I want to have a successful life and that includes owning a nicer car or more cars
1.105 0.045 0.000 0.778 0.605
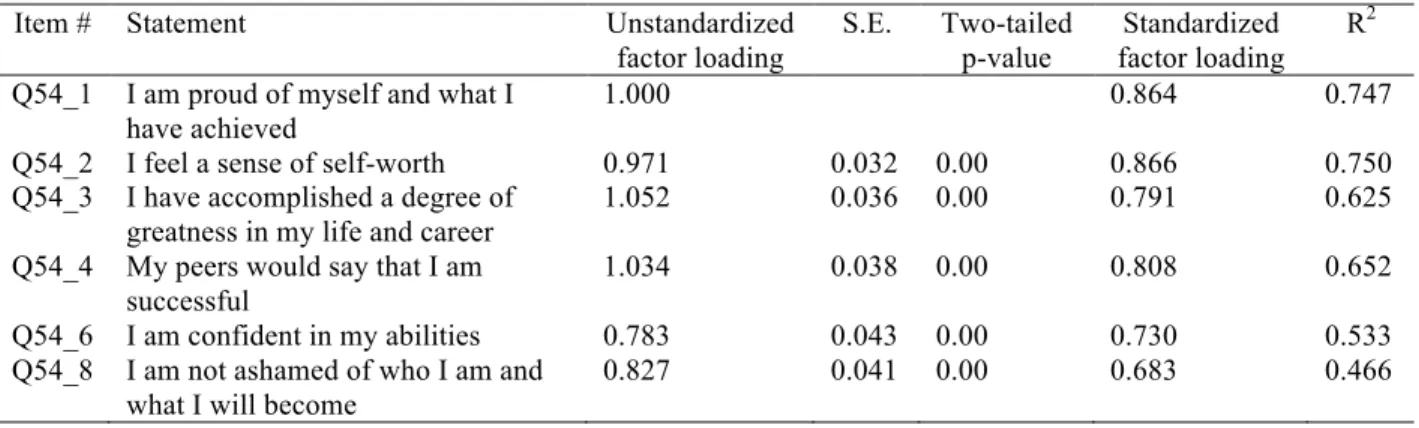
A.2. Convergent validity of general (authentic) pride
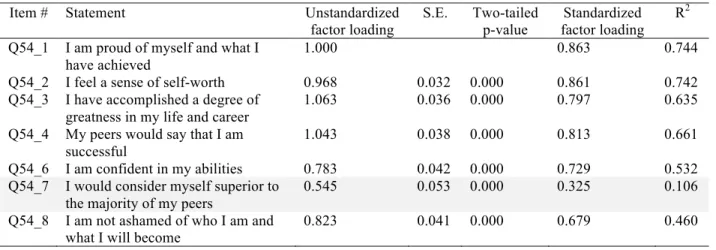
We estimate a CFA model with all 7 survey items loading onto a single factor and find that one item—“I would consider myself superior to the majority of my peers” —has a standardize factor loading of only β = 0.325, while all other items have standardized factor loadings of greater than 0.6 (see Table A4). Excluding this poorly-loading item, we estimate a 6-item measure of general pride as depicted in Figure A2. By excluding the hubristic statement related to subjective feelings of superiority in relation to others, this measure of general pride captures only the facet of authentic pride associated with genuine feelings of self-esteem and self-worth based on specific accomplishments.
Table A4. Confirmatory factor analysis results for 7 general pride items (MLR estimation)
Item # Statement Unstandardized
factor loading S.E. Two-tailed p-value Standardized factor loading R2 Q54_1 I am proud of myself and what I
have achieved
1.000 0.863 0.744
Q54_2 I feel a sense of self-worth 0.968 0.032 0.000 0.861 0.742
Q54_3 I have accomplished a degree of greatness in my life and career
1.063 0.036 0.000 0.797 0.635
Q54_4 My peers would say that I am successful
1.043 0.038 0.000 0.813 0.661
Q54_6 I am confident in my abilities 0.783 0.042 0.000 0.729 0.532
Q54_7 I would consider myself superior to the majority of my peers
0.545 0.053 0.000 0.325 0.106
Q54_8 I am not ashamed of who I am and what I will become
0.823 0.041 0.000 0.679 0.460
Note: Overidentified model fit: !!(14, N = 1,236) = 158.522, p < .01, CFI = 0.941, TLI = 0.912, RMSEA = 0.091 with 90% CI [0.078, 0.104], SRMR = 0.040.
Table A5 presents the results of the CFA estimation of the 6-item analytic model for general authentic pride depicted in Figure A2. Other than a significant chi-square test statistic due to large sample size, the model meets all criteria for reasonable model fit: !!(9, 1236) = 84.055, p <
.01, CFI = 0.963, TLI = 0.938, RMSEA = 0.082 with 90% CI [0.066, 0.098], SRMR = 0.029). Convergent validity is confirmed by standardized factor loadings of close to 0.70 or above (see Table A5). Furthermore, these six items have a Cronbach’s alpha of 0.91, demonstrating adequate internal consistency.
Table A5. Confirmatory factor analysis results for the 6 general authentic pride items
Item # Statement Unstandardized
factor loading S.E. Two-tailed p-value Standardized factor loading R2 Q54_1 I am proud of myself and what I
have achieved
1.000 0.864 0.747
Q54_2 I feel a sense of self-worth 0.971 0.032 0.00 0.866 0.750
Q54_3 I have accomplished a degree of greatness in my life and career
1.052 0.036 0.00 0.791 0.625
Q54_4 My peers would say that I am successful
1.034 0.038 0.00 0.808 0.652
Q54_6 I am confident in my abilities 0.783 0.043 0.00 0.730 0.533
Q54_8 I am not ashamed of who I am and what I will become
0.827 0.041 0.00 0.683 0.466
Figure A2. Analytic model for 6-item general authentic pride confirmatory factor analysis
A.3. Divergent validity of the car pride scale
Having established the unidimensionality, reliability, and convergent validity of our 12-item measure of car pride, we can use the additional 6-item measure of general authentic pride to explore the divergent validity of our measure of car pride. We run a CFA model of car pride and general authentic pride, simultaneously estimating the two latent constructs and allowing them to correlate (as in Figure A3).
This model demonstrates adequate model fit (!!(129, 1236) = 748.309, p < .01, CFI = 0.941,
TLI = 0.930, RMSEA = 0.062 with 90% CI [0.058, 0.066], SRMR = 0.0255). Factor loadings for the 12 car pride items and the 6 general authentic pride items are consistent with those estimated in the individual measurement models for car pride and general authentic pride presented in Tables A3 and A5, respectively. Of particular interest for discriminant validity is the correlation of car pride with general authentic pride. We find that this correlation is statistically significant, small to moderate in magnitude, and positive as expected (b = 0.345, S.E. = 0.045, p < .01, β =
0.271). This positive correlation suggests that those with higher values of general authentic pride also have higher values of pride attributed to driving or owning a car. The low magnitude of the correlation between these measures suggests that our measure of car pride, while related to general authentic pride, captures a specific association of social status and personal image with driving and using a car.
Figure A3. Analytic model for confirmatory factor analysis of the 12-item car pride and 6-item general authentic pride measures
Note: Variances of all item error terms are estimated (but not shown).
A.4. Measurement invariance of the car pride scale
Next, we analyze measurement invariance to determine whether observed differences across subsamples represent true differences in car pride or are merely indicative of item bias (an indicator functioning differently across groups). We perform a series of multigroup factor analyses (MGFA) to determine whether our car pride measure is invariant across respondents in the two cities (NYC and HOU) and those who are car-owners or non-car-owners.
For each multigroup analysis, we adopt a free baseline approach. First we estimate the car pride CFA depicted in Figure A1 allowing all estimated parameters to differ across groups. We then compare this free baseline model to that of the weak factorial invariance model (constraining factor loadings to be equal across groups) and the strong factorial invariance model (constraining both factor loadings and item intercepts to be equal across groups). We compare the overall fit of the models using a Satorra-Bentler scaled chi-square difference test with a correction factor for MLR estimation (Satorra and Bentler, 2001). A statistically significant result indicates that the
constrained (invariant) model fits significantly worse than the baseline, suggesting the presence of bias. Due to the sensitivity of chi-square difference testing to large sample sizes, we also assess changes in approximate fit indices using recommended
A.4.1. Invariance between New York City and Houston
First, we consider the invariance of our car pride scale across the two city subsamples. The chi-square difference tests suggest that the car pride scale demonstrates weak factorial invariance, but fails to hold strong factorial invariance across the two cities (see Table A6). However, constraining to strong factorial invariance across cities does not lead to substantial loss of fit according to approximate fit indices, with ΔRMSEA = 0.00 and ΔCFI = 0.01 within recommended bounds for concluding invariance. Given that the factorial invariance model meets basic recommended thresholds across all approximate fit indices, we adopt the strong factorial invariance model to enable consistent comparison of car pride across cities.
Table A6. Multigroup analysis of the invariance of the 12-item polytomous car pride scale between cities
Unconstrained MGFA Weak factorial invariance Strong factorial invariance !! value (degrees of freedom) 400.984 (98) 420.055 (109) 489.31 (120)
MLR correction factor 1.4150 1.3838 1.3466
RMSEA 0.071 0.068 0.071
CFI 0.956 0.954 0.945
TLI 0.940 0.945 0.940
SRMR 0.042 0.045 0.053
Weak invariance vs. unconstrained: !!!(11) = 12.55, p = .324, ΔRMSEA = 0.003, ΔCFI = 0.002 Strong invariance vs. unconstrained: !!!(22) = 87.86, p < .01, ΔRMSEA = 0.00, ΔCFI = 0.01 Strong invariance vs. weak invariance: !!!(11) = 79.41, p < .01, ΔRMSEA = -0.003, ΔCFI = 0.008 A.4.2. Invariance between car-owners and non-car-owners
We follow a similar multigroup analysis procedure to evaluate the invariance of our car pride measure between those respondents whose household owns one or more cars (car-owners) and those whose household does not own a car (non-car-owners). We find that the 12-item polytomous car pride scale fails to pass the chi-square difference test for both weak and strong measurement variance across car owners and non-car-owners (see Table A7). However, constraining factor loadings and item intercepts to be equal across car-owners and non-car owners (strong factorial invariance) leads to only a moderate loss of fit according to approximate fit indices, with ΔCFI = 0.012 just within the recommended threshold of 0.015 and ΔRMSEA = 0.001 well below the recommended 0.01. These results suggest that the car pride factor may behave differently across car-owners and non-car-owners. However, we accept the reduced model fit of the strong factorial invariance model as a reasonable tradeoff for comparability of car pride scores across car- owners and non-car-owners.
Table A7. Multigroup analysis of the invariance of the 12-item polytomous car pride scale between car-owners and non-car-car-owners
Unconstrained MGFA Weak factorial invariance Strong factorial invariance !! value (degrees of freedom) 424.654 (98) 465.684 (109) 523.026 (120)
MLR correction factor 1.3841 1.3357 1.3058
RMSEA 0.073 0.073 0.074
CFI 0.951 0.946 0.939
TLI 0.934 0.935 0.933
SRMR 0.043 0.052 0.055
Weak invariance vs. unconstrained: !!!(11) = 37.87, p = < .01, ΔRMSEA = 0.00, ΔCFI = 0.005 Strong invariance vs. unconstrained: !!!(22) = 99.48, p < .01, ΔRMSEA = -0.001, ΔCFI = 0.012 Strong invariance vs. weak invariance: !!!(11) = 60.38, p < .01, ΔRMSEA = -0.001, ΔCFI = 0.007
A.5. Reliability
Finally, we estimate three common reliability indicators for the 12-item polytomous car pride scale using the pooled sample of respondents from both U.S. cities. We find that the car pride scores show very good internal consistency, composite reliability, and maximal reliability, with all indices greater than 0.9 (Kline, 2016) (see Table A8).
Table A8. Reliability indices for the 12-item polytomous car pride scale in two U.S. cities
Reliability index Estimate S.E.
Cronbach’s alpha (α) 0.942 0.003
Composite reliability (Ω) 0.937 0.003