READ THESE TERMS AND CONDITIONS CAREFULLY BEFORE USING THIS WEBSITE. https://nrc-publications.canada.ca/eng/copyright
Vous avez des questions? Nous pouvons vous aider. Pour communiquer directement avec un auteur, consultez la
première page de la revue dans laquelle son article a été publié afin de trouver ses coordonnées. Si vous n’arrivez pas à les repérer, communiquez avec nous à [email protected].
Questions? Contact the NRC Publications Archive team at
[email protected]. If you wish to email the authors directly, please see the first page of the publication for their contact information.
NRC Publications Archive
Archives des publications du CNRC
This publication could be one of several versions: author’s original, accepted manuscript or the publisher’s version. / La version de cette publication peut être l’une des suivantes : la version prépublication de l’auteur, la version acceptée du manuscrit ou la version de l’éditeur.
Access and use of this website and the material on it are subject to the Terms and Conditions set forth at
Visualizer: an interactive, graphical, decision-support tool for service
life prediction for asset managers
Kyle, B. R.; Vanier, D. J.; Kosovac, B.; Froese, T. M.
https://publications-cnrc.canada.ca/fra/droits
L’accès à ce site Web et l’utilisation de son contenu sont assujettis aux conditions présentées dans le site LISEZ CES CONDITIONS ATTENTIVEMENT AVANT D’UTILISER CE SITE WEB.
NRC Publications Record / Notice d'Archives des publications de CNRC: https://nrc-publications.canada.ca/eng/view/object/?id=b30e5a38-a02d-4017-a326-08bb1b41f21c https://publications-cnrc.canada.ca/fra/voir/objet/?id=b30e5a38-a02d-4017-a326-08bb1b41f21c
Visualizer: an interactive, graphical, decision-support
tool for service life prediction for asset managers
Kyle, B.R.; Vanier, D.J.; Kosovac, B.; Froese, T.M.
A version of this paper is published in / Une version de ce document se trouve dans:
9
thInternational Conference on the Durability of Building Materials and
Components, Brisbane, Australia, Mar. 17-20, 2002, Paper 183, pp. 1-9
www.nrc.ca/irc/ircpubs
9th International Conference on Durability of Building Materials and Components Brisbane Convention & Exhibition Centre, Australia, 17–21 March 2002
Visualizer: An interactive, graphical, decision-support tool for
service life prediction for asset managers
Brian R. Kyle, Dana J. Vanier, Branka Kosovac, Thomas M. Froese
Public Works and Government Services Canada, National Research Council
Canada (NRCC), University of British Columbia (UBC), UBC
[email protected], [email protected], [email protected],
[email protected]
ABSTRACT
In the past service life prediction was performed by practitioners using subjective methods and heuristic knowledge. Although fraught with inaccuracies, these methods served industry well for a long time, to a point. Deterministic models were developed to assist practitioners calculate remaining service life; however, the results from these models are generalized and could not accurate predict the remaining service life in all individual cases. Markov chain modeling, employing actual service life data collected from field observations, has been used in specific domains, such as roofing systems service life prediction, to simulate performance deterioration. Another example of Markov chain modeling, relying on expert knowledge, has been used to simulate deterioration profiles. Case-based reasoning is yet another way to calculate the remaining service life, basing the service life prediction on cases similar to the asset in question.
Establishing the service life of assets and their components is an essential ingredient of asset management. The service life must be established both at time of installation of the asset and at any number of times during the life of that asset. For many types of assets, calculating or predicting the remaining service life is difficult, if not impossible, to accomplish. However, asset management cannot take place without knowing how long the existing asset or its components will continue to perform the intended functions. Furthermore, life cycle costs cannot be calculated without knowing the service life, and alternatives cannot be compared without knowing the life cycle costs. Moreover, maintenance optimization cannot take place without being able to compare the viable alternatives and their respective life cycle costs.
Visualizer is a prototype tool that has been developed to assist asset managers calculate the remaining service life of specific types of building assets and components. Visualizer is an interactive, graphical application that reads data from different sources and presents the accumulated data to the decision-makers in a user-friendly format. Several of the methods for service life prediction have been implemented in Visualizer and are compared in the paper. Future enhancements to Visualizer are presented and discussed.
KEYWORDS
Service Life, Asset Maintenance Management, Roofing Systems, Information Technology, Visualization.
INTRODUCTION
As organizations in the construction industry become more technologically efficient, as more companies become more information technology (IT) savvy and as data collection for condition assessment becomes more automated, there is an increasing need for IT frameworks for asset management. With the proliferation of software applications in this industry, rapid obsolesence of computer hardware in business application and the changing data protocols and operating systems in businesses today, it is now currently impossible to develop a centralized framework that can address all these concerns over extended periods of time.
The construction situation
Designers and specifiers in the construction industry attempt to put facilities in-place that provide the required levels of functionality and give some consideration to a specified design life. They must consider the relative importance of various functional and performance needs that define the project and also be aware that a system’s capability to fulfil the requirements changes over it’s the predetermined service life. The reduction of one component’s performance relative to another is non-uniform; that is, the rate of deterioration of one component is often different from that of another. While a premature loss of function of one component does not necessarily mean the end of technical service life, it may drastically reduce the economic benefit associated with having and maintaining any one given system. Design therefore should be conducted with consideration of clearly identified service lives and awareness of the affect of the in-service environment.
The construction need
To effectively operate a portfolio of diverse facilities it is essential to have a firm grasp on the asset base, to know the operational and functional requirements as well as the associated financial implications, and to monitor the in-situ performance over lengthy periods of time (Vanier 2001).
As-built, and as-modified, drawings and owner/operators’ manuals are basic to the understanding of ‘in-service’ facilities. The maintenance and inspection practices, and recording thereof, should be of consistent format to readily permit periodic re-assessment of remaining service life. Time and material tracking should be adequately detailed to permit evaluation of the relative effectiveness of maintenance options.
Facility owners and operators maintain, repair, or replace their assets based on perceived economic advantage and their strategic plans for the property. The effectiveness of any (system level) rehabilitation scenario is related to:
• the technical performance and life expectancy of the proposed system; • the expected and required service lives;
• the significance of the system to the value of the overall facility; as well as • the present value (PV) of all associated costs (ASTM E917).
Any maintenance, repair or replacement (MR&R) action should be executed only if an examination of the life-cycle economic aspects shows that action to be favourable. Technical service life assessment however is a pre-requisite to a life-cycle economic evaluation.
As can be seen, these is a plethora of data required to make sophisticated decisions about any one assets and the problem is multiplied exponentially with hundreds of diverse assets. How can asset managers of diverse asset unify their existing data, supplement then with corporate knowledge, and then use them to make productive, cost efficient and effective decisions about MR&R?
The proposed solution
This paper proposes schemas and frameworks for storing, updating and accessing the large volumes of heterogeneous data in the construction field. It also proposes a prototype tool, Visualizer, to use this information for decision support. This interactive, graphical application reads data from different sources and presents the accumulated information to the decision-makers in a user-friendly graphical format. Several methods for service life prediction have been implemented in Visualizer and are compared in the paper. An summary of the entrie BELCAM project is included in a related paper in this conference (Kyle et al 2002).
THE INFORMATION DILEMMA
If one were to step back from immediate organizational challenges and take a detailed look at an overview of the existing and required information for making decision about MR&R, it reveals a whole spectrum of diverse formats and many different levels of detail in any of the existing data sets. The heterogeneity of data, which puts additional requirements on information management systems, can be observed in terms of the structure of machine-readable data representations.
Heterogeneity of data in the asset management domain
It is possible to distinguish three basic, although not always clearly distinct, categories of information: (1) Unstructured information encompasses unstructured or barely structured text (e.g. ASCII, tab
delimited and a variety of “non-text” information such as bitmap images, video, audio). Its content is meaningful to humans but not to machines, which can only read and handle such data at the low level of pixels or simple strings or as complete, fixed documents and display it in a single, fixed way. In fact, much of this type of data is still in hardcopy format and in a medium other than digital (e.g. photos, slides, or analogue tape).
(2) Information with structured display includes a variety of primarily textual information such as web pages, structured word-processor documents, or user queries, which are structured according to the HTML specification, a document model (data type definition or DTD), or a particular query syntax. The same category also includes some primarily visual information, for example CAD databases whose underlying schemas involve entities such as lines and shapes but not objects such as doors, columns and roofs. Different displays of such information are possible (e.g. using Cascading Style Sheets for HTML documents or changing layer settings in CADD drawings), but they involve only alternative display properties such as colours, fonts, or line types.
(3) Information with structured content implies machine-readable representation structured according to a certain conceptual schema of a domain (e.g. “smart” CAD drawings, some eXtensible Markup Language or XML documents, and databases). A multitude of essentially different human understandable representations can be derived from a single data set: a schematic 2D drawing, rendered 3D model, process simulation, or textual report, for example. These alternative displays can differ not only in display properties but also in modality (i.e. text vs. graphics vs. audio).
Current standardization efforts
As in many other domains, the need to minimize data re-entry and to enable horizontal and vertical interoperability has led to the adoption of product modeling and to an industry-wide initiative for the development of a standard domain model. Building upon the more general ISO STandard for the Exchange of Product Model Data (STEP ISO 10303), the Industry Alliance for Interoperability (IAI
2000) is bringing together key industry participants from all around the globe. IAI is developing a standard schema for the architecture, engineering, construction and facilities management (AEC/FM) industries—the Industry Foundation Classes.An increasing number of software applications already feature IFC support: those developed by Nemetschek, Viatek Oy, Jidea Oy, and NAOKI among asset management software and numerous applications typically used in pre-operational phases. A list of IFC implementers is available at the IAI Nordic Chapter Web site (IAI Nordic 2000).
Another associated standardization effort— aecXML™ is focusing on data exchange over the Internet (aecXML 2000). The AEC/FM industries have acknowledged the importance of Internet-based communication for a domain relying on information from disparate sources and the potential of the eXtensible Markup Language (XML) standard (XML 2000). AecXML™ represents a framework for using XML for electronic communications in the domain.
Advantages and limitations of standard data models
The use of a standard data model enables communication between diverse applications as well as re-use of data entered by any participant in any phase of an asset’s service life; thus ensuring data consistency and heightening reproducibility of analysis and assessment results.
However, it is becoming increasingly clear that the use of a standard data model is not an omnipotent solution for interoperability. Amor (2000) gives an overview of unresolved issues related to their implementation, some of which may be intractable. For example,along with dozens of practical and technical issues such as those related to business interests of information providers, data transport mechanisms, version management etc., there are potentially more serious conceptual questions related to sufficiency, validity and comprehensiveness of data models and mapping between different views. The work described in this Visualizer paper focuses only on those issues related to heterogeneous information representations.
Even if a model is accepted as an industry-wide standard, there will always be sub-domains, related domains, and applications that are better served by schemas with partly overlapping scopes and structures of their own. In addition to project-generated information discussed in Section 2, data required for the day-to-day operations of asset managers also include a variety of external data such as libraries and regulations as well as the company’s business information (e.g. personnel files, accounting data). It is possible to distinguish three partially overlapping information spaces:
• global information space; • project information space; and • company information space.
An important difference between these three spaces is the possible level of control and management of the information contained. While the company information space can be fully controlled (i.e. theoretically all information can be structured in a standard way and be fully interchangeable), the global information space is driven by a variety of unpredictable free market forces and is hardly submissive to a single schema. This is also reflected in the project information space where it can be difficult to bring together all participants in a project using compatible systems and data representations. Therefore any information system planning in a domain such as asset management should take into account the unavoidable coexistence of multiple schemas, of multiple views within a single schema, of structured, differently structured, and unstructured information, and of document-based and model-based communication.
On the other hand, the use of standard data models has a potential to change applications based on them, to enable qualitatively new types of applications, and thus to change work practices in the domain. A variety of fully interchangeable data in a populated and shared project model or in company’s archives can be used in new combinations, to be analyzed, compared, manipulated to give new insights and generate knowledge. These opportunities have not been sufficiently explored yet, most likely because of the early stages of IFCs implementation and the lack of populated models.
PROPOSED FRAMEWORK FOR DATA MANAGEMENT IN ASSET MANAGEMENT
The development of the framework for data management in the asset management domain starts from the assumption that Internet-based communication, distributed systems, and efforts on the development of IFCs and XML will continue into the foreseeable future. A proposed framework is presented here through a description and analysis of a prototype tool developed to demonstrate, test, and further explore the use and display of data for decision support tools for asset management. The goal of the work is to define a user-centered information architecture for asset management and hence the presentation layer represents the focus and the starting point.
Visualizer
Visualizer was developed within the Building Envelope Life Cycle Asset Management (BELCAM, 2001) project , a joint endeavour of the National Research Council Canada (NRCC), Public Works and Government Services Canada (PWGSC) and a number of North American partners, including the University of British Columbia (UBC). BELCAM was a three-year research and development project to investigate the integration of asset management technologies, namely: maintenance management, life cycle economics, service life prediction, and risk analysis. For the initial stage of BELCAM, work concentrated on “low slope” roofing systems as a “proof of concept” and therefore the prototype application operates only with data related to low slope roofs. NRCC, PWGSC, and UBC all contributed to the development of Visualizer.
Visualizer is a prototype application that allows a user to ask relevent questions concerning their assets and to view the answers interactively. Visualizer is implemented in Visual Basic for Applications (VBA) in Microsoft Excel and uses Microsoft’s Automation for integrating data entered and generated within different applications.
The business layer of Visualizer consists of formulae for the probabilistic prediction of asset performance, the assessment of risk and cost, and procedures for the multi-objective optimization of maintenance activities (Lounis et al 2000, Kyle et al 2002a). Data required for Visualizer to function include:
• visual representation (map) of the inventory,
• stored data about the inventory (mostly alphanumerical), • external data (e.g. current maintenance costs), and • user input.
Data entry and data display
The user interacts with the tool according to the following scenario:
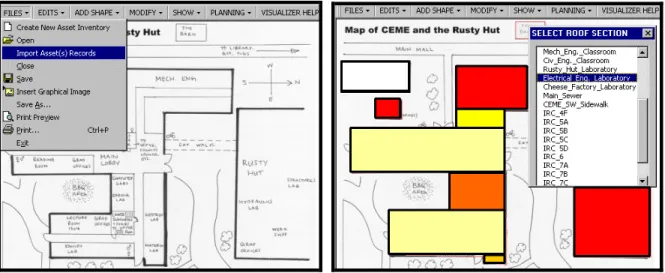
1. “FILES Menu”:The user either imports a drawing (FILES/INSERT GRAPHICAL IMAGE) of the building from any drawing software supporting Automation or creates a building outline in Visualizer using MS Office AutoShapes. The images can even be imported raster maps (BMP,
GIF, JPG, etc.), as shown by the building shapes in Fig. 1. Precise spatial information, that is—the exact location of buildings, is not vital for the application as these maps serve only for visualization purposes and relative positioning and therefore only simple rough sketches need be used. The user imports required data (FILES/INSERT GRAPHICAL IMAGE) about the buildings, roofs, and roof sections from MicroROOFER (or potentially any other correspondingly structured database). MicroROOFER (2000) is an EMS for low-slope roofing systems from the US Army Corps of Engineers (Bailey et al, 1989) running under MS Access.
Figure 1. Import option for images and files. Figure 2. Linking database records to graphics
2. “ADD SHAPE Menu”:The user can then draw polylines or rectangles representing discrete roof sections on the image (see thedark rectangle in top left corner of Fig. 2). A wide selection of shapes are available to the user.
3. “MODIFY Menu”: This option allows the user to link the polyline shapes with the roof sections from the corresponding database record. The available pick list from the database records are displayed in the dialogue box on the right of Fig. 2. This menu options also permits rotating of shapes and the editing of the end points of the polyline shapes.
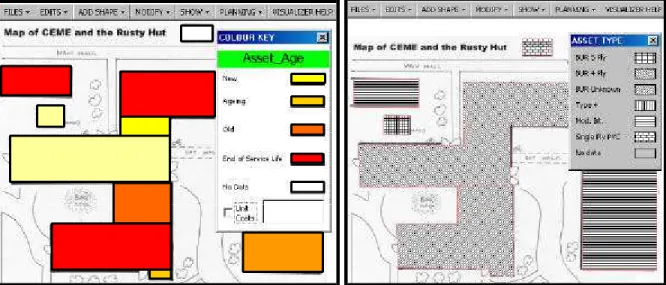
4. “SHOW Menu”: After these actions are completed, all data from the dataset can be visualized, i.e. properties of an object can be translated into the graphical language and represented as properties (colour, hatching pattern, etc.) of that object’s surrogate (i.e. shape). Figure 3 displays the age of the roofing assets (shades of gray are displayed in this figure to represent the Visualizer colours of “red” for “End of Service Life” and “yellow” for “New”). Hatching patterns can be used for any discrete data; the patterns for different types of roofing membranes are illustrated in Fig. 4, but it could also be used to represent types of assets, building category codes, etc.
Figure 3. Graphical display of continuous data. Figure 4. Graphical display of discrete data.
5. "SHOW Menu": Figure 5 displays possibilities for the display of data available from other potential datasets. For example, data about the "Six Whats" of asset management (Vanier 2001) are easily displayed: "What is it Worth [Value]", " What is the Deferred Maintenance", or "What is the Condition". Figure 6 displays tombstone data retrieved from the MicroROOFER dataset.
Figure 5. Data display options. Figure 6. Tombstone MicroROOFER data.
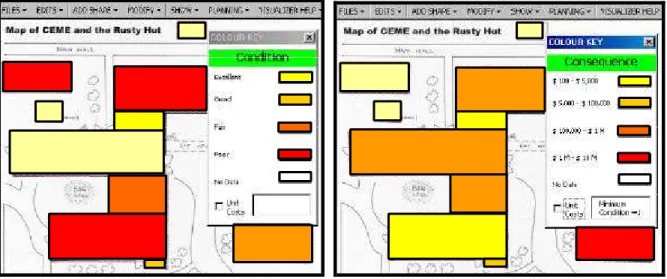
6. “SHOW Menu": In addition to displaying data representing the existing condition as shown in Fig. 7, the application also can display application-generated data such as consequence of failure, as shown in Fig. 8. Please notice the differences between Figs. 7 and 8 where one asset may be in poor condition but can have a low consequence of failure (roof at top left of images) and visa versa (buildings at top left of images).
Figure 7. Display of condition data. Figure 8. Display of consequence data.
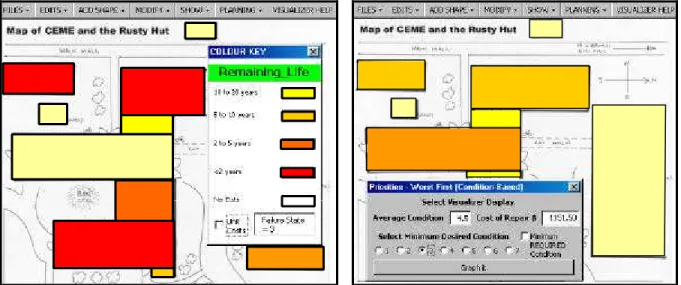
7. "SHOW Menu": Individual managers can have different priorities when it comes selecting projects for MR&R. For example, some might be risk-averse; others can be cost-conscious, or some might be performance-oriented. As a result, these asset managers' decisions are based on their personal objectives and agendae. Access to accurate and objective data, as discussed in this paper, provides new opportunties to visualize an objective facet of maintenance priorities. Figures 9 and 10 demonstrate the possibility of showing maintenance priorities using a simplified weighting of the established objectives in the decision support system described in this paper, namely condition, cost and consequence. Figure 9 presents the priorities of someone who is only considering the condition of the assets; whereas Fig. 10 reflects the "what-if" scenario for a manager who is the equating cost and consequence, but is not considering the consequences, only the conditions and costs. As can be seen in Figs. 9 and 10, the priorities will change when the weights on the
objectives are changed. Figures 9 and 10 do not show absolute values but provide the use with the relative priorities of MR&R for different roof sections.
Figure 9. Condition = cost = consequence. Figure 10. Condition = cost, consequence = 0. Service life models
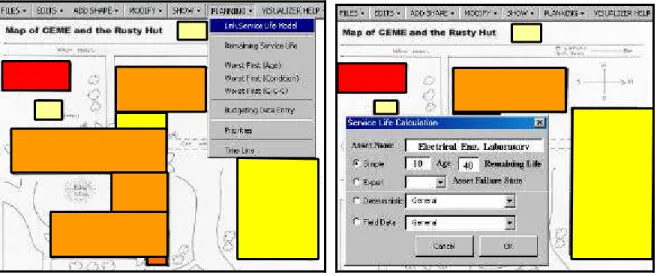
Visualizer allows the user to link deterioration models to the displayed graphics, as shown in Fig. 11 (PLANNING/LINK SERVICE LIFE MODEL). Currently the four different possibilities for low slope
roofing systems are: Simple, Expert, Deterministic and Field Data. The asset can be linked to a specific service life model to enable calculation of the remaining service life. Fig. 12 shows a Simple Model linked to an asset; the user also inputs the age of the asset and its estimated remaining life.
Figure 11. Planning models. Figure 12. Linking service life model.
Simple: For this projection, the age of the asset is calculated from data provided (i.e. date of construction or the date that the roof was replaced); the user can override this and can input a number for the remaining service life. This interface is displayed in Fig. 12. The condition of the roof in any future year will be directly proportional to the remaining service life at that time (straight-line deterioration).
Expert: In the Expert Planning Model, the user must select the “Asset Failure State” as shown in the dialogue box in Fig. 12. The condition of the roof in any future year will be proportional to the remaining service life at that time (exponential deterioration).
Determistic: In the Determistic Planning Model, the user can select the models for deterioration used in the original MicroROOFER software.
Field Data: In the Field Data Planning Model, the user can select the deterioration model developed using the Markov Chain described in the associate paper (Kyle et al 2002).
Remaining service life
After the service life models have been linked to the assets, as shown in Fig. 11, the remaining service life can be calculated and displayed (PLANNING/REMAINING SERVICE LIFE). Figure 13 displays the results of the calculations from the service life models.
Planning Models
Figure 14 displays one of the planning models currently implemented. In this image the “Worst First” option has been selected (PLANNING/WORST FIRST from Fig. 11). In this option, all the roof assets that have a condition rating of less than 3 (as selected in the Fig. 13 dialogue box) are raised to Condition State 3 (Kyle et al 2002) and the cost of MR&R are calculated.
Figure 13. Display remaining service life. Figure 14. “Worst first” planning model.
DISCUSSION
In this section observations made during the development and testing of Visualizer are discussed, particularly in the light of the previously stated assumptions about the future of data communication in the domain of asset management. These observations were not scientifically tested, measured, and verified at this stage but should serve as starting guidelines for the future research and development.
General observations
• Visualization of natively non-visual data for large asset inventories can be a highly useful cognitive aid for grasping the overwhelming amount of information required for decision making in asset management.
• Visualization tools can easily be developed where conceptually structured information is available. Data internally represented in terms of objects or entities defined by sets of attributes or properties and their values can always be displayed in a variety of ways with entity surrogates
(representations) and their attributes serving as carriers of information about the entities. • Basic visualization and analysis techniques have already been developed within GIS and these
types of visualization should be extracted, adapted and incorporated into asset management tools.
Implementation
Visualization or display translation can be implemented as a service that can form part of many diverse applications, on both clients and data servers (Froese et al. 2000). Along with information about objects, their properties and property values, the data layer needs to expose information about data type and data range for each of the properties, while the presentation layer needs to make available information about its expressive vocabulary, as shown in Figure 7. This vocabulary need not be limited to colours and hatching patterns, not even to graphic properties; it can also involve time, speed, loudness, or pitch, for example. Upon the availability of this data, a thesaurus service can perform mapping with any desired level of user intervention and generate an alternative display along with the legend (Kosovac et al, 2000). Such a service can function no matter how close or remote the two layers are, as long as communication between them is ensured.
Opportunities
An important feature of information management tools is the ability to work at a varying level of detail; this is one of the most important techniques in GIS, usually called—generalization. As a domain schema identifies generic and hierarchical relationships between concepts it can be used as a possible tool for facilitating navigation between different levels of detail.
Another GIS technique—information overlay, which is crucial for exploration of interdependencies between data, can also benefit from model-based exchange. The ability to combine and overlay properties from disparate sources depends on the availability of such data in the common format. Visualizer was easy to implement thanks to the power of Microsoft’s Automation. However, most pieces of data required several translations—in addition to translation between different modes (alphanumerical to graphic), one human-readable text string often needed a translation for each
application (e.g. elimination of white spaces or particular special characters). This requirement coupled with the need to enable navigation between different levels of detail resulted in a number of mapping tables and lines of code that might be avoided with the use of standard data models.
The weakest point in the application is the need to associate shapes with database records—it requires user’s effort and the need for solutions related to data updating and consistency. This need can be eliminated in model-based systems or by using integrated CAD databases.
Model-based systems also allow generically different representations of entities themselves (e.g. 3D models or a variety of symbolic representations) thereby providing a richer vocabulary for translations.
Desired enhancements
A useful additional feature, actually vital for decision-making in asset management, is the possibility to relate/link external, unstructured and differently structured information from a variety of sources, such as the World Wide Web to project-generated information. For example, linking infrared images of roofs with a library of typical roofing defects, or to manufacturers’ information about products. A possible tool for this task would be a domain schema enriched by synonyms. This solution has implications for all storage, retrieval, and display of data and requires a separate, although related line of research (Kosovac et al 2000).
Implications for further research
One of the goals of the research is to develop a graphical user interface that would allow direct interaction with all project-related information. At the same time, the interface would have to:
• Maximize access to data, • Optimize display, and
• Minimize storage space, more precisely, repetition of same information and the accompanying risk for errors and inconsistencies.
Further steps towards attaining this goal are as follows:
• re-examination of the data that should be archived, referenced, or discarded at the commissioning of a facility in an Internet-based, distributed environment;
• supporting and/or contribution to the further development, implementation, and acceptance of the IFCs, aecXML, XML, and related standards;
• development of thesaurus-like aids based on the domain model, organized into facets, and enriched with equivalency relationships (synonyms, symbols, and other alternative representations);
• investigating the potential of the aids and services for both enhancing information retrieval and facilitating translation into alternative displays; and
• implementing the aids and services transparently in user interfaces allowing alternative access structures to project information including but not limited to a 3D geometric representation of the facility.
CONCLUSIONS
Standardized domain models are undoubtedly a rudimentary answer to the efficient data management in an information-wise complex domain such as asset management. However, these models should be developed, advocated, and used with the awareness that no schema can cover an entire domain in full detail, or from each and every viewpoint, and that there will always be data and processes that are not submissible to it. On the other hand, standard models should be considered not only as tools to enhance existing systems but also as an opportunity to redefine data use in the domain.
The authors believe that thesaurus-like aids and translation services can be used both as a possible remedy for the inherent deficiencies of standard models by allowing association of related unstructured and differently structured information to a project model and as a means to exploit the potential of populated project models by allowing qualitatively new combinations and views of data (Kosovac et al 2000).
The paper has examined the visualization techniques available and demonstrates how asset managers may use Visualizer to compare, and "see", the impacts that different service life prediction methods will have upon their asset management plans. Addition research is continuing in this area (NSERC 2001). The paper stresses the importance of formalized information storage, updating and integration in the domain of “Service Life Asset Management”. The key aspects of information storage and flow in this domain, identified in this paper, are: (1) the data needs for decision support tools, (2) the development of quality metrics for evaluation of performance and condition; (3) the need for standardization of data and information flow, and (4) the need for continuous data transfer amongst actors in the process. The authors also identify the need for continued research and standardization in all these domains. This paper is exploratory in nature and encourages the reader to visualize what data are required for “Service Life Asset Management” and how those data can be used.
REFERENCES
aecXML. 2000, aecXML Home Page, <www.aecxml.org/index2.htm> (3 Oct. 2000).
Amor, R. 2000, "Integrating Construction Information: An Old Challenge Made New", Construction Information Technology 2000, Proceedings of CIT 2000 - The CIB-W78, IABSE, EG-SEA-AI International Conference on Construction Information Technology, Reykjavik, Iceland, 28-30 June, 2000, G. Gudnason (Ed.), Icelandic Building Research Institute. Vol. 1, pp. 11-20.
ASTM E917. 1994, 'Standard Practice for Measuring Life-Cycle Costs of Buildings and Building Systems', American Society for Testing and Materials, Philadelphia Pa.
Bailey, D.M., Brotherson, D.E., Tobiasson, W. & Knehans, A. 1989, ROOFER: An Engineered Management System for Bituminous Built-Up Roofs, Technical Report M-90/04/ ADA218529, US Army Construction Engineering Research Laboratory, Champaign, Ill.
BELCAM. 2001, BELCAM Website <http://www.nrc.ca/irc/uir/belcam> (19 Sept. 2001).
Froese, T., Yu, K. Liston, K. & Fischer, M. 2000, "System Architectures For AEC Interoperability", Construction Information Technology 2000, Proceedings of CIT 2000 - The CIB-W78, IABSE, EG-SEA-AI International Conference on Construction Information Technology, Reykjavik,
Iceland, 28-30 June, 2000, G. Gudnason (Ed.), Icelandic Building Research Institute. Vol. 1, pp. 362-373.
IAI. 2001, International Alliance for Interoperability Website, <http://iaiweb.lbl.gov/> (19 Sept. 2001). IAI Nordic. 2000, IAI Nordic Implementation <cic.vtt.fi/niai/implementation.
Kosovac, B., Froese, T.M. & Vanier, D.J. 2000, "Integrating Heterogeneous Data Representations In Model-Based AEC/FM Systems", Construction Information Technology 2000, Proceedings of CIT 2000 - The CIB-W78, IABSE, EG-SEA-AI International Conference on Construction Information Technology, Reykjavik, Iceland, 28-30 June, 2000, G. Gudnason (Ed.), Icelandic Building Research Institute. Vol. 2, pp 556-567.
Kyle, B.R., Vanier, D.J., & Lounis, Z. 2002, ‘The BELCAM Project: A Summary of Three Years of Research in Service Life Prediction and Information Technology’, Submitted To Proc. 9th International Conference on Durability of Building Materials and Components, Brisbane Convention & Exhibition Centre, Australia, 17-20 March.
Kyle, B.R., Vanier, D.J., & Lounis, Z. 2002a, ‘Multi-Objective Optimization of Asset Maintenance Management, Submitted to 9th International Conference on Computing in Civil and Building Engineering, <http://www.caece.net/~icccbe/working.htm>, Taiwan, 3-5 April, 2002
Lounis, Z., & Vanier, D.J. 2000, 'A Multiobjective and Stochastic System for Building Maintenance Management', Journal of Computer-Aided Civil and Infrastructure Engineering, 15(5), Sept, pp. 320-329.
MicroROOFER. 2001, MicroROOFER Software, US Army Corps of Engineers, Civil Engineering Research Laboratories, Champaign, IL, Software supported by University of Illinois at Urbana-Champaign, <http://www.conted.uiuc.edu/techctr/roofer/> (19 Sept. 2001).
NSERC. 2001, <http://www.nserc.ca////////news/2000/p000905.htm> and <http://www.ost.qc.ca/ CRSNG/asp/projdetail.asp?Cle=155214> The value of the grants shown on these web pages is for the first year of the $619K, three-year project (19 Sept. 2001).
STEP. 2001, Standard for the Exchange of Product Model Data, <http://www.nist.gov/sc4/www/ stepdocs.htm> (19 Sept. 2001).
Vanier, D.J. 2001, 'Why Industry Needs Asset Management Tools', Journal of Computing in Civil Engineering, 15(1), pp. 35-43.