Publisher’s version / Version de l'éditeur:
Applied Spectroscopy, 50, 6, pp. 774-780, 1996
READ THESE TERMS AND CONDITIONS CAREFULLY BEFORE USING THIS WEBSITE.
https://nrc-publications.canada.ca/eng/copyright
Vous avez des questions? Nous pouvons vous aider. Pour communiquer directement avec un auteur, consultez la première page de la revue dans laquelle son article a été publié afin de trouver ses coordonnées. Si vous n’arrivez pas à les repérer, communiquez avec nous à PublicationsArchive-ArchivesPublications@nrc-cnrc.gc.ca.
Questions? Contact the NRC Publications Archive team at
PublicationsArchive-ArchivesPublications@nrc-cnrc.gc.ca. If you wish to email the authors directly, please see the first page of the publication for their contact information.
NRC Publications Archive
Archives des publications du CNRC
This publication could be one of several versions: author’s original, accepted manuscript or the publisher’s version. / La version de cette publication peut être l’une des suivantes : la version prépublication de l’auteur, la version acceptée du manuscrit ou la version de l’éditeur.
Access and use of this website and the material on it are subject to the Terms and Conditions set forth at
New approach to quantitative analysis of two-component polymer
systems by infrared spectroscopy
Cole, K. C.; Thomas, Y.; Pellerin, E.; Dumoulin, M. M.; Paroli, R. M.
https://publications-cnrc.canada.ca/fra/droits
L’accès à ce site Web et l’utilisation de son contenu sont assujettis aux conditions présentées dans le site LISEZ CES CONDITIONS ATTENTIVEMENT AVANT D’UTILISER CE SITE WEB.
NRC Publications Record / Notice d'Archives des publications de CNRC:
https://nrc-publications.canada.ca/eng/view/object/?id=c6274324-ce6c-429e-be59-f7e89f7c5246 https://publications-cnrc.canada.ca/fra/voir/objet/?id=c6274324-ce6c-429e-be59-f7e89f7c5246http://www.nrc-cnrc.gc.ca/irc
N e w a pproa c h t o qua nt it a t ive a na lysis of t w o-c om pone nt polym e r
syst e m s by infra re d spe c t rosc opy
N R C C - 3 8 8 2 0
C o l e , K . C . ; T h o m a s , Y . ; P e l l e r i n , E . ; D u m o u l i n ,
M . M . ; P a r o l i , R . M .
J a n u a r y 1 9 9 6
A version of this document is published in / Une version de ce document se trouve dans:
Applied Spectroscopy, 50, (6), pp. 774-780, 1996
The material in this document is covered by the provisions of the Copyright Act, by Canadian laws, policies, regulations and international agreements. Such provisions serve to identify the information source and, in specific instances, to prohibit reproduction of materials without written permission. For more information visit http://laws.justice.gc.ca/en/showtdm/cs/C-42
Les renseignements dans ce document sont protégés par la Loi sur le droit d'auteur, par les lois, les politiques et les règlements du Canada et des accords internationaux. Ces dispositions permettent d'identifier la source de l'information et, dans certains cas, d'interdire la copie de documents sans permission écrite. Pour obtenir de plus amples renseignements : http://lois.justice.gc.ca/fr/showtdm/cs/C-42
New Approach to Quantitative Analysis of Two-Component
Polymer Systems by Infrared Spectroscopy
K. C. COLE,' Y. THOMAS, E. PELLERIN, M. M. DUMOULIN, and R. M. PAROLI
National Research Council Canada, Industrial Materials Institute, 75De Mortagne Blvd., Boucherville, Quebec J4B 6Y4, Canada (KCC., Y.T" E.P., M.M.D.); and Institute for Research in Construction, Ottawa, Ontario KiA OR6, Canada (R.M.P.)
A new treatment is proposed for quantitative analysis of two-com-ponent polymer systems by infrared spectroscopy. Like much pre-vious work, itis based on a ratio involving two peaks in the same spectrum. The relationship between such a ratio and the concen-tration of a given polymer is inherently nonlinear.Itis shown that this nonlinearity can be well described by a simple equation derived from the laws of optical transmission. This equation has the form Xl= m1+mzR/(l +ュセIL whereXlis the weight fraction of polymer 1, the miare adjustable coefficients, and the ratio R is equal to Aj(Au
+Ab ). The quantitiesAnandAbare the absorbances (peak heights
or areas) at two frequencies a and b of which the first is associated mainly with polymer 1 and the second with polymer 2. This equa-tion has been applied to various peak combinaequa-tions in spectra of miscible blends of poly(phenylene ether) with polystyrene (both mid-IR and near-IR data) and immiscible blends. of polypropylene with polyethylene (mid-IR data). Itis shown that the equationis valid in all cases, covering the full concentration range from 0 to 100% even when the peaks used for the analysis involve absorption by both polymers. Itis therefore believed to be of broad general usefulness for the analysis of polymer blends and copolymers. Index Headings: Quantitative analysis; Polymer blends; Infrared spectroscopy; FT-IR; Polyethylene; Polypropy)ene; Poly(phenylene ether); Polystyrene.
INTRODUCTION
In working with polymer blends or copolymers, it is often necessary to verify the composition of a two-com-ponent system, Infrared (IR) transmission spectroscopy has long been used for this purpose, sometimes in an on-line setting but generally as a laboratory technique. How-ever, recent developments have opened up new possibil-ities for IR spectroscopy as an on-line technique, and we have undertaken work to study the application of near-infrared transmission spectroscopy to the extrusion of polymer blends.' In the course of this work, it became necessary to verify the composition of a number of sam-ples by a more conventional technique, namely, trans-mission of thin cast films in the mid-infrared. This re-quirement prompted a re-examination of the method used to analyze the data and led to the development of a sim-ple but nonlinear equation that has several advantages over those commonly used. The purpose of this paper is to describe this equation and demonstrate its successful application in different situations.
The basis of all quantitative analysis by transmission of infrared radiation is the relationship developed by Bouguer, Lambert, and Beer, which states that for a
mix-ture ofn components:
"
A(v)
=
-log T(v)=
セ Ki(v)'Ci ·f (I)i=1
where v is the frequency of the radiation; A(v) is the
absorbance of the sample; T(v) is the transmittance of the
sample (defined as the ratio of the transmitted energy
with respect to the incident energy, I1Io); Ki(v) is the
in-trinsic absorptivity of component i; Ci is the
concentra-tion of component i; and f is the sample thickness. The
simple proportionality between absorbance and concen-tration is the cornerstone of infrared quantitative analysis. However, in its application it must be remembered that the concentration ought to be expressed in units that de-fine the number of absorbing species (atomic groups) per unit volume. For simple compounds with a clearly de-fined molecular weight, it is convenient to express the concentration in moles per liter. For a material like a polymer, consisting of a mixture of molecules with vary-ing weight and number of absorbvary-ing units, it is better to express the concentration in terms of mass per unit vol-ume. This distinction is based on the reasonable assump-tion that the number of absorbing species per unit mass is a constant. For a pure polymer, the concentration would correspond to the density, which is the reciprocal of the
specific volume, V,.
For a two-component polymer mixture, the composi-tion is usually expressed in terms of the weight fraccomposi-tion
X, of one of the polymers, the fraction of the other being
X, = I - Xl' (The concentration of polymer I may also
be expressed in weight percent, equal to 100 X,.)
Con-sider a mixture of Xl g of polymer I and X, g of polymer 2. The total weight is I g, and the total volume is
there-fore V,m' the specific volume of the mixture incm3/g. The
respective concentrations of polymers I and 2, in
appro-priate units ofg/cm" are thereforeX/V,m andX,IV,m'
Sub-stituting into Eq. I gives:
- KI(v)X,
+
K,(v)X, (2)A(v) = ·f.
V,m
If there is no change of volume on mixing, the specific
volume of the mixture will be given by V,m = V"X,
+
V"X,. In reality, however, interaction between the
poly-mers will cause a change in volume, usually a reduction but in some cases an increase. For example, in the case of polystyrene and poly(phenylene ether), the volume of a 50:50 mixture is about 0.75% lower than that expected on a simple additive basis" The effect of the interaction can be described to a first-order approximation in terms
of a factor
f:
Received 6 November 1995; accepted toFebmary 1996.
*Author to whom correspondence should be sent.
Vsm
=
vZセixi+
Vs2X2+
fx.1X2·Substituting in Eq. 2 and replacingX, by I
(3)
Xl leadsto
where the subscripts a and b designate the two specific frequencies chosen. Unfortunately, this expression is still nonlinear with respect toXl except for the fortuitous case where K 'b = K'b' There have been different approaches to dealing with this problem. One is to find a peakb that arises only from polymer 2, in which caseK lb = 0 and Eq. 5 becomes (7) (9) (8) 1. m,R
+
m,R K"+
K'b+
(K "+
K lb - K" - K'b)XIAlthough this relationship is nonlinear, it is relatively simple and does not involve the sample thickness, the
volume mixing interaction, or the polymer densities. As
a result of the current widespread availability of personal computers and software to perform nonlinear regression, the requirement of linearity is less critical than in the past. Since the ultimate objective is to calculate XI from the measuredR, Eq. 7 is inverted and expressed in the con-venient form where and K'b m,
+
ml(l+
m3) - = . KIa 1 - m1 KZb - K1b m3 = Kia - K2nThe relationship is linear only for the fortuitous case wherem3 = O. Otherwise, the coefficientsmi. m 2,andm3
can be determined by nonlinear regression on data ob-tained from a set of calibration samples. The equation can then be used to determine the composition of any blend. If concentrations are expressed in percent, XI is simply multiplied by 100. Also, if desired, the
coeffi-cients mI' m2 • and m3 can be used to calculate the ratios
of absorptivities according to
centrations. Such is the case, for example, for the ratio
Alm/A1351 in styrene-isobutylene copolymer,' and for
A1I9o1A,oo and A1030/A,oo in mixtures of poly(phenylene
ether) and polystyrene.' While this approach works in certain cases, it has no theoretical basis, and taking the logarithm simply masks the nonlinearity.
The approach used in this work is based on the ratio of peaks but avoids the problems mentioned above. First, instead of the simple ratio A)Ab , we use the ratio R =
Ai(A,
+
A b). This ratio has the advantage of beingcon-fined to the range of 0 to 1, the same range as X,, Second, we consider the general case where the peaks a and bare not pure. This leads to the following equation:
R = A,
A"
+
AbKlb 1
+
m31 - (10)
K'b m,
+
ml(l+
m,)The rest of the paper is devoted to demonstrating the general application of Eq. 8 for the analysis of two-com-ponent polymer blends.
Data are reported for two different polymer blends: poly(phenylene ether) with polystyrene (PPEIPS) and EXPERIMENTAL (5) (6) K,.
+
(Kh - K,,)XI K'b+
(Klb - K2b)XI Aa K1aXI+
K1aX2 A b KlbXI+
K2bX, A(v)=
K,(v)+
[K,(v) - K,(v)]XI .t. (4)V"
+
[V'I - V"+
f]XI - IXTAn important point arising from this equation is that the ahsorbance is not normally a linear function of XI' It
will be linear only if the following two conditions are satisfied: (1) there is no specific interaction between the polymers (f = 0), and (2) the two polymers have the same density (V'I = V,,). It can be shown that if only the .,fjrst condition is satisfied, then the absorbance is linear with respect to the volume fraction of polymer 1 rather
than the weight fraction. However, this observation is of
;little use for practical purposes because often the density of the polymers is not known precisely and the impor-tance of the interaction correction is not known.
Further-more, volume fraction is a rather nebulous concept in the case of copolymers. It is much simpler to express the
blend or copolymer composition in terms of weight
frac-tion or mole fracfrac-tion.
This nonlinearity means that the classical relationship
A <X Xcannot be applied, except as an approximation for which the validity must be tested. More sophisticated sta-tistical methods like PLS (partial least-squares) can deal with the nonlinearity, but their application requires that the thickness of the samples used for calibration be pre-cisely known. For polymer films, the thickness usually
varies from one specimen to another and is difficult to
measure accurately. A well-known way of overcoming this problem is to take the ratio of the absorbances of two peaks in the same spectrum, the first (at a frequency which we designate as a) arising mainly from polymer
1, and the second (at frequency b) arising mainly from polymer 2. When the ratio is taken, the thickness t and the specific volume V,m in Eq. 2cancel out because they are independent of frequency. The result is
Aa = K1a
+
Kla.XlAb K1h KZb Xl'
, In this case the ratioA)Abis a linear function ofX/X, =
t'x/(l - Xl)' An example of the successful application of this approach is the use of the peaks at 691 and 1738
pm-I to analyze copolymers of vinyl chloride and vinyl
セ」・エ。エ・NG As a general method, however, it suffers from two main problems. First, it is often difficult to find "pure" peaks in the mixture spectrum. Second, if the mixtures analyzed include some with high values ofXl'
the denominators become quite small with respect to the numerators, and this condition produces large values for the ratios along with large associated errors.
Some workers have found that although a plot of A)Ab
against X, is nonlinear, a plot of log (A)Ab ) against X, is approximately linear, at least over a limited range of
o . 5 , - - - ,
14 12セ (a) 10セ セ 0 セ .( B,
•
bセ8
0"
<"
€l8
4 p 08
(j 0,
2 0 0 0 ョセ (1 " 0 0 o 0,
,
.
, 00 20 40 60 90 100 Wt % PPE 1.5 (b) 8 1.0 0 セ セ 0 .(,
0•
0 "<"
0.5 500*
1000 50% PS 50% PPE 100% PS 2500 2000 1500 Wavenumber (em"1)*
3000 (a) 7 6*
100% PPE oMェZZ[ZZ[ZZ[ZZZ[ZZ[ZZZZZZ[ZZ[ZZZ[ZZ[ZZ[Z[ZZ[ZZ[セZ[]Z[ZZZGセセセセ 3500 0.1 (b) 0.4 80.3セ
o セ 0.2 セ__
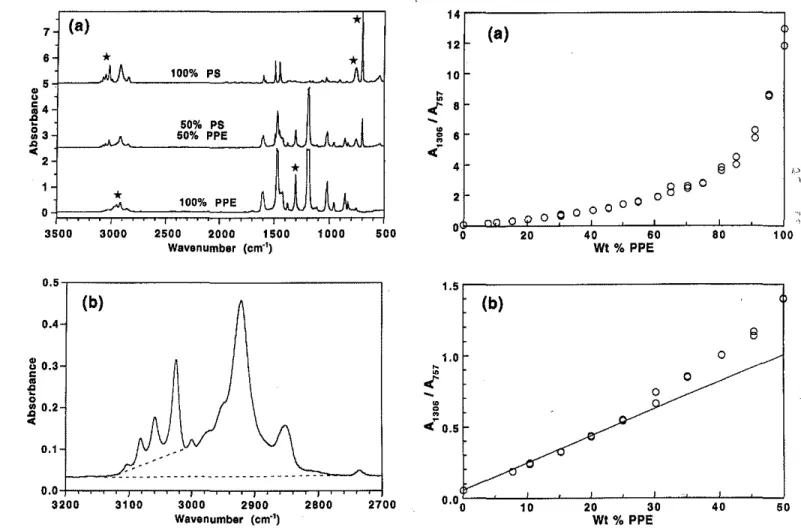
MセMMMMMMMMMMMMMMMMMMMMMMMMMMMセMセMMセセGMTFIG. 2. The relationship between A13061Am and the concentration of
PPE in PPE/PS mixtures. (a) All data; (b) expanded view of lower-concentration data. PNPPGlMセMQNLNlPLNMセMMZZRloMセMMMMZSZGZPMセMGZBTPGZMセMMZZUjo WI % PPE 2700 2BOO 3100 oNoKMセセ⦅イセセ . . .セセセBNNセセL⦅⦅セセL⦅ェ 3200 3000 2900 Wavenumber (em"')
FIG. 1. (a) Typical spectra obtained for PS. PPE. and a 50:50 blend, with peaks used in the analysis indicated bya
*;
(b) expanded view of theC-Hstretching region for the 50:50 blend, showing the baselines used for peak integration.polypropylene with polyethylene (PP/PE). The PPIPE data are from an earlier publication.' Both the PPE (from GE Plastics) and the PS (C-35 from Scott Polymer) were supplied as powders.
The PPEIPS mid-IR spectra were measured on a Ni-colet 170SX FT-IR spectrometer (with MCT detector) at a resolution of 1 cm-!; each spectrum corresponded to an accumulation of 64 scans. The samples used for analysis were obtained by dissolving precisely weighed amounts of PPE and PS in chloroform and casting thin films (typ-ical thickness, 15 セュI on glass microscope slides. The solvent was allowed to evaporate overnight at room tem-perature, after which the films were heated under vacuum for I h at 90-100 "C. The films were separated from the slides by adding a drop of water at one corner and letting it penetrate between the film and the slide. They were then thoroughly dried before measurement. For each of the twenty-one different mixtures prepared, ranging from
o
to 100% PPE, two separate films were cast and ana-lyzed.The PPEIPS near-IR spectra were measured on molten material at the end of a twin-screw extruder. It was as-sumed that the blend composition at the extruder exit was the same as that of the dry mixture fed into the extruder. The probe was a single-immersion reflection-type fiber-optic probe from Sensotron, with an effective pathlength
of about 6 mm. This was coupled to a Bomem Michelson MB 155 FT-IR spectrometer (with quartz halogen source and InAs detector) by means of silica optical fibers of 1.5 m length. Each spectrum was an accumulation of 32 scans (measurement time about 40 s) at a resolution of 4
em-I.
Data analysis and curve fitting were done ona Mac-intosh computer with the aid of the software Kaleida-Graph V3.0 from Abelbeck Software.
RESULTS AND DISCUSSION
PPEIPS Mid-JR. Figure la shows typical spectra re-corded in the mid-IR region for the pure polymers and a 50:50 blend by weight. The different peaks used for, quantitative analysis in this work are indicated by a
*.
Their areas were calculated by means of the Nicolet soft-. ware with a baseline drawn between the valleys on eithe,!, side. In the C-H stretching region, combinations of peaks were analyzed as illustrated in Fig. lb.PPE and PS are generally considered to form highly compatible blends through intermolecular interactions. Koenig and co-workers7,8have reported that certain peaks in the PPE spectrum, notably those near 1190 and 856 cm-!, are particularly sensitive to these interactions and change shape on blending with PS. On the other hand, the peak at 1306 cm-! and all the peaks of PS are not 776 Volume 50, Number 6, 1996
m1==-0.0538 m2"" 0.7595 rna=-0.3731 o 20 80 100, - - - , < 1 > - - , oGZM・LaZNMMMMZZMGZMセMMMMZ」GZ⦅セ⦅⦅⦅⦅ZZ⦅GZZ⦅セMZ[⦅iZ⦅MセMZMGN 0.0 0.2 0.4 0.8 0.8 1.0 A1306I (A1306+A757)
FIG. 4. The application of Eq. 8 to PPEIPS blends, based on the peaks at 1306 and 757em-I,
the weight percent of PPE is highly nonlinear, especially at high levels of PPE, where the ratio becomes very large. Even at lower levels of PPE (Fig. 2b), the relationship can be considered linear only up to about 25% PPE. Plot-ting the logarithm of the ratio (Fig. 3a) gives an S-shaped curve that can be considered linear over a limited range of about 35% to 65% PPE. This behavior is similar to that reported by Mukherji et a!. for the 11901700pair. If
the peaks being analyzed were "pure", then plotting the ratio A13oiA", against the ratio %PPE/%PS should give
a straight line, but Fig. 3b shows that a curve is obtained. This happens because the 757-cm-I peak does not arise from PS alone; it also encompasses a weak PPE peak.
It is obvious that with the above approaches it is im-possible to obtain a linear relationship that applies over a wide range of concentrations. Figure 4 shows the result obtained when the data are treated as described in the Introduction and fitted by means of Eq. 8. With the use of three coefficients, the slight curvature is well described and a good fit is obtained 'over the whole range of con-centrations. The quality of this fit is compared in Table I, Column 2, with those obtained by means of other sim-ple equations, namely, linear and polynomials of second, third, and fourth degree. Itis seen that, in this particular case, while Eq. 8 is much better than a straight line, a second-degree polynomial (which also has three adjust-able coefficients) works slightly better. However, it will be seen that this is not generally true.
The second pair of peaks that we consider are the PPE peak at 1306 em-I and the PS peak at 700 em-IItshould be noted that, because the latter is a very narrow peak, the spectral resolution of I em-I used in this work was found to give more accurate integrated peak areas than
1.5 (a) 1.0 0 セ
,
';0.5 セ セ 0.0C--
0 セMPNU 0 00 -1.0 -1.5 0 20 40 60 80 100 WI% PPE 10 (b) 8,
0 • 8<
0 セ•
• 0 " C- 4 8 0 O§O 2 /6'
,
,
0 0 4 8 12 16 20 WI%PPEIWI%PSFIG. 3. Other representations of the data shown in Fig. 2. (a) Log (A1306IAm) VS.wt % PPE; (b) A uo6/A m VS, %PPE/%PS.
significantly affected by the blending. Mukherji et a!. used for their quantitative analysis' the peaks at 1190 and 1030 em-I for PPE and the peak at 700 em-I for PS. In the present case, the peak at 1190 em-I was saturated in many of the spectra, so the peak at 1306 em-I was chosen instead. Apart from being less intense, the 1306-cm-1
peak is free from polystyrene interference and insensitive to blend interactions. The choice of peaks for PS is more limited. The ones near 1600, 1500, and 1450 em-I are subject to strong interference from PPE peaks; this leaves only those at 757 and 700 em-I and the C-H stretching peaks above 3000 em-I
The first pair of peaks that we consider are the PPE peak at 1306 em-I and the PS peak at 757 em-I. Figures 2 and 3 illustrate the problems encountered when these are analyzed by traditional methods. As can be seen in Fig. 2a, a plot of the ratio of peak areasA13oiA",against
TABLEt. Regression results for PPEIPS (mid-IR).a
p・。ォウセ 1306 and 757 1306 and 700 1306 and CH[aromJ CH[arom] and CH[total]
Fitt Corr. SEE Carr. SEE Corr. SEE Corr. SEE
Eq. 8 0.99867 1.55 0.99993 0.27 0.99996 0.26 0.99984 0.54
Linear 0.99224 3.75 0.99992 0.28 0.98742 4.77 0.99666 2.46
Polynomial-2 0.99894 1.38 0.99993 0.27 0.99956 0.89 0.99983 0.55
Polynomial-3 0.99903 1.33 0.99993 0.26 0.99994 0.33 0.99984 0.53
Polynomial-4 0.99922 1.19 0.99994 0.26 0.99998 0.21 0.99987 0.48
• Note: COlT - correlation coefficient; SEE = standard error of estimate in wt%.
1.0 m1=-0.0311 mOl= 0.5624 rna=-0.4755 0.2 0.4 0.6 0.6 A130SI(A1306+ACH[aromJ )
FlG. 6. The application of Eg. 8 to PPEfPS blends, based on the peak at 1306 cm-1and the aromatic C-H peaks.
100 80 セ 60 Q.
....
セ 40 20 0 1.0 0.0 m,=-0.0140 m2= 0.9974 m3= -0.0156 20 80 セ 60 Q.....
セ 40FIG. 5. The application of Eq, 8 to PPE/PS blends, based on the peaks at1306and 700em-I, 100セMMMMMMMMMMMMMMMMMBB PQMセ⦅GMMセMMMャ⦅セMNNQ⦅セMMGM⦅セMMi 0.0 0.2 0.4 0.6 0.8 A""I(A,,,.+
1..,00 )
1 0 0 , - - - 7 > - - , PTLLZZN[ZセセセGMGMセセセセセlNNNセセセセキ 0.0 0.1 0.2 0.3 ACH[aroml' ACH[total)FIa. 7. The application of Eq. 8 to PPEIPS blends, based on the C-H aromatic peaks ratioed against the complete C-H absorption.
,
) m,= -0.0461 m 2:: 3.0609 m3= -1.0712 60 20 セ 60....
セ 40covers a more limited range than in the previous cases, a good correlation is observed, and Eq. 8 fits it as wen as a second- or third-degree polynomial (Table I). The SEE of 0.54 wt %is higher than in the previous case but is still quite acceptable. An advantage of this approach is that the peaks are all above 2500 cm- I in a region ame-nable to analysis by equipment using sapphire fiber optics or windows.
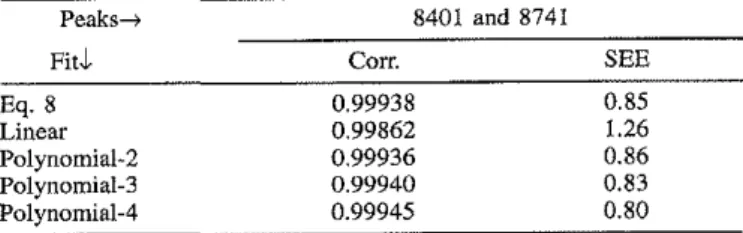
PPEIPS Near-IR. Figure 8 shows some typical spectra of PPEIPS blends in the near-infrared region correspond-ing to the second overtone of the C-H stretchcorrespond-ing vibra-tion. Polystyrene shows a peak at 8741 cm- I correspond-ing to the aromatic C-H bonds and a weaker one near 8300 cm- I corresponding to the aliphatic C-H bonds. As PS is replaced by PPE, the aromatic C-H peak at 8741 cm- I decreases in intensity and a new methyl C-H peak grows at 8401 em-I. Because of the peak overlap it is impossible to integrate individual peaks; therefore, in our analysis we have used instead the peak heights at the specific frequencies 8401 and 8741 em-I, calculated with respect to a baseline drawn as shown in the figure. The results of the analysis are shown in Fig. 9, and the dif-ferent curve fits are compared in Table II. Once again, Eq. 8 gives a good fit to the slightly curved relationship and is equivalent to a second-degree polynomial. the more typical resolution of 4 em-I This peak is also
rather strong and could not be measured accurately for mixtures containing 20% PPE or less. The analysis of the data by means of Eq. 8 is shown in Fig. 5. It was found
that this case corresponds to the perfect scenario for
anal-ysis by means of peak ratios: the two peaks are almost perfectly "pure" and have almost the same intrinsic ab-sorptivity. Hence ml
=
m3=
0, and m2=
I, so that % PPE = 100R, whereR = A1306/(A1306+
A 700). With such a good linear relationship, an excellent fit is obtained with any of the equations tested, as shown in Table I, Column 3. Again, this is by no means a common occurrence.On comparing Figs. 4 and 5, it can be seen that there is much more scatter in Fig. 4 than in Fig. 5. The reason for this difference was investigated, and the cause was
found to be traces of chlorofonn solvent remaining in the
films. Chloroform has a very strong peak near 757 em-I, and this interferes with the analysis in a randomly vary-ing manner when the 757-cm-1PS peak is used. As
men-tioned above, PPE also has a weak peak in this region. Its presence gives rise to the curvature in Fig. 4, but this would not present a problem if the chloroform were
ab-sent.
Since neither of the two PS peaks tested so far is ideal, a third possibility was investigated. This consists of the aromatic C-H stretching peaks above 3000 em-I, which arise mainly from PS. The integrated peak area, which we designate as ACH[aromj. includes the peaks at 3025,
3059,3082, and 3103 em-I, as shown in Fig. lb. Figure 6 shows the fit of these data by means of Eq. 8. There is much less scatter than with the 757-cm-1 peak, and the
whole range of concentrations is covered, unlike the case for the 700-cm-1peak. Furthermore, Eq. 8 gives an
ex-cellent fit, with a standard error of estimate (SEE) of 0.26 wt %. This is even better than that obtained with a third-degree polynomial, which has one more adjustable co-efficient. The applicability of Eq. 8 is clearly
demonstrat-ed in this case.
A fourth approach was also tried. This consisted of taking the ratio of the aromatic C-H peaks against the total C-H absorption, from about 3140 to 2780 cm- I (Fig. Ib). The C-H peaks below 3000 cm- I arise mainly from PS, but PPE also contributes. The result from this analysis is shown in Fig. 7. Although the peak area ratio 778 Volume 50, Number 6, 1996
TABLE II. Regression results for PPEIPS (near-IR).a 0.3
..
u 0.2"
..
.aセ 0 In .a 0.1 0( 0.0 - -/70% PPE ¥ 30% PPE Peaks--t 8401 and 8741FitJ.- Corr. SEE
Eg. 8 0.99938 0.85
Linear 0.99862 1.26
pッャケョッュゥ。ャセR 0.99936 0.86
Polynomial-3 0.99940 0.83
Polynomial-4 0.99945 0.80
• Note: Corr. - correlation coefficient; SEE - standard error of estimate inwt%.
9200 9000 8800 8800 8400 8200 8000 7800
Wavenumber (em")
FIo. 8. Near-infrared spectra (second overtone bands) of molten mixtures ofPPEand PS, showing the frequencies used for the analysis.
The spectra used for this analysis were also analyzed by means of the more sophisticated PLS method, which
uses all the data points in the peaks under consideration.
In the so-called cross-validation procedure, one spectrum at a time is removed from the calibration set, the calibra-tion is done with the remaining spectra, and the result is used to predict the concentration for the removed
spec-trum. This is done for each spectrum in the set, and the
root-mean-square value of the differences between true and predicted concentrations is known as the standard error of calibration (SEC). For the spectra analyzed here, the SEC for the PLS analysis was 0.43 wt% PPE. When a similar cross-validation was done for the method in-volving peak heights and Eq. 8, the SEC obtained was 0.97 wt%PPE. Obviously there is some loss of precision when only the peak heights are used rather than the entire spectrum. However, this approach could be applied with greater speed and simpler instrumentation, provided that the level of precision is acceptable.
PPIPE Mid-JR. The second polymer blend which we consider is the immiscible system polypropylene-polyeth-ylene (PP/PE). Various peak combinations have been used to analyze blends and copolymers.' In an earlier publication,6 we showed the relationship between the peak height ratioA1l6o/(A1160
+
Ano )and the concentrationof pp, for films obtained by hot pressing. The curve was fitted with a fourth-degree polynomial. In Fig. 10 we have plotted the wt % PP against the Same ratio and applied Eq. 8. In spite of the strong curvature, the fit with Eq. 8 is as good as with a second-degree polynomial (Table III). The slightly better fit obtained by using third-or fourth-degree polynomials is simply the result of better adjustment to experimental errors because of the extra coefficients, and does not contribute to better precision in the determination of the PP concentration. It is inter-esting to note that even though the two peaks used in this case are quite "pure" (the 1160-cm-l peak arises from methyl group wagging in PP and the 720-cm-l peak from methylene rocking in PE), there is still a strong nonlin-earity. This is because the intrinsic absorptivity of the PE peak is about twice that of the PP peak. If they were the same, the relationship would be linear, as was found for the 13061700combination in the case of PPE and PS.
Another set of peaks that has been used to analyze PP/ PE blends involves the C-H deformation bands at 1378 and 1467 cm-l .'.l0 The two are present in both PP and PE, but'the 1378-cm-l peak is stronger in PP because it arises from methyl groups. Figure 11 shows a plot of wt
% PP against the ratio A1378/(A1378
+
A,467 ). It is highlynonlinear, and the curvature is opposite to that observed in the previous case (Fig. 10). Nevertheless, Eq. 8 again provides a good fit, in this case considerably better than a second-degree polynomial (Table III). Itwould appear that, as a general rule, if the deviation from nonlinearity is small, then a second-degree polynomial works as well as Eq. 8, but if the deviation is large, then Eq. 8 is suo. perior. This is to be expected because Eq. 8 is derived
1.0 0.8 !TI1.-0.0081 m 2= 1.9633 m3= 0.9378 0.2 0.4 0.8 Am, I (Al1 " +1.,,, )
Flo. 10. The application of Eq. 8 to PPIPE blends, based on the peaks at 1160 and720 em-I. 100 80 セ 60 t'-j; 40 20 0 0.6 0.0 mj• -0.4043 m2= 2.8577 m 3• 0.4791 60 20 w
...
セ 40 セ 8 0 , - - - , . - - , 0.2 0.3 0.4 0.5 H8401I (H8401 +H 8741 )FIo.9. The application of Eq. 8 to PPEIPS blends, based on the near-infrared absorptions at 8401 and 8741 cm-1.
Peaks--7 1160 and 720 1378 and 1467 TABLE III. Regression results for PPIPE (mid-IRV
aNote: Corr.セ correlation coefficient; SEE= standard error of estimate in wt%.
from fundamental principles, whereas a polynomial fit is empirical.
Table III shows that the 1378/1467 comhination gives rise to a larger standard error of estimate than the
11601720 combination. This may be because both the
1378 and 1467 peaks contain a significant contributiou from Pp, so that the ratio is not very sensitive to changes in the PP concentration. Other peak combinations have also been used for PPIPE blends, for example, the C-H stretching peaks around 3000 cm-1 and combination or
overtone peaks in the near-infrared.lO,ll Deviations from linearity are observed in almost all cases, and Eq. 8 would undoubtedly be capable of describing these rela-tionships.
Regression Analysis. One disadvantage of the use of Eq. 8 is that nonlinear regression is required, but as al-ready mentioned, this is no longer a serious problem. However, if nonlinear regression software is not avail-able, the analysis can still be done by linear regression, although the procedure is more tedious. If a value is as-sumed for m" XI can be plotted agaiusrR/(1
+
m,R) and(11) 1 1 2 m,
=
R=oR=1__R-,o,--R-,o,,'s,--_R-,o""'c..R..J.1 2 1 Ilinear regression performed. The value of m, is then changed and the process repeated until the value of m, that gives the best linear fit is determined. If this approach is used, a starting value ofm, can be estimated from the experimental curve by using the equation
CONCLUSION
Ro., Ro R,
where Ro' Ro,s, and Rl are the ratios corresponding to Xl
=
0, 0.5, and 1, respectively.The results presented demonstrate that the proposed approach for the quantitative analysis of two-component blends or copolymers through the use of peak ratios in the infrared spectrum has definite advantages over tradi-tional methods. First, it is already well known that the use of a ratio involving two peaks from the same spec-trum can eliminate the effects of film thickness, sampling depth, and the like. Second, Eq. 8, which is derived from the fundamental laws of optical transmission, has been shown herein to be capable of describing the inherent nonlinearity of calibration curves for a numher of differ-ent cases. This equation is of broad general applicatiou because it covers the entire range of blend composition from 0 to 100%, and the two peaks or frequencies used for the analysis do not need to be "pure", i.e., associated exclusively with one or the other of the two polymers. However, as a general rule, the purer the peaks, the more sensitive the ratio will be to changes in composition.
1.83 9.74 3.79 1.56 1.45 SEE 0.99839 0.95365 0.99311 0.99883 0.99900 0.87 5.72 0.87 0.59 0.45 SEE Corr. 0.99967 0.98564 0.99967 0.99984 0.99991 Eq. 8 Linear Polynomial-2 Polynomial-3 Polynomial-4 FitJ 1 0 0 , - - - < p - , oエZMMMGM\ャB_ZMセMM]MエZMMセ」Z⦅GZ⦅セMLMj⦅Z⦅セ」Z⦅GZ⦅セMZMG 0.0 0.1 0.2 0.3 0.4 0.5 0.8 A1378I (A 1378+A1467)
FIG. 11. The application of Eq. 8 to PPfPE blends, based on the peaks at 1378 and 1467」ュセャN
L Y. Thomas,K. C. Cole, E. Pellerin, and M. M. Dumoulin, Polym. Maler. Sci.& Eng. 72, 19 (1995).
2. H.B. Hopfenberg, V. T. Stannett, andG.M. Folk, Polym. Eng.& Sci. 15, 261 (1975).
3. E. G. Bartick,J. C. Corbett, and G. L. McClure, ACS Symp. Ser. 197, 185 (1982).
4. J. E. Forrette and A. L. Rozek, J. Appl. Polym. Sci. 18, 2973 (1974).
5. A. K. Mukherji, M. A. Butler, and D. L.Evans, J. Appl. Polym. Sci. 25, 1145 (1980).
6. R. M. Paroli, J. Lara, J.-J. Hechler,K. C. Cole, and I.S. Butler, Appl. Spectrosc. 41, 319 (1987).
7. S.1: Wellinghoff, J.L.Koenig, and E. Baer, J. Polym. Sci., Polym. Phys. Ed. 15, 1913 (1977).
8. J.L. Koenig and J. M. Tovar Rodriguez, App!. Spectrosc. 35, 543 (1981).
9. H. V. Drushel, CRC Crit. Rev. Anal. Chern. 1, 161 (1970). 10. C. Tosi and T, Simonazzi, Angew.Makromol. Chern. 32, 153
(1973).
11. E. Nishio, M. Morimoto, and K. Nishikida, App!. Spectrosc. 44, 1639 (1990). m1=-0.0226 m2= 0.5032 m3=-1.2191 80 20 780 Volume 50, Number 6, 1996