Vous avez des questions? Nous pouvons vous aider. Pour communiquer directement avec un auteur, consultez la première page de la revue dans laquelle son article a été publié afin de trouver ses coordonnées. Si vous n’arrivez pas à les repérer, communiquez avec nous à PublicationsArchive-ArchivesPublications@nrc-cnrc.gc.ca.
Questions? Contact the NRC Publications Archive team at
PublicationsArchive-ArchivesPublications@nrc-cnrc.gc.ca. If you wish to email the authors directly, please see the first page of the publication for their contact information.
https://publications-cnrc.canada.ca/fra/droits
L’accès à ce site Web et l’utilisation de son contenu sont assujettis aux conditions présentées dans le site LISEZ CES CONDITIONS ATTENTIVEMENT AVANT D’UTILISER CE SITE WEB.
READ THESE TERMS AND CONDITIONS CAREFULLY BEFORE USING THIS WEBSITE. https://nrc-publications.canada.ca/eng/copyright
NRC Publications Archive Record / Notice des Archives des publications du CNRC :
https://nrc-publications.canada.ca/eng/view/object/?id=3fbc95de-cdbc-4c41-b547-4948f6c7d2ad https://publications-cnrc.canada.ca/fra/voir/objet/?id=3fbc95de-cdbc-4c41-b547-4948f6c7d2ad
NRC Publications Archive
Archives des publications du CNRC
This publication could be one of several versions: author’s original, accepted manuscript or the publisher’s version. / La version de cette publication peut être l’une des suivantes : la version prépublication de l’auteur, la version acceptée du manuscrit ou la version de l’éditeur.
Access and use of this website and the material on it are subject to the Terms and Conditions set forth at
Real-time processing and validation of optical ranging in a cluttered
environment
National Research Council Canada Institute for Information Technology Conseil national de recherches Canada Institut de technologie de l'information
Real-Time Processing and Validation of Optical
Ranging in a Cluttered Environment *
Blais, F., Lecavalier, M., and Bisson, J.
January 2000
* published in the 7th International Conference on Signal Processing Applications & Technology (ICSPAT '96). Boston, Massachusetts, USA. October 7-10, 1996. NRC 40163.
Copyright 1996 by
National Research Council of Canada
Permission is granted to quote short excerpts and to reproduce figures and tables from this report, provided that the source of such material is fully acknowledged.
Real-time Processing and Validation of Optical Ranging in a
Cluttered Environment
#François Blais*, Mario Lecavalier*, Joel Bisson**
*
National Research Council of Canada, Institute for Information Technology, M-50 Montreal Rd, Ottawa, Ontario, Canada, K1A-0R6.
**
Vitana Corporation, 26-5470 Canotek Rd, Gloucester, Ontario, Canada, K1J-9H3.
#
NRC-40163
Abstract
This paper presents real-time algorithms used to extract 3-D range information obtained from a standard area scan CCD camera in an optically cluttered environment. The system uses the redundancy of the range information obtained when combining a standard triangulation-based 3-D laser scanner and the NRC’s BIRIS system to validate the range measurements and to eliminate the outliers.
Introduction
Vision provides more information about the immediate environment than any other type of sensing technique. Although 2-D image processing is an attractive option for well controlled environments, 3-D digital imaging provides significant advantages, for example in applications such as environment modeling and perception, and for many industrial applications. Knowing the exact dimensions and shape of an object greatly simplifies the analysis of the data, providing scale and perspective invariant information to the computer.
Active triangulation is one of the most commonly used method for acquiring range data [1]. Although it has been around for several years, it is only recently that 3-D is really starting to emerge in more and more applications within industry. This is partly due to the development of low cost geometrically stable imaging sensors such as CCD’s, inexpensive laser diodes sources, and powerful digital signal processing systems.
Two popular laser-based techniques used for optical ranging of a target surface are known as the standard optical triangulation system and the BIRIS (bi-iris) system [1], the latter employing an aperture mask in a
converging lens system and a position sensitive CCD camera detector. Basic triangulation is very sensitive to the conditions of the environment. It operates well in a highly controlled environment but fails in more complex situations. For example, if the target surface is reflective or perturbations such as light from an open window enters the field of view of the camera, the detector becomes confused and cannot discriminate between the true target surface and false signals from either other objects or perturbations. The BIRIS system is better than the triangulation system in this respect because it uses the redundancy introduced by a dual aperture mask to validate the measurements. Combining the two techniques increases the accuracy of the sensing method without compromising the resolution of the 3-D system.
Range measurement
A quick overview of triangulation is presented to situate the context in which the algorithms are used. Figure 1 shows the “combined” BIRIS and plane-of-light techniques. The mask inserted in the lens of the CCD camera produces two images of the projected laser beam. Assuming that p1 and p2 are the locations of the laser peaks in the video image, both the center position of the laser points p=(p1+p2)/2 and their separation b=p2-p1 on the CCD sensor will be affected by a change in range of the laser points projected on the object. Range is computed by measuring either the laser positions p1 or p2 (standard plane of light technique), the center position of the points p=(p1+p2)/2, or their separation b=p2-p1 (BIRIS). A total of four possible ways for measuring range information can be used of which two are independent:
z k l p p p p = + ⋅ 1 (1)
p2 Laser
CCD
Object
p1
mask
Figure 1: Triangulation using BIRIS
Laser
Object
p1 p2
Figure 2: Double triangulation
z
k
l
b
b b b=
+ ⋅
1
(2) where kp lp, kb, and lb are calibration constants thatdepend on the opto-mechanical configuration of the sensor such as the focal length of the lens and the triangulation base. Details are available in [2]. Figure 2 shows another possible technique of obtaining range information from the use of two range sensors sharing the same laser source. As in the previous case, range information can be computed using the generalized equation: z k l pi i pi pi = + 1 (3)
where pi=p1 or pi=p2.
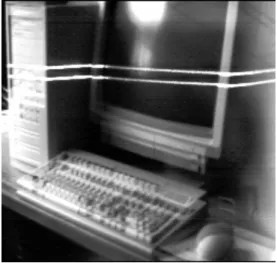
Figure 3 shows an “ideal” video image measured by the range sensor of Figure 1. Figure 4 represents a more realistic scene as encountered in a typically cluttered environment, showing the effects of ambient illumination on the CCD image.
The processing of the video information described in this paper is independent of the geometrical structure of the scanner and can be used with either technique.
Figure 3: Triangulation using principle of Fig. 1
Figure 4: Effects of ambient illumination on the video image. The doubled image is created by the mask of Fig. 1.
Signal Processing
The ability to distinguish between false measurements generated by the cluttered environment and those that truly represent a selected point on the target surface requires special signal processing that can be difficult to implement in real-time if not kept simple and optimized for this task. Table 1 lists the most important sources of noise present in the digitized video image. Although some of these sources of interference can be reduced by proper design, they cannot be totally eliminated. For example, an optical interference filter will reduce the optical effects of the sun interference and ambient illumination, not eliminate them. This is shown in
Figure 4 where an optical interference filter was used. The same interference filter will have no effect on other laser sources at the same wavelength.
External illumination
Ambient illumination and other light sources
Direct sunlight interference Other lasers
Laser Laser speckle Laser focusing
Laser power, object reflectivity Electrical Electromagnetic interference
CCD induced noise (e.g. clock) Other electrical noise
Other Signal jitter (e.g. video sync.) Signal quantification
Image aliasing Sensor non-linearity
Table 1: Sources of noise
Some of the sources of noise listed in Table 1 have a multiplicative effect on the signal (e.g. laser speckle [3] and object reflectivity), others are purely additive (e.g., electrical noise, external illumination), or introduce distortions in the signal (e.g., aliasing, focusing, jitter).
Mathematically, the digitized video signal can be represented by:
[
]
Y n( )=sm n( )⋅ X n( )⊗sc n( ) +sa n( ) (4)
where ⊗ denotes the convolution operation; sm(n),
sc(n), and sa(n) represent the different sources of
noise. X(n) is usually modeled using a Gaussian type distribution of the form:
X n e n pi ( )= −1⎛⎝⎜ − ⎞⎠⎟ 2 2 σ (5)
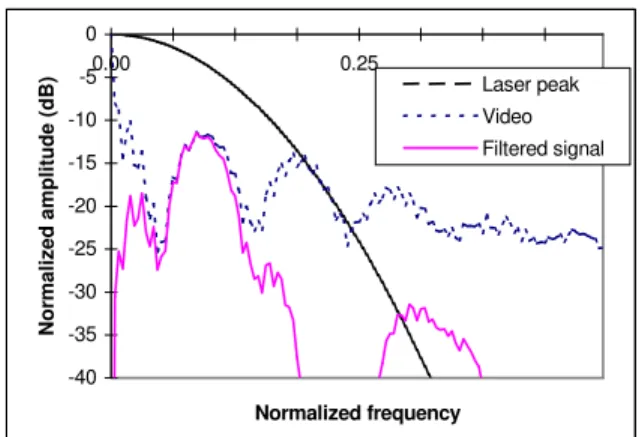
Figure 5 shows a typical profile extracted from the video image of Figures 3 and 4 respectively. Figure 6 shows the Fourier spectrum of the image of Figure 4.
Peak position detection - signal filtering
Detection of the laser peak position of the video signal consists of measuring the position and intensity of the peaks of the laser lines with maximum accuracy (to within a fraction of a pixel) at video rates (10MHz).
A more detailed analysis of the sources of noise shows that the most important ones are:
• ambient illumination, principally in the low frequency spectrum;
• electrical noise, uniformly distributed;
• CCD induced noise: the major source being mainly induced by the clocking mechanism of the CCD creating harmonics at ¼, ½, and ¾ of the sampling frequency;
• shot noise of distribution 1/f; and
• laser speckle noise that is multiplicative with the signal, and therefore creates a convolution of the Gaussian frequency distribution of the signal in the frequency domain.
0 2000 4000 6000 8000 10000 12000 14000 16000 CCD Position Am plitude Laser only Laser & background
Figure 5: Intensity profiles extracted from one vertical video line of Fig. 3 & 4.
-40 -35 -30 -25 -20 -15 -10 -5 0 0.00 0.25 Normalized frequency No rm alized amp litu d e (d B) Laser peak Video Filtered signal
Figure 6: Normalized Fourier Spectrum
The peak position operation uses FIR derivative filters to extract the location of the spots to 1/64th of a pixel and to validate the measurements [4]. Using the z- transform, the filtering/derivative operation is expressed as:
(
)(
)(
)
The location of the zero crossing of the output signal of this derivative operator gives the position of the laser peak. The second derivative, from a second operator, is used to validate the detection. Linear interpolation of the zero crossing of the first derivative provides sub-pixel accuracy to 6-bits of resolution (1/64th of a pixel).
These simple operations have proven to be quite robust and accurate. A comparison between this technique and other popular techniques such as centroìd calculations, single or double thresholding, Gaussian filtering, etc., have been discussed in [4,5,6].
Figure 6 shows the frequency response of the filtered signal of equation 6. The zeros in the frequency response of the filter remove the undesired noise introduced by the clocking mechanism of the CCD.
Peak Position Validation
Although proper filtering helps in removing most of the unwanted noise in the video signal, some other sources of noise will still affect seriously the quality of the video signal. They are principally:
• specular reflections in the image that creates false laser peaks; and
• false measurements introduced by other laser sources when multiple cameras are used simultaneously.
From the redundancy in the range equations 1 and 2, for a given laser point at range z we have
kp+ ⋅ =lp p kb+ ⋅lb b (8)
rewritten
(
)
(
)
0=kp+ ⋅lp p1+p2 −kb− ⋅lb p2−p1 (9)
0= p2− ⋅m p1−n (10) Let us assume that pi and pj are two of the N laser
peaks measured in the video signal, then the pair pi,pj
that minimizes:
εi j, = pj− ⋅ −m pi n (11)
with εi j, <εmin for ∀i j, ∈
[
0,N−1]
is consideredthe valid candidate. Parameters m and n are obtained during the creation of the model of the camera of the sensor (calibration).
Calibration of the range data
Calibration is used to compensate for the distortions introduced by the optical system. It consists of: (a) the creation of a model of the camera-lens-laser system, (b) the real-time calibration of the raw data using these calibration parameters.
The field of photogrammetry has presented a full range of models for the calibration of camera lenses [7]. The simple model, that is generally used, is based on the third order Seidel aberrations of a spherical lens. For range sensors, we found that this model is not sufficient and more parameters must be included such as:
• a change in the focal length of the lens with range;
• strong astigmatism in the lens design;
• non-symmetries and non-linearity in the laser-lens design
It is beyond the scope of this paper to discuss the details on the creation of a calibration model for the system. Instead, only the real-time implementation of sensor calibration using a generalized model will be presented. The generalized model we are using exploits efficiently the single cycle multiply-accumulate instruction of a DSP.
Expanding the inverse w=1/z of the range equation 3, in a Taylor expansion of order K, we have:
z W l l p l p l pK K = = + + + + 1 1 0 1 2 2 K (11)
for each video line u of the CCD camera. Equation 11 is generalized for the whole CCD using
W u p K L = ⋅ ⋅ = =
∑
∑
αη τ η κ κ η 0 0 , (12) With K=3 and L=6, a very good correction of the distortions of the camera-lens system is obtained. In matrices format equation 12 is rewritten:W =LT⋅M P⋅ (12) M is a matrix of dimensions (L+1)×(K+1) that contains the calibration parameters of the sensor and
[
]
Figure 7: Intensity image (quantity of laser light reflected from the object)
Practical implementation
The signal operations described in this paper have been implemented on an IBM-PC/AT board set using a dedicated FPGA and a Transputer1 network to obtain, in real-time, more than 45000 calibrated 3-D points X-Y-Z per second, per camera2. The PC is used as a host processor.
Experimental measurements show RMS errors of 1/8 of a pixel, using this algorithm. Furthermore, in very cluttered environments, less than 0.1% of outliers, are sometimes detected. Because these outliers are very localized in a range image, subsequent post-processing of the 3-D image eliminates the remaining false measurements. Figure 7 and 8 show a 3-D range image and the intensity image in perfect registration obtained using these algorithms and the optical configuration of Figure 1. For this image no outlier was measured and range accuracy of 1 mm RMS is obtained.
Conclusion
One of the most prominent problem of conventional triangulation-based 3-D range sensors is their limitations when dealing with environments where ambient illumination creates a lot of erroneous readings. That makes conventional 3-D range technique highly susceptible to false measurements which then requires complex image processing techniques to filter out the noise. This paper has
1
A TMS320C44 based system and PCI bus is currently available.
2
A prototype of the Biris/plane-of-light sensor consisting of 6 cameras, each projecting simultaneously 3 laser planes on the scene has been demonstrated [8].
Figure 8: Range image of the object of Fig. 7. Intensity of the image is proportional to range
presented algorithms that are used to eliminate the problems associated with optically cluttered environments. Redundancy in the range measurement has been used to considerably reduce the number of outliers detected in a video image. Particular considerations have been placed on the low-cost real-time implementation of the algorithms to obtain accurate and “clean” 3-D range images of a scene, in real-time.
References
1. F.Blais, & Al., “Practical considerations for a
design of a high precision 3-D laser scanner system”, SPIE, vol. 959, 1988.
2. F.Blais, & Al. “Compact Three-dimensional
Camera for Robot and Vehicle Guidance”,
Optics and Lasers in Engineering, 10, 1989. 3. R.Baribeau & Al., “Influence of speckle on laser
range finders”, Applied Optics, 30-20, 1991.
4. F.Blais, M. Rioux, “Real-time numerical peak
detector”, Signal Processing, 11, 1986.
5. D.K.Naidu, R.B. Fisher, “A comparative
Analysis of Algorithms for Determining the Peak Position of a Stripe to Sub-pixel Accuracy”.
Proc. British Machine Vision Conf., Glasgow, Scotland, 1991.
6. B.F.Alexander, K.C.Hg, “Elimination of
systematic error in subpixel accuracy centroid estimation”, Optical Engineering, 30-9, 1991.
7. American Soc. Photogrammetry, “Manual of Photogrammetry”, 4th ed. 1980.
8. L. Assaf, & Al., “Système autonome de saisie
d’analyse et d’interprétation de surface pour la gestion des chaussées”, 20e Congrès mondial de la route, Montréal, Sept. 1995.