Changing Small Group Interaction through
Visual Reflections of Social Behavior
by
Joan Morris DiMicco Sc.B. Applied Mathematics
Brown University Providence, RI, 1995 S.M. Media Arts and Sciences Massachusetts Institute of Technology
Cambridge, MA, 2001
Submitted to the Program in Media Arts and Sciences, School of Architecture and Planning,
in partial fulfillment of the requirements for the degree of DOCTOR OF PHILOSOPHY
at the
MASSACHUSETTS INSTITUTE OF TECHNOLOGY June 2005
0 Massachusetts Institute of Technology, 2005 All Rights Reserved
Joan Morris DiMicco Program in Media Arts and Sciences April 2005 Certified by
Walter Bender Executive Direc r& Senior Research Scientist
,;K MIT Media Laboratory
Dr. Andrew B. Lippman Chair, Departmental Committee on Graduate Students Program in Media Arts and Sciences
ROTCH
Author MASSACHUSETTS INSTITUTE OF TECHNOLOGYJUN 2 7 2005
LIBRARIES
Accepted byChanging Small Group Interaction through
Visual Reflections of Social Behavior
by
Joan Morris DiMicco
Submitted to the Program in Media Arts and Sciences, School of Architecture and Planning,
in partial fulfillment of the requirements for the degree of Doctor of Philosophy in Media Arts and Sciences.
April 2005 Abstract:
People collaborating in groups have potential to produce higher-quality output than individuals working alone, due to the pooling of resources, information, and skills. Yet social psychologists have determined that groups rarely harness this potential. This thesis proposes that technology in face-to-face settings can be used to address the social factors that have damaging influence on
group decision-making processes.
While there is much work in the area of collaborative software and groupware, this work differentiates itself with its specific aim to influence the way a group shares information without mediating the group's communication. By presenting visualizations to the group of individual levels of participation and turn-taking behavior, the technology aims to augment the group's communication ability, by making it more aware of imbalances.
A series of dynamic displays positioned peripherally to a discussion were developed and used by a variety of groups during face-to-face meetings. Both observational and experimental results indicate that these displays influence individual participation levels and the process of information sharing used during a decision-making discussion. A display revealing real-time participation levels caused those at the highest levels of participation to decrease the amount they spoke. Viewing a visualization of previous turn-taking patterns caused those who spoke the least to increase the amount they spoke in a subsequent discussion; real-time feedback did not produce this change. Additionally, after reviewing their turn-taking patterns, groups altered their information-sharing strategies. For groups that had poor sharing strategies on an initial task, this change improved their ability to share information related to the decision; for those who did not need intervention, feedback on turn-taking was not beneficial for their subsequent information sharing. The central finding of this research is that displays of social information, viewed during or after a meeting, bring about changes in a group's communication style, highlighting the potential for such displays to improve real-world decision-making.
Thesis Supervisor: Walter Bender
Thesis Committee
Thesis Advisor Mr. Walter Bender
Executive Director & Senior Research Scientist MIT Media Laboratory
Thesis Reader Dr. J. Richard Hackman
Cahners-Rabb Professor of Social and Organizational Psychology Harvard University
Thesis Reader Dr. Rosalind W. Picard
Associate Professor of Media Arts and Sciences MIT Media Laboratory
Thesis Reader Dr. Candace Sidner
Senior Research Scientist Mitsubishi Electric Research Laboratories
Acknowledgements
First and foremost I would like to thank Walter Bender, my advisor, for supporting my research from its original, vague conception. He has consistently guided me on how to explore the deep issues while still keeping the broad perspective. I hope that over the years I have acquired his instinctive insight into which problems are the interesting and challenging ones to pursue.
My thesis readers: Richard Hackman has inspired me to believe that groups do have amazing
potential and can be improved in innovative ways. Thank you for being so supportive of my research ideas and my future endeavors. Candy Sidner has offered insightful comments from our very first meeting, guiding me on what was technically feasible and what would be beneficial for meetings. Roz Picard has always been an enthusiastic supporter of my ideas, so much so that she offered up both her research group and her pattern recognition class to assist me in my endeavors.
Other mentors: I would like to thank Pattie Maes, my first advisor at the lab, for introducing me
to academic research and for inspiring me to pursue the PhD after the Masters. I would also like to thank Dan Ariely. He has influenced my research approach, particularly in his questioning the benefits of groups, and I appreciate how he encouraged me to question my original assumptions. Other mentors at the lab include Henry Lieberman, Judith Donath, Hiroshi Ishii, Chris Schmandt, Cynthia Breazeal, Bruce Blumberg, Ted Selker, and John Maeda. I especially want to thank Judith and Cynthia for being on my general exam committee and steering my original exploration into the areas of social visualization and sensing of human behavior.
Lab community: My research could not have been done without the amazing Media Lab
community. I would like to thank each and every person who helped me along the way with a seemingly small technical issue or question. Each of my projects has benefited from others' input and expertise. Anna Pandolfo, Kate Hollenbach and Sunil Vemuri deserve special thanks for their help on my thesis projects.
At this point I suspect that every single person at the lab has been solicited by me to be in an experiment. I want to thank each person who participated in a study, particularly the Electronic Publishing Group, the Student Committee, and the Affective Computing Group who repeatedly welcomed my technology into their meetings.
Outside the lab: There have been many mentors outside the lab and their comments have helped
to shape my work and writing. I would like to acknowledge their input: Judy Olson, Paul Maglio, Amy Greenwald, Michael Muller, Eric Horvitz, Kori Inkpen, Elizabeth Churchill, and the members of Richard Hackman's "Group Group."
Finally, I couldn't have done this without the support of my entire family, especially my husband, Mike DiMicco.
Table of Contents
Chapter 1: Introduction... 13
1. Theoretical Grounding ... 14
II. Overview of the Thesis ... 18
Chapter 2: Sensing Group Behavior... 21
1. Codifying Group Interaction... 21
II. Autom ated Detection of Group Behavior... 23
III. Speech Recognition in M eetings ... 24
IV. A Speech-Driven M eeting Capture Tool... 24
V. M easuring Speaking Amount ... 28
VI. Conclusion... 30
Chapter 3: Visualizing Behavior... 31
I. Technology that Changes Group Interaction... 31
II. A Display of Speaker Participation ... 35
III. Second M essenger 2.0... 36
IV . Efficacy of the Visualizations... 40
V. Conclusion... 44
Chapter 4: Quantitative Evaluation of Group Behavior ... 45
1. Related Technology Studies ... 46
II. An Inform ation Sharing Task ... 47
III. Evaluation M etrics ... 48
IV. Changing Individual Participation with a Shared Display... 49
V. Changing Group Process with a Visual Replay ... 64
VI. Conclusions ... 87
Chapter 5: Observations and Lessons Learned from Groups... 89
I. W hat Happened During the Experiments? ... 89
II. Three Case Studies ... 94
III. Private Participation Displays... 107
IV. Overall Conclusions from Experiments ... 108
Chapter 6: Im plications and Conclusions ... 111
I. Future W ork... 112
II. Broader Im plications... 114
Appendices ... 117
Appendix A: Hardware Design... 118
Appendix B: Experimental Procedures Given to Subjects ... 120
Appendix C: Experim ent Questionnaires... 125
Appendix D: Experim ent Tasks... 131
Bibliography... 135
Figures and Tables
Figure 2.1 Second Messenger 1.0... 25
Figure 2.2 The Client Applet of Second Messenger 1.0... 25
Figure 2.3 Second Messenger 1.0 System Architecture... 26
Figure 2.4a Sound Detection Hardware ... 29
Figure 2.4b Portable Hardware Box... 29
Figure 2.5 Microphone Calibration Screen... 29
Figure 3.1 Conductive Chat Software... 33
Figure 3.2 Conductive Chat Hardware... 33
Figure 3.3 Speaker Participation Display... 35
Figure 3.4 A Group Using Second Messenger 2.0 ... 37
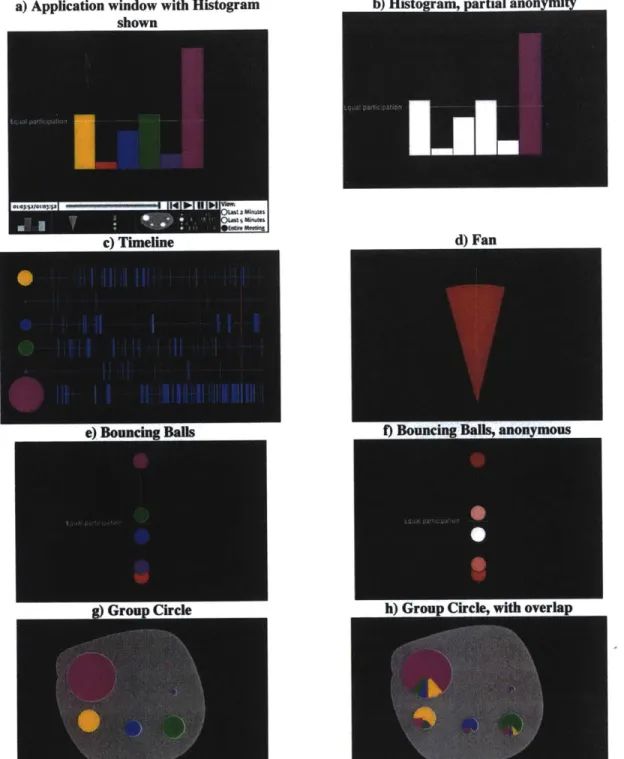
Figure 3.5 Second Messenger 2.0 Visualizations ... 39
Table 3.1 Evaluation of Group Personality... 42
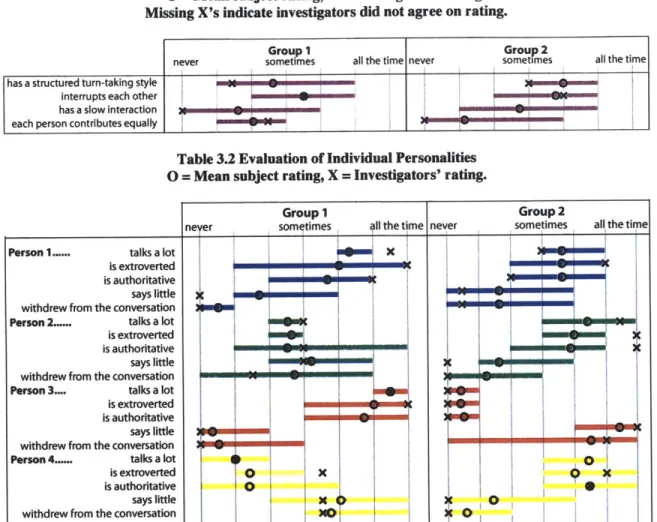
Table 3.2 Evaluation of Individual Personalities... 42
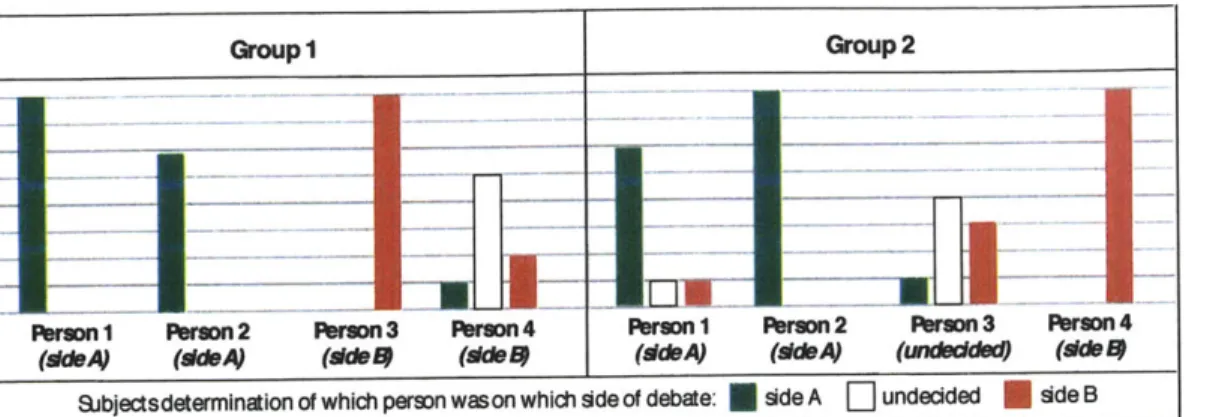
Table 3.3 Evaluation of Sides of the Debate... 43
Table 3.4 Adjectives Describing the Groups... 43
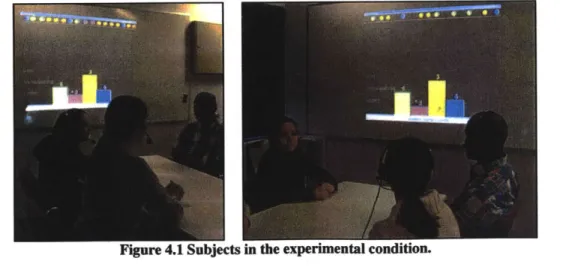
Figure 4.1 Subjects in the experimental condition. ... 49
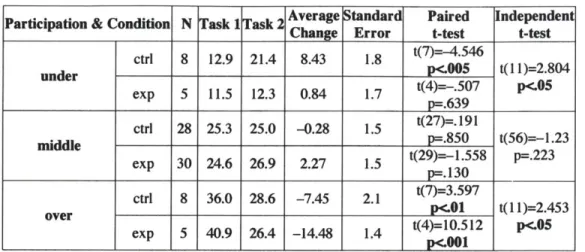
Table 4.1 Participation Rates for Each Participation Category and Condition... 55
Figure 4.2 Average Change in Participation Rates... 55
Table 4.2 Participation Rates for Each Information Role and Condition... 57
Figure 4.3 Average Change in Participation Rates... 57
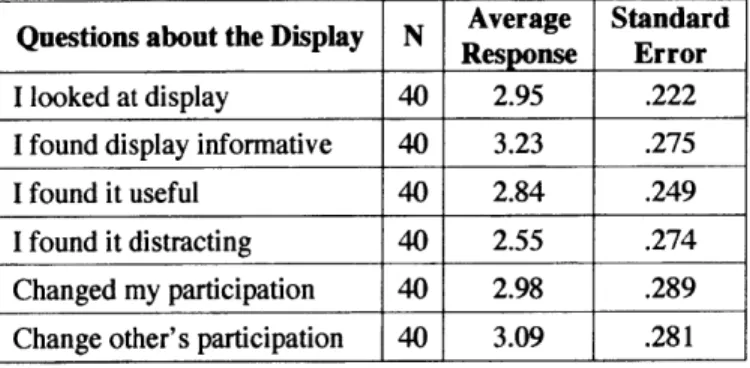
Table 4.3 Average Responses to Questions about the Display ... 59
Table 4.4 Changes between Post-task Questionnaire Responses... 59
Table 4.5 Rating of the Display's Accuracy by Participation Level... 60
Table 4.6 Self-rated vs. Actual Participation... 60
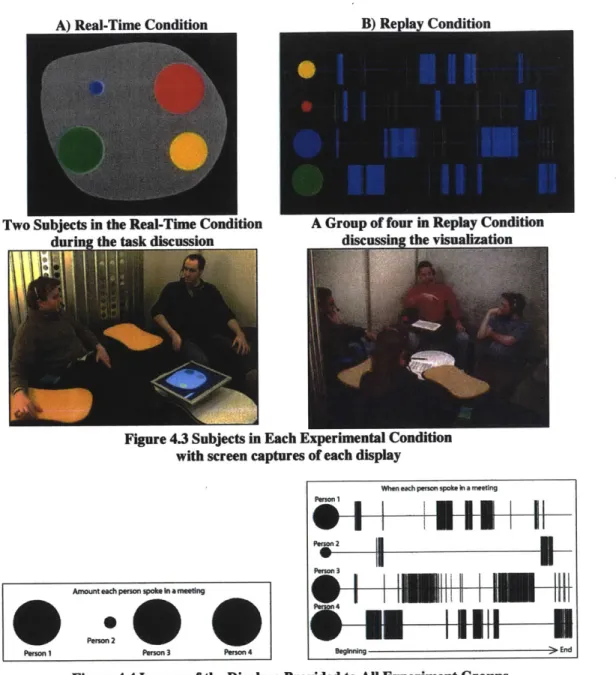
Figure 4.3 Subjects in Each Experimental Condition...65
Figure 4.4 Images of the Displays Provided to All Experiment Groups ... 65
Table 4.7 Number of Subject Groups in Each Condition... 68
Figure 4.5 Interaction of Citizenship and Race on Participation Rate...70
Table 4.6 Correlations with Participation Rate...71
Figure 4.6 Comparison of Information Sharing in Each Task ... 72
Table 4.7 Information Shared in Each Condition and Task ... 72
Figure 4.7 Distribution of Information Sharing in Task 1...73
Figure 4.8 Interaction of Task 1 Sharing and the Replay Display ... 73
Table 4.8 Information Shared in Each Task by High/Med/Low Performers...73
Table 4. 9 Post-hoc Tukey Results...74
Figure 4.9 Over- and Under-Participators' Change in Participation... 76
Table 4.10 Over- and Under-Participation Rates and Significant Changes Between Tasks...76
Table 4.12 Minimum Participation Rate in Each Condition ... 78
Figure 4.10 Change in Minimum Participation Rate between Tasks...78
Table 4.11 Turn-Taking Variables Calculated for Each Group ... 78
Table 4.13 Dispersion in Participation Rates for Each Task... 80
Figure 4.11 Change in Participation Rate Dispersion ... 80
Figure 4.12 Change in Turn Length Between Tasks by Condition...81
Table 4.14 Impact of Real-time Display on Average Turn Length ... 81
Table 4.15 Ratings of Task Difficulty...82
Table 4.16 Perception of How Well Group Performed ... 82
Table 4.17 Satisfaction with Group's Final Answer... 82
Table 4.18 Ratings of Task Efficiency... 82
Figure 4.13 Ratings of Task Efficiency ... 83
Table 4.19 R atings of Trust ... 84
Figure 4.14 Satisfaction with Contribution for each Condition, for Task 2... 84
Table 4.20 Satisfaction with Quantity and Quality... 85
Table 4.21 Correlations with Amount of Information Shared ... 85
Figure 5.1 Four Types of Groups ... 90
Figure 5.2 Participation Levels in the Student Group's Meetings ... 97
Figure 5.3 Participation Levels in the Research Group's Meetings... 98
Figure 5.4 Participation Levels in the Human Resources Group's Meeting ... 99
Table 5.1 Dispersion in Participation Levels ... 99
Figure 5.5 Each Group's Average Ratings of Each Member's Contributions ... 101
Table 5.2 Reactions After First Use ... 104
Figure 5.6 Reactions After First Use... 104
Table 5.3 Student Group's Participation Levels ... 106
Figure 5.6 Private LED Light Display ... 108
Figure A.1 Assembled Hardware ... 118
Figure A .2 Serial Schem atic... 118
Figure A.3 Single Channel Schematic (8 total on board)... 118
Figure A .4 Pow er Schem atic... 119 Figure A.5 PIC Schematic ... ...1 19
Chapter 1: Introduction
"What doomed the Columbia and its crew was not a lack of technology or ability, the [independent review] board concluded, but missed opportunities and a lack of leadership and open-mindedness within NASA management. ... The disaster, the [board's final] report said, was fully rooted in a flawed NASA culture that downplayed risk and suppressed dissent. 'I am
convinced that the management practices overseeing the space shuttle program were as much a cause of the accident as the foam that struck the left wing,' the report said."
-"Final Shuttle Report Cites 'Broken Safety Culture' at NASA" New York Times, 26 August 2003
The contradiction of groups is the realization that the process of exchanging ideas and discussing decision alternatives can actually lead to fundamentally flawed decisions. The NASA Challenger Disaster is frequently cited as an example of such a decision failure (Griffin 1997) and unfortunately, in the summer of 2003, NASA also determined that the Columbia Disaster was more a flaw of group decision-making than of engineering.
The type of decision failure that led to the Columbia Disaster has been documented many times in the very public arena of politics and also in the experimental setting of the laboratory, illustrating that these flaws are not just bad luck, but rather indicate that our decision capabilities in groups are faulty because of a consistent over-reliance on the social cues and behavioral pressures in group settings. These cues subtly encourage groups to conform to the opinion of the authority, suppress alternative viewpoints, and inadequately share information relating to the decision at hand, and these behaviors systematically increase the likelihood of a flawed decision (Janis 1982).
As an alternative to existing technology designed for collaboration, I propose a new type of interface for groups that does not mediate or control communication, but rather visualizes different types of group behaviors, to encourage a more productive process that allows for more information sharing and exchange of viewpoints, without dictating or controlling the group decision-making process. These applications observe group patterns and reflect back the observed patterns for the group to observe and correct extreme skews in its deliberation process.
This thesis presents the design and implementation of collaboration applications that sense group behavior and reflect the behavior patterns back to the group in the form of dynamic visualizations. An essential aspect of this research is to understand the impact of these information displays on group process, through both qualitative and quantitative evaluation. Therefore, groups in both real-world meetings and in the controlled environment of a lab setting have used these applications during their decision-making discussions.
This research thesis had two objectives: (1) to build dynamic visualizations of social behavior designed to improve group processes during face-to-face collaboration and (2) to run qualitative and quantitative evaluations of group collaboration to determine the impact of these information visualizations on group process and individual behavior. The outcome of this research has been a new understanding of how displays of social information are received by collaborating groups, specifically with evidence of how group behavior changes and group decision-making is altered, and a set of guidelines for building applications designed with the intention to change behavior.
I. Theoretical Grounding
Research in social psychology has demonstrated that our ability to make group decisions is frequently flawed because we overly rely on social cues during a group discussion. Regrettably, when technology is introduced as a mediator in our communication, our group decision-making ability further degrades. As supporting background for this research, I present these two issues in more detail to illustrate why collaboration technology can address the issues of group dynamics more effectively within the role of social facilitator, rather than as a process or communication mediator.
A. Social Psychology of Groups
Conversations held by groups for the purpose of making decisions are fraught with complications. Social psychologists have demonstrated that individuals allow the presence of the other people in the group to influence their behavior to such a degree that through the process of exchanging opinions, the group is led to a lower quality decision (as compared to aggregating individual decisions) (Bray 1982, Hackman 1992, Janis
1982, Myers 1971, Whyte 1991).
Imagine a scenario where a small group of employees has been given the task of interviewing and hiring a new employee for the company. The group has located the job candidates, reviewed resumes, checked references, and interviewed each of the individuals. When the group is ready to make the decision, it meets for a face-to-face discussion of the pros and cons of the different candidates. By sharing information and opinions about the job candidates, the group comes to a decision on whom to hire.
Social psychology predicts a dismal outcome for this well-intentioned group. It is highly likely that the members of this group will inadequately share information they know about the job candidates (Stasser 1987, Stewart 1998). The group will likely spend its time discussing the group's initial inclination on who to hire, to the detriment of seriously considering the other candidates (Bray 1982, Hackman 1992, Janis 1982, Myers 1971, Whyte 1991). And through the process of discussing the prevailing viewpoint, the individuals in the group will likely become more strongly committed to their initial inclination than they were when they originally entered the meeting (Brown 1986, Moscovici 1969). Each of these systematic flaws increases the likelihood that this group will make a strong commitment to a flawed decision.
While groups have flawed decision processes, Raven (Raven 1998) describes a well-known experiment that aptly illustrates the difficulty in universally stating that groups hinder decision-making. In the experiment, groups of people were asked a basic math question (about a man buying, selling, buying back, and selling back a horse) and were then required to come to a consensus decision. On average, substantially more individuals got the right answer after discussing it with the group, indicating that the process of discussion encouraged the pooling of skills and perspectives, allowing more individuals to make the correct conclusion. But, it turns out that if the group were leaning towards the wrong decision, then all of the individuals would end up making a wrong decision, persuaded by the majority. And further confounding the question of whether or not the group setting helped in the decision, the groups that reached a unanimous decision felt
more satisfied with their decision than those who did not, even if they were shown to be
incorrect in their judgment. This experiment illustrates that individuals rely on the opinion of others as an indicator of the accuracy of their judgments, but this reliance can occasionally lead to an error in judgment. Yet, as a corollary to this, if a criterion of decision success is satisfaction with the outcome, then individuals' use of this heuristic may be beneficial even in cases where their judgment is wrong.
With this understanding of the complexity of our limitations, what can we do to limit the harm and harness the benefits of groups? By altering its decision-making process, a group can avoid the above communication flaws and over-reliance on others. For example, by allowing for minority viewpoints to be freely expressed (Bray 1982), by continually scanning the available options to find new alternatives that may work (Hackman 1987), and by allowing for open dissent of the authority figure's opinion (Janis 1982), the group
A man bought a horse for $60 and sold it for $70. Then he bought it back for $80 and sold it again for $90. How much money did he make? (A) He lost $10. (B) He broke even. (C) He made $10. (D) He made
$20. (E) He made $30. The correct answer is (D), he made $20.
making the hiring decision will more thoroughly consider all of the job candidates they interviewed and will more likely make the best possible hiring decision for the group. Considering the existing research literature, there are three possible areas I believe should be examined to enhance decision making processes with technology. First, determine ways to increase vigilance in considering choice alternatives (Janis 1982); second, work to limit the effects of group polarization (a group's tendency to shift towards risk or caution) (Brown 1986); and third, discover ways to increase the sharing of information between individuals (Stasser 1987).
Researchers in organizational behavior often propose one of two methods to solve these problems: 1) train leaders to facilitate groups more effectively or 2) develop group procedures that will ensure productive group processes. These two methods are not without weaknesses. Janis (Janis 1982) and Maier (Maier 1967) outlined different ways group leaders can have a positive impact on a group and its decision-making ability and while their leadership guidelines are useful, the practicalities of training and the challenges in ensuring leaders successfully employ guidelines leave this approach lacking. Delbecq (Delbecq 1975) and others have presented specific techniques for implementing group procedures that tackle the common errors in group decision-making. These procedures involve anonymous pooling of ideas and formalized critique and evaluation methodologies. But again, their approach is limited in its ability to impact decision making because of the training issue. In their case, the Nominal Group Technique and the Delphi Technique prescribe rigid procedures for a very particular type of decision-making situation, and the rigidity of their technique invites group resistance and has prevented widespread adoption and impact.
B. Potential of Technology
The majority of today's collaborative tools, of which (Olson 1989, Stefik 1987) are good examples, were built without serious consideration of their impact on the significant decision errors outlined above. Thus, there are still ripe opportunities for developing decision-making environments that mitigate the errors in group interaction. As stated above, I believe technology can be of most use to groups if it is built with the intention to
1) encourage vigilance in the discussion, 2) instill a resistance to group polarization, and 3) increase the sharing of information, three methods for avoiding common decision flaws.
For example, vigilance can be encouraged by a system that observes the communication of a group, notes the alternative ideas mentioned, and makes the infrequently mentioned alternatives appear within the discussion. Group polarization can be limited with a re-framing of decisions in terms of gains, not losses, and an interface or tool that is able to re-frame questions from different points of view may be able to achieve this, such as Paese did in a non-electronic environment (Paese 1993). Information sharing can be encouraged within a group by allowing for anonymous comments or by encouraging private documenting of relevant information that will later get automatically shared with
the group (akin to the Nominal Group Technique, but done electronically) (Delbecq 1975).
Technology is already a part of our decision-making environments, both as communication tools and information devices. As these tools become more pervasive, there is an increasing opportunity to build applications that enhance our communication abilities, rather than restrict them. If tools can be designed such that the flaws in our decision-making heuristics are limited, then the potential for harnessing the gains of group interaction increases.
C. Mediating Technology
While people are highly skilled at using their verbal and nonverbal communication skills to express themselves, when technology is introduced as a mediator of the communication, individuals have more difficulty expressing themselves and the quality and effectiveness of their communication degrades (Hollingshead 1996, Kiesler 1992, Ochsman 1974, Reid 1997).
Communication technology over the decades has enabled us to hold conversations that could not have been held otherwise, by connecting distant physical spaces (Isaacs 1994, Ishii 1993), by allowing for rich asynchronous communication (Davis 2003, Hollan 1992, Olson 2000, Rosenberger 1998), by providing new tools for expression (Brave 1997, DiMicco 2002, Kurlander 1996) and by providing new interpretations of our communication through data analysis and visualization (Sack 2001, Smith 2001).
There are enormous benefits of mediating technology, but because mediating technology fundamentally changes the way we communicate, the technology can create additional group process problems. For example, video-conferencing is commonly used for meetings within companies, yet studies have shown that there is less trust between individuals and it is more difficult to establish common ground over video than when face-to-face (Anderson 1997, Isaacs 1994, O'Malley 1996, Rocco 1998). When communication is text-based, such as with IRC, email or, increasingly, instant-messenger, decision-making tasks take more time and produce lower rates of task accuracy (Kiesler 1992, Ochsman 1974, Siegel 1986). They also cause individuals to make more declarative position statements and less information-based statements (Reid 1997), making productive information-based meetings more difficult to hold. Finally, in the specific areas of group polarization and information sharing, it has been shown that groups experience more group polarization (Kiesler 1992, Siegel 1986) and less information sharing (Hollingshead 1996) when communicating in a text-based environment.
Social psychologists point to our faulty decision-making processes when our decision quality suffers. Yet, from the perspective of the Media-Richness Theory (Daft 1986, Rice 1992), it may not be our group processes that cause our decision failures, but rather the limitations of our ability to express ourselves in our current media. As illustrated by Reid's study (Reid 1997), when the medium does not support sufficient expressiveness,
we resort to more simplistic ways of expressing our thoughts, and it is this adjustment of conversational style that is detrimental to our decision-making ability.
As designers of technology for decision-making, our goal is to build technology that falls
higher on the expressiveness curve than the current standard of face-to-face
conversations, based on the premise that our face-to-face communication has been shown to be faulty. Current communication technology effectively supports simpler communication tasks, but when communication becomes more complex, such as in a decision that requires a high degree of information and opinion sharing, we need more than our face-to-face environment offers us. We need an environment that is enhanced in such a way that our current ability to express ourselves and interpret each other's meaning is increased. At this point, we may reach our decision-making potential and begin to correct our previous decision errors.
Mediation effects on communication illustrate how the expressiveness of an environment changes our ability to communicate effectively. Unfortunately, even without mediation, we still have difficulties expressing ourselves and, as decision tasks become increasing complex, our communication abilities begin to degrade and our task performance suffers. The lesson to take from this is that we need to focus on the unique expressiveness that technology can offer, and focus on building environments that incorporate these new types of expression into our communication.
II. Overview of the Thesis
The focus of this thesis is on building interfaces that assist groups in improving their interaction processes. The goal is to encourage groups to include a more diverse set of viewpoints in their discussions, in order to promote higher quality group decision-making. The interfaces presented in this document strive to reveal information about the ongoing social dynamics within a group's real-time communication by providing analysis and evaluation of this communication. They are designed for a face-to-face setting, to allow individuals to utilize their natural strengths in communicating while providing a display of information that assists the group in reflecting upon its current interaction. In real-world decision-making situations, there is not always a "right" answer to be found. And even in situations with a right answer, it is often difficult to identify it because people hold different information about the decision that can sway them in opposing directions. Consider the previous example of the group deciding to hire a new employee. Each member of the group may have slightly different information regarding the job applicants derived from interviewing the candidates, reading resumes, and speaking to references. In this situation, the group must determine the best choice by sharing both opinions on the candidates and factual information they have collected. In this type of decision task, there is a substantial risk that the individuals who hold critical information will not effectively share it to enable the group to make the best choice (Stasser 1987, Stewart 1998). When there is poor information sharing in a discussion to the detriment of exploring new ideas and when groups move to extremes in
their commitment to the prevailing viewpoint, there is an increased likelihood that a group will make a strong commitment to a faulty decision (Hackman 1992, Janis 1982, Myers 1971, Whyte 1991). So while meetings can be frustrating due to inefficiencies, there is a larger issue looming: group-wide dynamics often prevent all viewpoints from being shared and this process decreases our ability to make high quality decisions.
I am interested in using technology to assist in correcting these flawed processes. By analyzing face-to-face communication between individuals in a group and by dynamically presenting information to the group about their interaction, I hypothesize that technologically-enhanced groups will have the ability to make more effective, higher-quality decisions.
The challenge of this work falls into four categories: sensing group processes as they occur, providing interfaces that show groups their interaction patterns, highlighting potential flaws, and the evaluation of how individuals and groups change in response to these visualization tools. This document is organized according to these challenges. Chapter 2, "Sensing Group Behavior," addresses advances in sensing technology and
networked applications that offer new opportunities for interfaces to interpret and assist in our real-time, face-to-face communication. It is now straightforward to capture many aspects of group interaction, such as verbal comments via automated speech recognition (Morgan 2003) and affect signals with basic sensors (Picard 1997). In this chapter, I present related sensing work, my own exploration of the opportunities for sensing group dynamics, and a discussion of how the use of speaking times, detected through the volume level on microphones, can be used as a proxy for measuring group interaction. Chapter 3, "Visualizing Group Behavior," introduces the visual displays I built that illustrate the data collected during face-to-face meetings. Presenting data to a group in real-time is becoming a realistic standard in collaborative settings. For example, lectures and conferences can incorporate a simultaneous chat room into the discussion with relative ease (Rekimoto 1998) and conference call applications, such as the Jabber project (Kazman 1995), can capture and present context-sensitive information as the group converses over the network. This chapter presents other related projects and the design rationale for the visualizations, and finally a preliminary user study evaluating how the interfaces convey different social messages to an observer.
Motivated by this increased facility to monitor and simultaneously present context-sensitive information to a group, I am exploring ways in which this can improve group-decision processes. By building interfaces for face-to-face collaboration that do not mediate, but rather augment, a discussion, we expect that groups will use their natural abilities to communicate with each other and simultaneously utilize the tools made available to them to make observations and corrections in their behavior as it occurs. Chapters 4 and 5 evaluate this aspect of the research. Chapter 4, "Quantitative Evaluation of Group Behavior," presents results from two quantitative behavioral studies run with groups in experimental settings. These studies evaluated the specific behavior changes that groups exhibited while using the displays in decision-making situations. Chapter 5,
"Observations and Lessons Learned from Groups," presents my qualitative observations and higher level understanding of how these displays were integrated into group settings and the emotional and social reaction to having this information revealed to a group. The final chapter, Chapter 6, "Implications and Conclusion," discusses the broader implications for this research and outlines appropriate directions for future inquiry.
Chapter 2: Sensing Group Behavior
Automated sensing of behavior and salient events in a meeting or group context is an emerging field of study. Experts in vision systems, speech recognition, and gesture and facial recognition are currently advancing our ability to recognize different behavior and events in naturalistic settings. As my goal is to sense a group's interaction for the purpose of assisting a group in altering it, part of my research has been to understand the state-of-the-art ability for systems to detect behavior in natural group settings. This chapter is an overview of the different approaches to detecting group behavior, the current abilities of technology, and my use of speech recognition technology and of microphone volume detection, as measures of behavior in group interactions.
I. Codifying Group Interaction
While we can incorporate sensors, cameras and microphones into meetings, it is important to understand the purpose in the detection of behavior and human activity. For my goal of detecting the higher-level inter-personal dynamics a group, it is useful to consider how social psychologists conceptualize and codify group communication.
Broadly speaking, group communication is frequently categorized as either task-oriented or process-oriented; within a group setting, each individual's communicative acts can be coded by either what the group is doing (task-orientation) or how the group is doing it (a process-orientation). For a task-oriented analysis, McGrath has outlined different types of group tasks and researchers in both social psychology and computer-supported cooperative work have used this framework to both describe group activity and to build supportive tools (McGrath 1984).
These tasks are:
* Planning Tasks: Generating plans * Creativity Tasks: Generating ideas
- Intellective Tasks: Solving problems that have a correct answer
* Decision-making Tasks: Tasks for which the preferred answer is the correct one
e Cognitive Conflict Tasks: Resolving conflicts of viewpoint
* Mixed-Motive Tasks: Resolving conflicts of motive-interest
* Contests/Battles: Resolving conflicts of power; competing for victory
Performances: Psychomotor tasks performed against objective standards
Particularly in the field of CSCW, McGrath's tasks are often used as a way of understanding a group's actions and determining the technical requirements for a software application designed to support that group's activity. For the experiments that will be presented in Chapter 4, subjects were asked to perform "decision-making tasks," yet they were actually performing "intellective tasks" in the sense that there was a particular answer expected if the group used a successful process. In Chapter 5, in the discussion of the case studies of real-world groups, the group meetings were mostly "planning tasks" with brief "cognitive conflict tasks" incorporated into the discussion. The prevailing approach to understanding group process through behavior coding is the SYMLOG system, developed by Robert Bales (Bales 1950, Bales 1999, Bales 1979). To understand a group's process, trained observers code each group member's behaviors according to Bales' "Interaction Process Analysis" guidelines and, by aggregating these observations, produce a descriptive analysis of a group's interaction dynamics that can later be used by the group for learning and reflection. These guidelines code for behavior such as asking or providing opinions, agreeing or disagreeing, showing tension or releasing tension, and asking or providing suggestions. The aggregate report summarizes the group in terms of dominating and submissive personalities, relationships to authority, friendliness, and emotional expressiveness. As will be discussed in Chapter 4, these aggregate reports summarize the personalities of the group members, and some of the personality characteristics SYMLOG codes for are successfully and automatically visualized within the application Second Messenger 2.0's interfaces.
While these task-oriented and process-oriented analysis approaches provide frameworks for those working on automated detection of behavior, there is still a considerable challenge in determining how to automatically measure behaviors in such a way as to aggregate them into these high-level conceptualizations of the group's behavior. When hand-coded by experts, through observation and video analysis, there are still moments of disagreement and ambiguity in the ratings, and many of the small actions of individuals cannot be understood outside of the context of the entire meeting. For example, at the level of determining through direct observation turn-taking patterns and ownership of the floor, moment-to-moment there is substantial ambiguity as to whose turn it is (Parker 1988, Stasser 1991). In short, there is a gap between observing behavior and successfully summarizing it is either a process-oriented or task-oriented level of the group's behavior.
II. Automated Detection of Group Behavior
An important question to ask is "what should be captured in a group interaction?" Both verbal and nonverbal communication reveal information about individual intentions, and at a high-level, these can reveal both a group's task and process. Verbal utterances can be analyzed in terms of each speaker's attitude and communicative intentions (Grosz 1986, Lochbaum 1998). Nonverbal behaviors, such as hand gestures, eye gaze, posture shifts, and head movements, reveal information about the attitudes between individuals and shifts in topic and task (Argyle 1988, McNeill 1992). Of these behaviors, which can be accurately captured and summarized?
There are numerous research initiatives that study augmenting the experience of the face-to-face meeting by offering technological assistance. The original conception for many of these initiatives came from Xerox PARC's CoLab Project (Stefik 1987). Since then, many different labs are building their own meeting capture environments: Stanford's Interactive Workspaces (Johanson 2002), MIT CSAIL's Agent-based Intelligent Reactive Environments (Brooks 1997), the Media Lab's Facilitator Room (Basu 2001), CMU's Interactive System Labs Meeting Room (Burger 2002), Georgia Tech's eClass (Abowd
1999), and IPSI's AMBIENTE Project in Darmstadt, Germany (Prante 2002) each augment a meeting space with cameras, microphones and interactive displays to allow for numerous types of meeting assistance and full capturing of events.
The majority of the projects associated with these initiatives tackle the technical challenges in providing pervasive technical assistance to dynamic meeting contexts and ways to capture all aspects of communication related to the meeting. After capturing a meeting's data, there is then the design and development of applications for the browsing and scanning of content. Ricoh Innovations is one example of a lab working on how to use salient audio and video events to tag a dataset to aid in the browsing of a meeting's recording (Erol 2003).
Returning to the concept of codifying group behavior in terms of task and process, McCowan, et al. have utilized the McGrath framework to build an application to determine the type of meeting (task) a group is holding using both audio localization (where are people talking) and video analysis of body movements (blob detection of heads and arms around the room) (McCowan 2005). By considering each meeting as a series of sequential actions that are representative of a particular type of meeting, either a monologue, presentation, discussion, or a note-taking session, they were able to use Hidden Markov Models to train a system to detect a meeting type with relatively high accuracy. Although their approach is promising, it is a good example of the weaknesses in the current sensing technology: the robustness of their categorization of a meeting is limited to when groups followed rigid scripts according to strict definitions of the different types of meetings (or tasks). In natural meetings settings, where groups flow from one task or meeting style to another, their system had much lower accuracy rates, because the natural overlapping of events that occurred in real meetings were not within their training set or conceptual model.
Despite the limitation of the work on meeting capture in terms of assisting group process, these projects are very useful for understanding the issues in measuring group behavior in natural group settings and in highlighting areas that are not sufficiently developed to pursue my research agenda of altering group behavior.
III. Speech Recognition in Meetings
One fruitful avenue of research has been capturing a meeting's spoken content for post-meeting analysis. Using either off-the-shelf speech recognition software or custom designed recognizers, and requiring each speaker to wear a close-talking, noise-canceling microphone, many researchers have demonstrated success in analyzing an audio collection for verbal content. The current leading work in this area is being done at ISCI in Berkeley, were their large-scale, multi-year project is referred to as the Meeting Recorder Project. As part of this initiative, they have developed algorithms for performing topic tracking and the detection of agreement and disagreement within an audio recording of a meeting (Hillard 2003, Morgan 2003). Another example of promising use of audio content to extract summarizing information is Kristjansson, et al.'s work where they built a meeting-support tool that augmented an audio recording of a meeting with an outline of the meeting's structure derived from a discourse analysis of the conversation (Kristjansson 1999). Capturing and then summarizing the meaningful structure of a meeting indicates that group process or structure may be able to be captured.
Several projects at the MIT Media Lab have also demonstrated the unique ways speech recognition transcripts can be used for high-level analysis of groups, despite inaccuracies in transcription. Sunil Vemuri has provided valuable guidance for detecting verbal content from informal conversational speech as part of his project "What Was I Thinking?" (Vemuri 2004). By using IBM's ViaVoice with additional accuracy filtering, he produced low fidelity transcripts of conversational speech. Another project at the lab that strives towards high-level topic spotting was built by Jebara, et al., (Jebara 2000) where their system performed real-time topic spotting by comparing the voice-recognition transcript to a fixed corpora derived from newsgroups. During a face-to-face conversation, the current topic of conversation (limited to the corpora) was displayed on a shared screen. Eagle, et al., (Eagle 2003) further developed this work by incorporating the Open Mind Common Sense database (Singh 2003) into the analysis. With OMCS, they located the 'common sense' connections between spoken words to eliminate errors in voice-recognition and provide a topic-level summary of a conversation. While this was not a real-time support tool, it offers a promising method for analyzing speech-recognizer output.
IV.
A Speech-Driven Meeting Capture Tool
Each of the above initiatives shows promise in determining the content of meetings and because of them, I was motivated to explore using speech recognition as a way of
tracking and detecting social dynamics. The first application built for this research initiative is called "Second Messenger" and it is designed to support a group in a face-to-face meetings using the verbal content to reflect a group's interaction (DiMicco 2004a).
A. Second Messenger 1.0
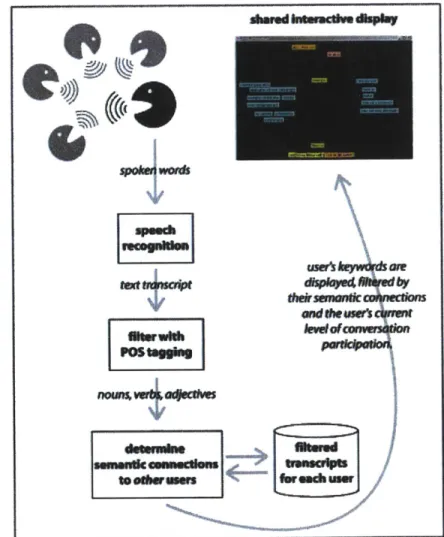
Second Messenger 1.0 uses a speech-recognition engine as an input method and outputs filtered keywords from the group's conversation onto an interactive display. The goal of the interface is to improve the quality of a group discussion by increasing the visibility of diverse viewpoints. The system uses a combination of speech-recognition technology and semantic analysis to display a real-time text summary of the group's comments. The content on the shared display can be manipulated with a pointing device, making the display a real-time meeting tool that can be used by the group to organize their discussion. See Figures 2.1 and 2.2 for screenshots of the client applet and the shared group display.
Figure 2.1 Second Messenger I.
The spoken phrases fall down the center of the screen. Users can move the phrases around the screen to organize their ideas. Untouched phrases collect at the bottom of the display.
&cwkt~w ~okw.UuNSUM 0E
SOW t", to~ OWpI I8W
Figure 2.2 The Client Applet of Second Messenger 1.0
Users can turn their audio feed on/off and choose the color of their transcribed text. They also have the option to send text directly to the display.
The core goal of Second Messenger 1.0 is to influence the way a group communicates in a face-to-face setting. Because research has shown that increasing the amount of discussion around minority viewpoints can increase the quality of group decisions
(Nemeth 1989), the application attempts to bring this about through emphasizing the minority viewpoints in the group by selectively filtering which users' keywords appear on the display. By increasing the visibility of group members who speak less frequently, and filtering out the comments of group members who are verbally dominating, the application attempts to amplify the voice of the group's minority members.
B. System Architecture
The following sections explain how the application works: first assembling a transcript of the conversation; and then filtering it according to semantic and social facilitation goals. Figure 2.3 provides an overview of this process.
Awm4W6*uwumdpbmy
sel
g
MUM 048Wf Ptagg~4~aigb twruserriMon IeerL0
j"A RJIIrp
-
/&U
Figure 2.3 Second Messenger 1.0 System Architecture
1. Conversation Transcription
Today's speech-recognition technology is far from ideal, creating a significant challenge to deploying an application that detects informal, non-dictation speech. To achieve the highest accuracy possible and to eliminate the challenge of speaker identification, each user is required to wear an individual microphone that sends his/her speech to an
individually-trained speech model. The system uses IBM's ViaVoice engine to convert each speaker's audio to text and then streams this transcript to a central server for processing.
Second Messenger 1.0 does not need a complete transcript of a conversation, but rather a collection of the relevant keywords. Thus the system performs part-of-speech filtering on each incoming utterance to reduce the text to nouns, verbs, and adjectives. This type of filtering removes the non-verbal utterances (ah's and um's) and many of the uninteresting comments, such as simple affirmations and confirmations.
2. Semantic Filtering
The next step is to determine which text to display to the group. My opinion is that the most interesting comments are the ones that haven't been said before, yet have some relation to previous comments made by others. Therefore when the system performs a semantic analysis of the phrases using WordNet, it calculates how close the current phrase is to prior phrases spoken by other members of the group. Specifically, it locates mutual conceptual parents of the spoken words. For example, after semantic filtering, the phrase "I saw some good peanut butter cookies at Star Market yesterday" becomes "peanut butter cookies" if other people have previously used words connected to the parent concept "food." Our objective is to encourage contributions from everyone in the group, therefore the emphasis here is to display the ideas that relate to each other that originated from different people, preventing one person from controlling which text appears on the display.
3. Social Facilitation
As stated in the introduction, the primary goal of this project is to encourage equal participation in a meeting for the purpose of increasing the diversity of the discussion, and ultimately the quality of the decision-making. Utilizing the fact that the system knows exactly how many words each user has spoken, Second Messenger is able to calculate if someone is under- or over- contributing to the conversation. Imagine a meeting scenario as described earlier where most of the group is able to state their opinions, yet one member contributes disproportionately less. When Second Messenger detects this type of imbalance in the verbal contributions, rather than displaying the spoken text with the same imbalance in contributions, it visually emphasizes the less-vocal member's contributions. When someone is contributing one-fourth the amount of the other group members, their text phrases are no longer filtered through the semantic filter, so that all of their spoken nouns, verbs, and adjectives are displayed. If someone is dominating the discussion, by saying twice as much as all other group members combined, they will no longer have any of their words displayed on the screen. These contribution ratios were chosen as a baseline and these could be adjusted if desired. I hypothesize that this type of filtering will make the less-vocal members' contributions more apparent and the dominating individuals seek out others' ideas and opinions.
C. Evaluation & Speech Recognition Accuracy
The system was deployed as described and used informally during several weekly research meetings. In a multi-person conversational setting, the voice-recognition results were so poor that they distorted the application's text output to the point of irrelevance to the meeting. To avoid this problem, the system was enhanced to filter ViaVoice's output based on the "phrase score" returned for each word. Although IBM states that the phrase score is not a confidence value, Vemuri, et al. (Vemuri 2004) demonstrated that a word's phrase score is a good predictor of word accuracy. By setting the phrase score threshold high (above zero), one can ensure that the words sent through the semantic filter were actually spoken.
Unfortunately, although this filtering removes errors, in a conversational setting it filters out the majority of the spoken words due to low phrase scores. In use, very few content words appeared on the screen once filtering was put in place. In an informal trial where five people trained voice models and participated in two-person and three-person conversations, the recognition rates were well below a reasonable level. On average, 76.3% of spoken words were assigned a negative phrase score (standard deviation = 7.2%), leaving less than 25% of the spoken words transcribed and available for semantic analysis by the system.
A second observation made during the informal evaluation of the software is that the complexity of the information provided in the display is difficult to incorporate into a face-to-face discussion. The goal of the application was to provide a peripheral or secondary channel of information, yet the content presented requires constant attention if the user is to understand the on-going filtering. Unless the application were to evolve into a tool that a group would directly focus its attention on during a discussion, the current level of semantic filtering and analysis was in excess of what a group needed to support real-time face-to-face interaction.
V. Measuring Speaking Amount
Given this low level of detection and my desire to use this system in real-world meetings to observe behavioral changes, I decided to explore using speaking amount, instead of speech content, as a measurement of interaction in a group setting.
To detect speaking time, each user of the system wears a microphone that detects speech on the microphone and sends it over a serial port for processing. To quantify an individual's spoken contribution, the system detects the microphone sound level every 10 milliseconds and when the level is elevated to a participant's natural speaking level (calibrated before the experiment) for 30 milliseconds within a window of 50 milliseconds, the application interprets this as one "speech unit." This calculation eliminates very quick breaths and other isolated non-lexical vocalizations from being interpreted as speech.
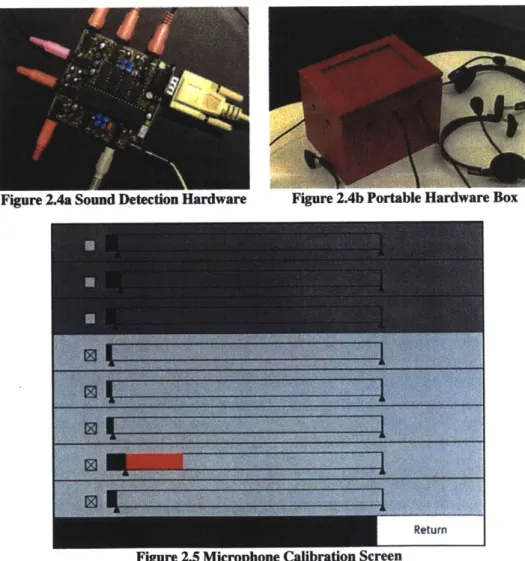
I have found that there are several advantages to this basic measurement technique. First, this simple metric does not require a user to train a voice-model or spend time working with the system before use, allowing it be used immediately by anyone. Second, where a speech recognizer fails to accurately evaluate short utterances as such, because of its attempt to place each utterance in context with the person's previous and next comments, a volume detection system accurately captures and treats short utterances as what they often are: non-lexical comments that do not contain verbal content, but reflect involvement and engagement of the listener. Third, because volume detection is computationally simple, there were no longer issues of having a separate machine per user to perform speech recognition or issues of machine latency due to processing speed. Figure 2.4a shows a picture of custom hardware designed to collect the volume off of eight separate microphone channels. Figure 2.4b shows the box that contained the hardware, enabling the system to be relatively portable and usable by groups in different
locations. Appendix A provides the schematic diagrams for the hardware.
Figure 2.4a Sound Detection Hardware Figure 2.4b Portable Hardware Box
Figure 2.5 Microphone Canlranon
Prior to usage, each person's microphone was calibrated to their speaking level, so that when they spoke, and only when they spoke, the application would interpret that as a moment of speech. Figure 2.5 shows the application's screen that indicates the current
volume detection on the hardware's eight microphone channels. Each microphone setting can be adjusted with a slider to accommodate for louder or softer speaking individuals. In this screenshot, the top three microphones are turned off, and hence grayed out, and the seventh microphone is detecting that someone is speaking, indicated by the red bar.
VI.
Conclusion
As discussed in Chapter 1, a significant challenge for groups is avoiding the process-based flaws of groupthink and group polarization. Therefore, if technology is to support more productive meetings and face-to-face discussions, a first step is to design technology that can capture and represent a meeting's content based on the process used by the group.
Towards this goal, the first version of Second Messenger uses speech-recognition and semantic-analysis techniques to gather and then display the conversational keywords onto a shared workspace. The application utilizes its knowledge of who said what to assist in finding the relevant keywords and to emphasize the contributions of "minority" group members. In this manner, this application attempts to equalize the contributions of individuals during a meeting in order to increase the diversity of ideas discussed and increase the quality of the decisions made. By working within the process-based construct that participants who contribute less to a conversation may be a minority opinion, the application works to equalize the contributions to the visual display.
The outcome of building this application was a realization that to understand how process feedback has an influence on group process itself, the measurement needed to be robust enough to provide an accurate representation of the group's interaction, even if only a very basic representation. At this time, off-the-shelf speech-recognition technology cannot provide accurate summaries of the content of a face-to-face meeting, and thus, measuring the speaking quantities of each individual in the meeting became the method for capturing the dynamics of the group. The next chapter addresses how this information
can be used to visualize different patterns and behaviors in a group setting.
Chapter 3: Visualizing Behavior
In building interfaces for group reflection, my design goal has been to present information that encourages a group to increase the breadth of its discussion so that more viewpoints will be considered. As described in the previous chapter, my first work in this area focused on capturing spoken content using voice-recognition software and presenting discussion content to the group within an interactive idea-capturing tool (DiMicco 2004a). This chapter presents tools to visualize speaking amount as an indication of group interaction. The challenge in designing these tools is conveying the appropriate social message to a group with an awareness tool that does not mediate communication or dictate a group process.
This chapter begins with a discussion of related work in the areas of communication tools and social visualization, and then presents two applications that visualize the speaking patterns of who-spoke-when during a meeting, which are the focus of the evaluations in later chapters.
I. Technology that Changes Group Interaction
There are several different types of collaboration applications that provide guidance in how to alter the dynamics of a group's interaction for the purpose of assisting the communication. These include a subset of traditional groupware tools, social visualization tools, and select examples of computer-mediated communication tools that incorporate anonymity and biosensors.
A. Traditional Groupware Tools
For over two decades, researchers have been working on integrating technology into our group decision-making settings. These applications are commonly referred to as "groupware" or "group decision support systems" (for representative examples, see (DeSanctis 1985, Nunamaker 1991, Sproull 1991)). While this work includes many examples of systems designed for meetings, most of these applications focus on collecting and organizing documents and agendas related to the meeting (Mantei 1988, Nunamaker 1991, O'Grady 1994). As such, there are fewer examples of tools that assist in monitoring the social dynamics of a group to assist in communication. The following section highlights some of these applications.
While the "smart meeting room" initiatives described in the previous chapter record the behavior of the individuals in a meeting, none of these projects focused on issues relating
to changing the behavior of the individuals. A notable exception to this is Project Nick, a
meeting-augmentation project presented at the first ACM Conference on Computer-Supported Cooperative Work (Begeman 1986, Cook 1987). The project was a large-scale proposal for supporting group process within meetings through innovative communication tools. It allowed people to send private messages to the meeting's facilitator about their "mood" during the meeting to indicate interest or boredom. It also proposed that summarizing reports that stated how much each person had spoken during the meeting should be generated, although the authors proposed that these calculations would be done by hand. The goals of the project were similar to my own, in attempting improve group decision capabilities, yet the implementation was limited by existing technology and incorporated an assumption that a meeting facilitator would manage the technology.
Another important example is Jabber, a project by Kazman, et al. (Kazman 1995). This application collected information about who was speaking and, with voice recognition, determined some keywords of what was said, during a conference call. By providing a visual summary of the audio stream over the phone line, the tool could be used during a call to monitor who had been speaking and the general words that had been stated. While they did not have the goal of altering the group discussions, Jabber is an example of
augmenting verbal communication by enhancing a group's awareness of the interaction. A more recent project, by Chen (Chen 2003), studied how providing behavior feedback
in a classroom setting could assist instructors in "feeling the pulse" of the classroom. In a remote classroom arrangement, the instructor could get visual feedback on who was gesturing and fidgeting during the lecture from camera sensors. As with our work, they used simple visualizations of activity to assist in understanding group interaction to a greater level, although this tool is designed for the group leader (the instructor), not the entire group.
Focusing on small, collocated groups, Huang's IMHere application (along with other projects at IBM Research) provides examples of how a large-scale, shared display can be used to increase a group's awareness of its behavior patterns over time (Huang 2004, Russell 2005). With an awareness of basic actions and movements of co-workers in and