Causal relationships between solar proton events
and single event upsets for communication satellites
The MIT Faculty has made this article openly available. Please share
how this access benefits you. Your story matters.
Citation
Lohmeyer, Whitney Q., Kerri Cahoy and Shiyang Liu. "Causal
Relationships between Solar Proton Events and Single Event Upsets
for Communication Satellites." In 2013 IEEE Aerospace Conference,
Big Sky, MT, 2-9 March 2013. p.1-10. Institute of Electrical and
Electronics Engineers.
As Published
http://ieeexplore.ieee.org/stamp/stamp.jsp?
tp=&arnumber=6497166
Publisher
Institute of Electrical and Electronics Engineers
Version
Author's final manuscript
Citable link
http://hdl.handle.net/1721.1/80842
Terms of Use
Creative Commons Attribution-Noncommercial-Share Alike 3.0
Causal Relationships between Solar Proton Events
and Single Event Upsets for Communication
Satellites
Whitney Q. Lohmeyer, Kerri Cahoy and Shiyang Liu
Dept. of Aeronautics and Astronautics
Massachusetts Institute of Technology
Cambridge, MA 02139
[email protected]
In this work, we analyze a historical archive of single event upsets(SEUs) maintained by Inmarsat, one of the world’s leading providers of global mobile satellite communications services. Inmarsat has operated its geostationary communication satellites and collected extensive satellite anomaly and telemetry data since 1990. Over the course of the past twenty years, the satellites have experienced more than 226 single event upsets (SEUs), a catch-all term for anomalies that occur in a satellite’s electronics such as bit-flips, trips in power supplies, and memory changes in attitude control systems. While SEUs are seemingly random and difficult to predict, we correlate their occurrences to space weather phenomena, and specifically show correlations between SEUs and solar proton events (SPEs). SPEs are highly energetic protons that originate from solar coronal mass ejections (CMEs). It is thought that when these particles impact geostationary (GEO) satellites they can cause SEUs as well as solar array degradation. We calculate the associated statistical correlations that each SEU occurs within one day, one week, two weeks, and one month of SPEs at 10 – 10,000 MeV with energies greater than 10 particle flux units (pfu). However, we find that SPEs are most prevalent at solar maximum and that the SEUs on Inmarsat’s satellites occur out of phase with the solar maximum. Ultimately, this suggests that SPEs are not the primary cause of the Inmarsat SEUs. A better understanding of the causal relationship between SPEs and SEUs will help the satellite communications industry develop component and operational space weather mitigation techniques as well as help the space weather community to refine radiation models.
T
ABLE OFC
ONTENTSI.
I
NTRODUCTION... 1
II.
S
OLAR PROTON EVENTS... 2
III.
S
INGLE EVENT UPSETS... 3
IV.
C
ONCLUSIONS... 7
A
CKNOWLEDGMENTS... 8
R
EFERENCES... 8
B
IOGRAPHIES... 8
A
PPENDIX... 8
I. I
NTRODUCTIONThe UK satellite telecommunications company, Inmarsat, currently operates ten satellites that provide global coverage for its mobile services. These satellites consist of three different generations. Inmarsat maintains an archive containing more than twenty years’ worth of telemetry and satellite anomaly data from these three satellite generations. The contents of Inmarsat’s telemetry database include component health data such as total bus power and solar array current. The database also contains records of various anomalies including solid-state power amplifier (SSPA) failures, telemetry corruption, and single event upsets (SEUs). In this work, SEUs are categorized as seemingly random anomalies that occur in a satellite’s electronics; for example: bit-flips, trips in power supplies, and memory changes in attitude control systems (ACS). For the two generations spanning from 1996 to 2012, there were 226 SEUs combined. The satellite fleets are referred to in this paper as A and B. Of these, fleet A experienced 28 SEUs, an average of 5.6 SEUs per satellite, and fleet B experienced 198, an average of 66 SEUs per satellite. SEUs are particularly interesting types of anomalies because they are hard to predict and, as our results show, dependent on hardware. As hardware technological capabilities grow and component form factors shrink, satellites are becoming increasingly more susceptible to radiation effects such as charging, radiation damage, and SEUs [1]. SEUs occur when highly energetic particles penetrate the surface and deposit charge into the electronics of a satellite [2]. Particles with energies greater than 10 MeV are capable of penetrating the surface of a satellite, and can produce damage equivalent to years of normal on-orbit operation [1]. In severe cases, SEUs can cause satellites to lose control and tumble, potentially leading to satellite failure. The two main sources of particles that cause SEUs are solar energetic protons and galactic cosmic rays (GCRs); the particles trapped within the magnetosphere do not possess sufficient energy to cause SEUs
for GEO communication satellites [3]. High-energy solar protons originate from coronal mass ejections (CMEs). The Sun emits CMEs at speeds of 1000 km/s. These particles take only 1.5 to 2 days to reach Earth [1] [4], and when the particles reach satellites at geostationary orbit they can cause SEUs and significantly contribute to solar array
degradation [5].
High-energy protons can penetrate the Earth's magnetic field at the poles, crash into neutral atmospheric particles, and produce ion and electron pairs that temporarily increase the plasma density in the lowest regions of the ionosphere. This causes absorption of short-wave radio signals and widespread blackout of communications, sometimes called a polar cap absorption event. In addition, hazardous levels of high-energy particle radiation build up in the magnetosphere; this radiation can damage spacecraft microelectronics and pose a serious threat to the safety of astronauts. Energetic proton events can cause increased noise in photonics, total radiation dose problems, power panel damage, and single event upsets.
GCRs consist mostly of protons (84% hydrogen) along with alpha particles (15% Helium) and less than 1% of heavier nuclei [3] [1]. GCRs have energies up to 1014 MeV and occur out of phase with the eleven year solar cycle; the radiation from GCRs peaks at solar minimum and reaches a minimum at solar maximum [3] [6]. At solar minimum, the solar winds are low and allow GCRs to reach the magnetosphere. This does not usually occur at solar maximum because the solar winds inhibit the GCRs from entering a trajectory towards the magnetosphere and the geostationary satellites. We do not assess GCR data in this study, but plan address GCRs in future work, as strong GCRs can also cause significant SEUs [7]. While it is clear that both high-energy solar protons and GCRs are capable of causing SEUs, our analysis of Inmarsat’s SEU data shows that sensitivity to SEUs is also a function of differences in hardware. Although the satellite fleets under consideration here have consistent designs within a fleet, it is important to also recognize that multiple copies of a single hardware device produced from a single manufacturer have been found to vary by as much as 15% [8].
To date, Inmarsat has not had any extended service interruptions, permanent equipment failures or suffered any reduction in satellite lifetime directly attributable to SEUs. While SEUs are challenging to predict, the Inmarsat satellites make use of automatic on-board error detection and correction functions, coupled with the use of automated ground system monitoring.
In Section 2 we analyze solar proton events and their occurrence rates throughout the 11-year solar cycle. In Section 3 we assess the SEUs on satellite fleet A and satellite fleet B, and statistically correlate them to the solar proton events
discussed in Section 2. We summarize our results and discuss our conclusions in Section 4.
II. S
OLAR PROTON EVENTSLarge solar proton events (SPEs), while fairly uncommon, can cause severe radiation damage to spacecraft, because they excite protons and heavy ions to high energy levels capable of penetrating surrounding structures and shielding of satellite electronics. The energy levels required for this form of penetration are approximately 50–100 MeV/nucleon [8], however particles at 10 MeV can also contribute to surface charging and SEUs [1].
For this study, the solar proton event data comes from the
NOAA Space Weather Prediction Center
(http://www.swpc.noaa.gov/ftpdir/indices/SPE.txt). For each event, the proton fluxes are integrated five-minute averages recorded from Geostationary Operational Environmental Satellites (GOES), which have monitored and reliably collected space environment data since 1976. The start of a proton event is defined when three consecutive proton fluxes are recorded at a rate greater than or equal to ten particle flux units (pfu), where one pfu is a rate of one particle per square centimeter of detector area per steradian of solid angle scanned per second of time. The end of a proton event is the last instance the rate is above ten pfu. This definition accounts for multiple proton flares or interplanetary shock increases within one proton event.
In this section, we compare the occurrence of solar proton events to the solar cycle. Figure 1 shows the smoothed sunspot number and the 10 MeV–10,000 MeV solar proton events between 1996 and 2012. The sunspot number is a metric used to assess the overall strength and fluctuation of solar activity, such as solar flares and CMEs. The increase and decrease in sunspot number defines the solar maximum and solar minimum. At solar maximum there is an increased chance of solar flares, coronal mass ejections and other solar phenomena. However, even at solar minimum the Sun can produce damaging storms [9]. The solar magnetic activity cycle has a period of approximately eleven years.
Figure 1: The solar cycle, the severity of SPEs, and the annual number of SPEs.
Solar proton events that involve 10 MeV particles with arrival rates greater than 10 pfu are considered significant events [10]. A list of solar proton events for particles between 10 MeV and 10,000 MeV and with rates greater than 10 pfu were recorded and can be found in Appendices A—D. The strongest and most frequent SPEs occur when the sunspot number is at a maximum; this is known as solar maximum, and occurs between 1998 and 2002.
In 2001 there were 22 SPEs and in 2002 there were 19 SPEs; these two years had the highest number of SPEs between 1996 and 2012. In 2001 and 2002, five of the six most severe SPEs, measuring 12,900 to 31,700 pfu, occurred during solar maximum. Significantly fewer SPEs occurred at solar minimum: from 2007 to 2009 there were zero SPEs.
For a seasonal perspective, the distribution of SPEs per month is shown in Figure 2. The highest number of SPEs occurred in November with sixteen SPEs. Interestingly for SEUs (instead of SPEs), the season around northern hemisphere winter solstice is the period of time with the fewest SEUs [5]. The months with the second highest number of SPEs were April and July, which both had twelve SPEs. For the northern hemisphere, April is just after vernal equinox, and July is just after summer solstice.
Figure 2: The number of SPEs per month measured from GOES, dates attached in Appendix A – Appendix D
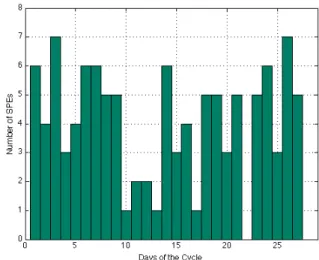
Figure 3 shows the distribution of SPEs during the Bartels cycle. The Bartels cycle, similar to the Carrington cycle, is the 27-day cycle of the Sun’s rotation [11]. There is no obvious trend for this distribution. The day with the highest number of SPEs occurred on the third and 26th day of the Bartels cycle, and the day with the fewest number of SPEs occurs on the 22nd
day of the cycle.
Figure 3: The number of SPEs per day of Bartels cycle measured from GOES, dates attached in Appendix A – Appendix D
III. S
INGLE EVENT UPSETSThe causal relationship between high-energy protons and single event upsets has been studied since 1979, when two separate papers, Guenzer et al. and McNulty et al., presented evidence that high-energy protons were capable of causing SEUs [2]. A follow-up study analyzed the correlation between SEUs and the space environment that occurred on the NASA’s Tracking and Delay Relay Satellite System (TDRS-1) from 1984 to 1990 [3]. Similar to Inmarsat, TDRS-1 was designed to provide communications and high-data rate transmission services. Wilkinson [3] finds that protons with energies greater than 10 MeV—40 MeV tend to induce SEUs, and that SEUs are most likely to occur when protons with energies >50 MeV exceed a rate of 10 pfu [13]. However, Tylka et al. [8] states that in order to do a thorough correlation analysis of SEUs, both solar protons and heavy ions must be investigated.
The composition of the solar wind is a mixture of materials found in the solar plasma, ionized hydrogen (electrons and protons) with an 8% component of helium (alpha particles) and trace amounts of heavy ions and atomic nuclei: C, N, O, Ne, Mg, Si, S, and Fe that were ripped apart by heating of the Sun's outer atmosphere, the corona [12]. This study only attempts to correlate solar protons to SEUs; analysis of alpha particles and heavy ions are planned in future work.
Figure 4 shows the distribution of SEUs per month. The highest number of SEUs occurs in April, followed by May. As shown in Figure 2, April was the month with the second highest number of SPEs, after November, which had the highest number of SPEs. For SEUs, November had the fourth lowest number of SEUs, followed by December, June, and February, which had the fewest number of SEUs.
Figure 4: The number of SEUs per month measured from GOES, dates attached in Appendix A – Appendix D.
Choi et al. (2012) found that the majority of satellite anomalies occurred in spring (March-May) and fall (September – October). While we cannot state that all types of anomalies follow this trend, the occurrence of the majority of SEUs on Inmarsat’s satellite fleets are consistent with the results in Choi et al., and occur in the spring and fall [13].
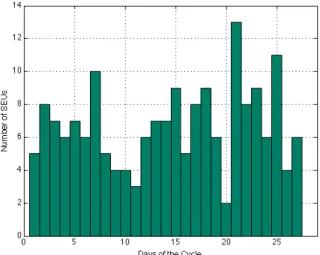
Figure 5 shows the distribution of SEUs during the Bartels 27-day solar cycle. Similar to Figure 3, there does not seem to be any clear and consistent trends for SEUs during the Bartels solar cycle. The day with the highest number of SEUs occurs on the 21st day of the cycle, and the day with the fewest number of SEUs occurs on the 20th day of the cycle.
Figure 5: The number of SEUs per day of Bartels cycle measured from GOES, dates attached in Appendix A – Appendix D
SEUs can occur at any time during the solar cycle, but tend to occur nearer to solar minimum, as shown in Figure 6, which is consistent with previous investigations [14] [15].
As discussed in Section II, Figure 1 shows that more solar proton events occur at solar maximum than at solar minimum. Figure 6 shows the SEUs that occurred on Fleet A between 1996 and 2012; the different colors represent the five different satellites in fleet A. The SEUs tend to occur most often at solar minimum. Specifically, the largest number of SEUs per year occurred in 1997, 2005 and 2009. However, between 1998 and 2000, the years leading up to solar maximum, there were also high levels of SEUs, and there were no SEUs in both 2001 near solar maximum as well as in 2008, near solar minimum.
Figure 6: The solar cycle and the annual number of SEUs per satellite for satellite fleet A. The different colors represent the five different satellites in fleet A.
One possible explanation why there are zero SEUs at the 2008 solar minimum is the fact that there are only a few SEU events for satellite fleet A. Satellite fleet A only experienced 28 total SEUs, in comparison with fleet B, which experienced 198 SEUs. Figure 7 is a scatter plot of the twenty-eight SEUs that occurred on fleet A. The SEUs are shown as a black asterisk for solar proton events ranging from 10–10,000 MeV and rates greater than 10 pfu. There were zero SPEs between 2006 and 2010, which is approximately solar minimum.
As shown in Figure 1, a high concentration of SPEs occurs during solar maximum, or between 1998 and 2002. During this time, ten of the twenty-eight SEUs on fleet A occur. The other eighteen SEUs occur during the solar minimum of Cycle 23 and Cycle 24.
Table 1 shows the SEUs on Satellite fleet A that occur one day, one week, two weeks, and one month before solar proton events ranging from 10 MeV to 10,000 MeV with rates greater than 10 pfu.
Table 1: Fleet A SEUs that occur 1 day, 1 week, 2 weeks, and 1 month before solar proton events of 10 MeV – 10,000 MeV with rates greater than 10 pfu
Solar Proton Events
The number of SEUs that occur before an SPE on fleet A < 1 day before < 1 week before < 2 weeks before < 1 month before 10 MeV 0 0 0 6 100 MeV 0 2 3 3 1,000 MeV 0 1 1 2 10,000 MeV 0 0 0 0
Fleet A encountered 28 SEUs, and eleven of these occurred up to one month before an SPE. Of these eleven, four SEUs occurred two weeks before an SPE and three occurred one week before an SPE. No events occurred one day before an SPE. Should a single SEU occur within one month of both a 10 MeV SPE and within one month of a later 100 MeV SPE it is counted twice, once for each of the different energy levels.
Table 2 shows the number of SEUs on fleet A that occur after an SPE for the same periods of time in Table 1.
Table 2: Fleet A SEUs that occur 1 day, 1 week, 2 weeks, and 1 month after solar proton events of 10 MeV – 10,000 MeV with rates greater than 10 pfu
Solar Proton Events
SEU occurs after the following periods of SPE on fleet A < 1 day after < 1 week after < 2 weeks after < 1 month after 10 MeV 0 2 2 5 100 MeV 0 1 1 2 1,000 MeV 0 1 1 1 10,000 MeV 1 1 1 1
Of the 28 SEUs encountered by fleet A, nine SEUs occurred one month after a solar proton event. Out of these nine SEUs, five occurred two weeks and five occurred one week after an SPE, and one SEU occurred one day after an SPE.
The number of SEUs that occurred within the specified periods of an SPE for does not necessarily suggest that a significant relationship exists between the occurrence of an SEU and SPEs. While coronal mass ejections take approximately 1.5—2 days to reach Earth, the amount of time between interactions of energetic particles with components that may eventually lead to a SEU is not well understood. The data shown here look at these statistics to get a sense for the general occurrence rates. Figure 8 shows the smoothed sunspot number and the annual
number of SEUs for satellite fleet B. Fleet B experienced 198 SEUs between 1996 and 2012. The first SEU occurred in 2005, at a period near solar maximum.
Figure 7: Fleet A SEUs plotted with 10—10,000 MeV SPEs that have rates greater than 10 pfu from 1996—2012. The red circles are 10,000 MeV SPEs, the orange squares are 1,000 MeV SPES, the green squares are 100 MeV SPEs, the blue diamonds are 10 MeV SPEs and the black asterisks are SEUs. Eighteen of the twenty-eight SEUs on Fleet A occur at period of solar minimum, ten SEUs occur at solar maximum.
Figure 8: The solar cycle and the annual number of SEUs per satellite for satellite fleet B. The six different colors represent the local and remote computers on each of the three satellites in fleet B. An inverse correlation exists between the solar cycle and SEUs.
For fleet B, it is clear that more SEUs occur during solar minimum, compared with solar maximum. This inverse relationship strongly suggests that the single event upsets were not primarily caused by solar energetic protons, as we have shown in Figure 1 that more solar proton events occur at solar maximum. Thus, a more likely source of these SEUs could be GCRs, which primarily occur at solar minimum [1].
Similar to Figure 7, Figure 9 is a scatter plot of the SEUs, shown with a black asterisk, and the 10 MeV—100 MeV SPEs with rates greater than 10 pfu for fleet B.
The highest concentration of SEUs for fleet B occurs between 2006 and 2012, and coincides with more than four years of zero severe SPE activity. The years 2006 to 2012 also span across solar minimum.
Table 3 shows the SEUs on Satellite fleet B that occur one day, one week, two weeks, one month before solar proton events ranging from 10 MeV to 10,000 MeV with energy greater than 10 pfu.
Table 3: Fleet B SEUs that occur 1 day, 1 week, 2 weeks, and 1 month before solar proton events of 10 MeV – 10,000 MeV with rates greater than 10 pfu
Solar Proton Events
SEU occurs before the following periods of SPE on fleet B < 1 day before < 1 week before < 2 weeks before < 1 month before 10 MeV 0 4 7 19 100 MeV 0 1 3 6 1,000 MeV 0 1 2 8 10,000 MeV 0 0 0 0
Of the 198 SEUs that occurred on fleet B, 33 occurred one month before an SPE. Twelve of the 33 SEUs occurred two weeks before an SPE, and six occurred one week before an SPE. Zero SEUs occurred one day before an SPE.
Figure 9: Fleet B SEUs plotted with 10—10,000 MeV SPEs that have rates greater than 10 pfu from 1996—2012. The red circles are 10,000 MeV SPEs, the orange squares are 1,000 MeV SPES, the green squares are 100 MeV SPEs, the blue diamonds are 10 MeV SPEs and the black asterisks are SEUs. A clear inverse correlation exists between the occurrence of SEUs and SPEs, as only 33 of the 198 SEUs on Fleet B occurred one month before an SPE.
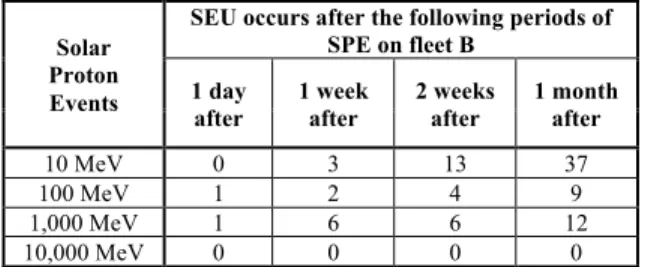
Table 4 shows the number of SEUs on fleet B that occur after the same periods of time in Table 3.
Table 4: Fleet B SEUs that occur 1 day, 1 week, 2 weeks, and 1 month after solar proton events of 10 MeV – 10,000 MeV with rates greater than 10 pfu
Solar Proton Events
SEU occurs after the following periods of SPE on fleet B
1 day
after 1 week after 2 weeks after 1 month after
10 MeV 0 3 13 37 100 MeV 1 2 4 9 1,000 MeV 1 6 6 12 10,000 MeV 0 0 0 0
Out of the total 198 SEUs, fifty-four SEUs occurred within one month of an SPE. Twenty-three of the fifty-four occur two weeks after an SPE, eleven SEUs occurred one week after an SPE, and two SEUs occurred one day after an SPE.
Figure 10 shows the age of the satellite at the time of the SEU from 1996 to 2012. There are eight total satellites but the eleven different colors portray the five satellites of fleet A and separately track the local and remote computers on the three satellites of fleet B. Throughout this time the total number of satellites increases from one to eight and therefore the age of the satellites in 2012 ranges from five to fifteen years old. Aside from an overall bifurcation between fleet A and fleet B, and the influence of the 11-year solar cycle, there does not appear to be an obvious correlation between SEUs and the age of the satellite. It has been suggested that satellite anomalies are more prevalent in the first two years of operation due to “burn-in” and transients from the launch and orbital positioning activities. However, based on Figure 10, this does not appear to be a substantial contributor to the SEUs on these two satellite fleets.
Figure 10: The age (years) of the five satellites in fleet A and the three satellites in fleet B at the time of the SEU. For fleet B the SEUs on the local and remote computers are plotted separately, which creates 11 separate categories,
rather than eight.
IV. C
ONCLUSIONSInmarsat has maintained nominal system operations through more than 226 single event upsets on two of its satellite fleets since 1996. Satellite fleet A experienced 28 SEUs, and satellite fleet B experienced 198 SEUs. The occurrence of these SEUs was compared to the occurrence of solar proton events. Ten MeV SPEs with rates greater than 10 pfu are considered significant and this level was used as the reference for defining an event in this study.
At solar maximum we show there are fewer SEUs than at solar minimum, which is when the largest number of SEUs occur. We also show that the largest number of SPEs occurred at solar maximum, and fewest at solar minimum. Therefore, SEUs on the Inmarsat fleet were not found to correlate to solar proton events.
There is not a clear correlation between SPEs or SEUs and the Bartels solar cycle or the month in which either of these phenomena occur.
For fleet A, eleven of the total twenty-eight SEUs occurred one month before an SPE. Of these eleven, four SEUs occurred two weeks before an SPE and three occurred one week before an SPE. No events occurred one day before an SPE. Nine SEUs occurred one month after an SPE. Five of these occurred two weeks after an SPE, five occurred one week after an SPE, and one occurred one day after an SPE. Although fleet A only experienced a total of 28 SEUs or 5.6 SEUs per satellite, from fleet A we conclude that SEUs do not appear to have a direct correlation with energetic proton events.
Adding to our analysis the data from fleet B, which had 198 SEUs, an average of 66 per satellite, we find a clear inverse relationship between SEUs and SPEs. This finding suggests that solar energetic protons did not primarily cause the SEUs. Thirty-three of the 198 SEUs occurred one month before an SPE. Twelve of the 33 SEUs occurred two weeks before an SPE, and six occurred one week before an SPE. Zero SEUs occurred one day before an SPE. Fifty-four SEUs occurred within one month after an SPE. Twenty-three of these occurred two weeks after an SPE, eleven occurred one week after an SPE, and two SEUs occurred one day after an SPE.
We also note that there is not a clear correlation between SEUs and the age of the satellite.
The next step in this work is to investigate the correlation between SEUs and GCRs as a function of the 11-year solar cycle, as well as to consider correlations between SEUs and heavier elements. Further, the results appear to show a notable difference in the susceptibility of fleet A and fleet B to SEUs. Closer analysis and attention paid to the particular subsystems and components most susceptible to SEUs would be valuable
in explaining this difference and providing information about what mitigation methods can be employed, and information about which materials are susceptible to which types and energies of particles.
A
CKNOWLEDGMENTSWe would like to thank NSF, Inmarsat, and MIT for supporting this work. We would also like to thank Janet Greene, Dan Baker, Mark Dickinson, Marcus Vilaca, Cathryn Mitchell, Joe Kinrade, the Invert Center for Imaging Science at the University of Bath, Trey Cade, the Inmarsat Spacecraft Analysts, and Dr. Fred DeJarnette for their support. Furthermore, we would like to thank NOAA for access to their solar proton event database.
R
EFERENCES[1] Baker, D.N., The occurrence of operational anomalies in spacecraft and their relationship to Space Weather, IEEE Transactions on Plasma Science, 28(6), pp. 2007-2016, 2000. [2] Peterson, E., Approaches to proton single-event rate
calculations, IEEE Transactions on Nuclear Science, 43(2), pp. 496-504, 1996.
[3] Wilkinson, D., TDRS-1 single event upsets and the effect of the space environment, IEEE Transactions on Nuclear Science, 38(6), pp. 1708-1712, 1991.
[4] Baker, D.N., How to cope with space weather, Science, 297, pp. 1486-1487, 2002.
[5] Lohmeyer, W., Cahoy, K., and Baker, D.N., Correlation of GEO communication satellite anomalies and space weather phenomena: improved satellite performance and risk mitigation, paper presented at 30th AIAA International Communications
Satellite Systems Conference (ICSSC), Ottawa, Canada, 2012. [6] Riley, Pete. “On the probability of occurrence of extreme space
weather events” AGU Space Weather, Vol. 10, SO2012. [7] Baker, D.N. “What is space weather?” Advances in Space
Research 22.1, pp. 7-16, 1998.
[8] Tylka, Allan J., William F. Dietrich, Paul R. Boberg, Edward C. Smith, and James H. Adams. "Single event upsets caused by solar energetic heavy ions." IEEE Transactions on Nuclear Science, 43.6, pp. 2758-766, 1996.
[9] Cole, David G., “Space weather: its effects and predictability” Space Science Reviews 107, pp. 295-302, 2003.
[10] Gopalswamy, N., Yashiro, S., and Akiyama, S., “Coronal mass ejections and space weather due to extreme events, paper presented at International Living With A Star (ILWS) Workshop”, Goa, India, 2006.
[11] Bartel, J. “Twenty-seven day recurrences in terrestrial-magnetic and solar activity, 1923-1933”, Terrestrial Magnetism and Atmospheric Electricity, 33(3): 201-201a, 1934.
[12] Feldman, U., Schühle, U., Widing, K. G., & Laming, J. M. “Coronal composition above the solar equator and the North Pole as determined from spectra acquired by the SUMER Instrument on SOHO, The Astrophysical Journal, 505, pp. 999-1006, 1998.
[13] Choi, H.S., et. al., “Analysis of GEO spacecraft anomalies: Space weather relationships”, Space Weather, 9, pp.1-12, 2012. [14] Wilkinson, D.C., Shea, M.A., and Smart, D.F., “A case history
of solar and galactic space weather effects on the GEO
COMSAT TDRS-1”, Adv. Space Research, 26(1), pp. 27-30, 2000.
[15] Baker, D.N. “Effects of hostile space weather on satellite operations,” IEEE International Symposium on Electromagnetic Compatibility (EMC), pp. 306-311, 14-19 Aug. 2011.
B
IOGRAPHIESWhitney Q. Lohmeyer received a B.S. in Aerospace Engineering from North Carolina State University in 2011, and will obtain a Masters Candidate in Aerospace Engineering at Massachusetts Institute of Technology in February 2013. After obtaining her Masters she will pursue a PhD at MIT in Aerospace Engineering, researching the effect of the space environment on geostationary satellites.
Kerri Cahoy received a B.S. in Electrical Engineering from Cornell University in 2000, an M.S. in Electrical Engineering from Stanford University in 2002, and a Ph.D. in
Electrical Engineering from Stanford
University in 2008. After working as a Senior
Payload and Communication Sciences
Engineer at Space Systems Loral, she completed a NASA Postdoctoral Program Fellowship at NASA Ames Research Center and held a research staff appointment with MIT/NASA Goddard Space Flight Center. She is currently a Boeing Assistant Professor in the MIT Department of Aeronautics and Astronautics with a joint appointment in the Department of Earth and Planetary Sciences at MIT.
A
PPENDIXAppendix A: SPEs with Proton Flux > 10,000 MeV
Appendix B: SPEs with Proton Flux > 1,000 MeV
3" 1 day before 1 week before 2 weeks before 1 month before 10 MeV 0 3 7 24 100 MeV 0 3 6 9 1,000 MeV 1 2 2 10 10,000 MeV 0 0 0 0 37
Table 4 shows the number of SEUs on Fleet B that occur one day one week, two 38
weeks, and one month after a solar proton event ranging between 10 MeV and 10,000 39
MeV with energies of greater than 10 pfu. 40
41
Table 4: Fleet B SEUs that occur one day, one week, two weeks, and one month after
42
solar proton events of 10 MeV – 10,000 MeV with energy greater than 10 pfu 43
Solar Proton Events
SEU occurs after the following periods of SPE on fleet B
1 day after 1 week after 2 weeks after 1 month after
10 MeV 0 5 14 42 100 MeV 1 3 5 11 1,000 MeV 1 7 7 13 10,000 MeV 1 1 1 1 44 x 45 Appendix 46
Appendix A: SPEs with Proton Flux > 10,000 MeV
47 48
Date Year Proton Flux
15-Jul 2000 24000 9-Nov 2000 14800 25-Sep 2001 12900 6-Nov 2001 31700 24-Nov 2001 18900 29-Oct 2003 29500 49 50
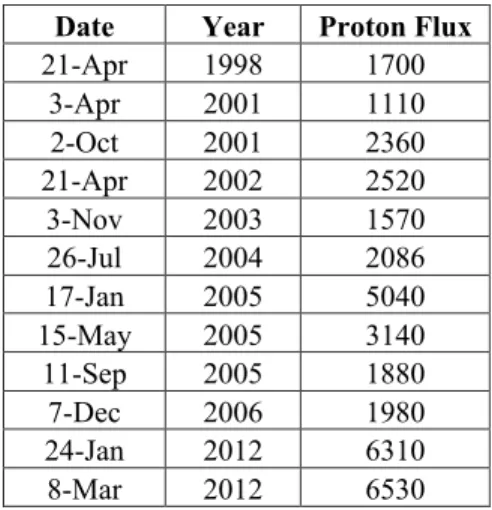
Appendix B: SPEs with Proton Flux > 1,000 MeV
51 52
Date Year Proton Flux
21-Apr 1998 1700 3-Apr 2001 1110 2-Oct 2001 2360 21-Apr 2002 2520 3-Nov 2003 1570 26-Jul 2004 2086 17-Jan 2005 5040 15-May 2005 3140
3"
1 day
before 1 week before 2 weeks before 1 month before
10 MeV 0 3 7 24
100 MeV 0 3 6 9
1,000 MeV 1 2 2 10
10,000 MeV 0 0 0 0
37
Table 4 shows the number of SEUs on Fleet B that occur one day one week, two 38
weeks, and one month after a solar proton event ranging between 10 MeV and 10,000 39
MeV with energies of greater than 10 pfu. 40
41
Table 4: Fleet B SEUs that occur one day, one week, two weeks, and one month after
42
solar proton events of 10 MeV – 10,000 MeV with energy greater than 10 pfu 43
Solar Proton Events
SEU occurs after the following periods of SPE on fleet B
1 day after 1 week after 2 weeks after 1 month after
10 MeV 0 5 14 42 100 MeV 1 3 5 11 1,000 MeV 1 7 7 13 10,000 MeV 1 1 1 1 44 45 46
Appendix B: SPEs with Proton Flux > 1,000 MeV
47 48
Date Year Proton Flux
21-Apr 1998 1700 3-Apr 2001 1110 2-Oct 2001 2360 21-Apr 2002 2520 3-Nov 2003 1570 26-Jul 2004 2086 17-Jan 2005 5040 15-May 2005 3140 11-Sep 2005 1880 7-Dec 2006 1980 24-Jan 2012 6310 8-Mar 2012 6530 49 50 51 52 53 54 55
Appendix C: SPEs with Proton Flux > 100 MeV Appendix D: SPEs with Proton Flux > 10 MeV 4" 11-Sep 2005 1880 7-Dec 2006 1980 24-Jan 2012 6310 8-Mar 2012 6530 53 54
Appendix C: SPEs with Proton Flux > 100 MeV
55 56
Date Year Proton Flux
7-Nov 1997 490 2-May 1998 150 6-May 1998 210 26-Aug 1998 670 14-Nov 1998 310 13-Sep 2000 320 26-Nov 2000 940 11-Apr 2001 355 15-Apr 2001 951 18-Apr 2001 321 16-Aug 2001 493 26-Dec 2001 779 31-Dec 2001 108 23-May 2002 820 17-Jul 2002 234 24-Aug 2002 317 7-Sep 2002 208 10-Nov 2002 404 29-May 2003 121 26-Oct 2003 466 5-Nov 2003 353 14-Sep 2004 273 8-Nov 2004 495 15-Jul 2005 134 23-Aug 2005 330 13-Dec 2006 698 28-Jan 2012 796 17-May 2012 255 18-Jul 2012 136 57 58
Appendix D: SPEs with Proton Flux > 10 MeV
59 60
Date Year Proton Flux
4-Nov 1997 72
25-Sep 1998 44
4"
Appendix D: SPEs with Proton Flux > 10 MeV
56 57
Date Year Proton Flux
4-Nov 1997 72 25-Sep 1998 44 8-Nov 1998 11 23-Jan 1999 14 25-Apr 1999 32 5-May 1999 14 2-Jun 1999 48 4-Jun 1999 64 18-Feb 2000 13 5-Apr 2000 55 8-Jun 2000 84 10-Jun 2000 46 22-Jul 2000 17 28-Jul 2000 18 11-Aug 2000 17 16-Oct 2000 15 26-Oct 2000 15 29-Jan 2001 49 30-Mar 2001 35 28-Apr 2001 57 8-May 2001 30 16-Jun 2001 26 10-Aug 2001 17 15-Sep 2001 11 19-Oct 2001 11 22-Oct 2001 24 20-Nov 2001 34 29-Dec 2001 76 11-Jan 2002 91 15-Jan 2002 15 20-Feb 2002 13 17-Mar 2002 13 19-Mar 2002 53 20-Mar 2002 19 23-Mar 2002 16 17-Apr 2002 24 7-Jul 2002 22 19-Jul 2002 13 23-Jul 2002 28 14-Aug 2002 26 22-Aug 2002 36 31-May 2003 27
5" 19-Jun 2003 24 22-Nov 2003 13 2-Dec 2003 86 11-Apr 2004 35 20-Sep 2004 57 1-Nov 2004 63 14-Aug 2010 14 8-Mar 2011 50 22-Mar 2011 14 7-Jun 2011 72 5-Aug 2011 96 9-Aug 2011 26 26-Sep 2011 35 27-Nov 2011 80 27-May 2012 14 16-Jun 2012 14 7-Jul 2012 25 12-Jul 2012 96 58 59