Characterization of a
Reconstituted Low Plasticity Silt
byJohn Thomas Grennan
National Certificate in Civil and Environmental Engineering Galway-Mayo Institute of Technology, Galway, Ireland (2004)
MASSACHUSETTS INSTITUTE OF TECHNOLOGY
JUL 15 2010
LIBRARIES
ARCHIVES
Bachelor of Engineering (Ord.) in Civil and Environmental Engineering Galway-Mayo Institute of Technology, Galway, Ireland (2005)
Bachelor of Engineering (Hon.) in Civil and Environmental Engineering National University of Ireland Galway, Galway, Ireland (2007)
Submitted to the Department of Civil and Environmental Engineering in Partial Fulfillment of the Requirements for the Degree of
Masters of Science in Civil and Environmental Engineering
at the
MASSACHUSETTS INSTITUTE OF TECHNOLOGY
June 2010
0 2010 Massachusetts Institute of Technology. All rights reserved.
Signature of Author...
Pepartment of ivil and Environmental Engineering May 7, 2010
Certified by... ...
John T. Germaine Senior Research Associate and Senior Lecturer of Civil and Environmental Engineering hesis Supervisor
Accepted by... :...
Daniele Veneziano Chairman, Departmental Committee for Graduate Students
Characterization of a
Reconstituted Low Plasticity Silt
by
John Thomas Grennan
Submitted to the Department of Civil and Environmental Engineering on May 7, 2010 in Partial Fulfillment of the Requirements for the Degree of
Masters of Science in Civil and Environmental Engineering
ABSTRACT
During a major upgrade of the wastewater infrastructure in Skibbereen, Co. Cork, Ireland, there were many challenges during construction. Many of these difficulties were associated with the soft silt ground conditions. Consequently, soil samples were sourced from the location and transported to MIT for the purposes of this research.
This thesis investigates the characteristics of the low plasticity silt encountered at Skibbereen to allow an understanding of the soil behavior and help explain some of the difficulties encountered during construction. The research program is divided up into two major components: 1) Index property testing; and 2) Engineering property testing. The index property testing defines the material as a well graded low plasticity silt with very low salt and organic contents.
An extensive testing program is undertaken using Constant Rate of Strain (CRS), Hydraulic Conductivity, Ko-Consolidated Direct Simple Shear (CKoDSS), and Isotropic and Ko-consolidated undrained triaxial compression (CIUC and CKoUC) tests to define the engineering properties of the material.
The experimental investigation finds that undercompaction is the best reconstitution technique for this material and it is almost impossible to test intact samples. The CRS tests demonstrate that the compression ratio increases with an increase in stress level but the recompression and swelling ratio are not significantly affected. The hydraulic conductivity results fit into the expected range for silt material and they are dependent on stress level. The DSS tests demonstrate that the undrained strength ratio (su/a',) increases with an increase in stress level. A similar trend is found for the peak arctan rh/uav (4'p)
values. Overconsolidated tests prove that the SHANSEP framework can be successfully used for this material and the cyclic tests demonstrate that an increase in density through shearing will provide a dramatically higher su/a'v and greater ductility.
The triaxial compression tests indicate that su/Y'v will increase with an increase in stress level. In the CIUC tests, ductility and the degree of dilation increase with an increase in stress level. However, the
CKOUC tests provide more consistent data at all stress levels and the su/a', friction angle, and modulus is
lower than the CIUC counterpart.
Thesis Supervisor: John T. Germaine
ACKNOWLEDGEMENTS
I would like to express my sincere gratitude to my thesis supervisor, research advisor, and
academic advisor Dr. John T. Germaine. His never ending patience through the multitude of testing problems was amazing. His guidance and motivation throughout my time at MIT is greatly appreciated and will never be forgotten. Despite his extensive workload, the door was always open for questions. I owe all my laboratory skills to him and I have learned from the best in the business. I entered MIT with a research advisor and I leave with a good friend.
I would like to thank Ward and Burke Construction Ltd. for sponsoring this research and making
my degree possible. In particular, I am indebted to Robert Ward (MIT SM 89'). His confidence in my ability, guidance through the application process, and encouragement through the early
stages of life in MIT were invaluable.
My gratitude goes to the fantastic faculty at MIT that I have learned from and worked for.
Professor Andrew J. Whittle, Professor Herbert H. Einstein, and Dr. Lucy Jen gave me knowledge and tools that I will use for the rest of my career. I would like to thank Dr. Jen for the advice she gave me on numerous occasions.
My gratitude also extends to all the staff of the CEE department for their assistance and
friendship during my time in MIT.
For the multitude of friends I have made, I am not sure where to start. I moved to Boston knowing no one and I leave MIT with an endless list. I would first like to thank the geotechnical community of MIT. It is unfair to mention names from so many. However, extra thanks is needed for Naeem Abdulhadi for his help in the lab during my first few months at MIT, Brendan Casey for keeping the Irish contingent strong and the friendly banter on a daily basis, and Cullen Jones. Cullen and I started MIT together, worked together, and will graduate together. His help,
friendship, and attitude to work were an inspiration. I wish him all the best in the future.
I would like to thank my many friends outside the geotechnical department, they have thought
me to leave the pressures of work for a few hours and relax. Thanks to Francais 0' Sulliivan for the many fitness and ensuing "hydration" sessions. My gratitude also goes to the Irish Association of MIT, the Unbelievable's soccer team, and the Kerry Boston Football club. I have made some lifelong friends.
I would also like to thank all my friends at home for their constant support.
My sincere gratitude to Sheena Dwyer for her friendship, the best memories of the last two years
has been spent with her.
Finally I would like to thank all my family, especially my mother Ann and brother David, I sometimes take for granted their endless encouragement, consolation, and support. It is truly appreciated and loved.
To my father, the late John Francais Grennan, our short time together has given me the wisdom and courage to make the most out of life.
Table of Contents
Abstract 3 Acknoledgements 5 Table of Contents 9 List of Tables 17 List of Figures 19 List of Symbols 311 INTRODUCTION
35
1.1 BACKGROUND 351.2 RATIONALE FOR CHARACTERIZATION OF LOW PLASTICITY SILT
FROM SKIBBEREEN 36
1.3 RESEARCH OBJECTIVES AND SCOPE 37
1.4 ORGANIZATION OF THE THESIS 39
2
BACKGROUND
41
2.1 INTRODUCTION 41 2.2 SKIBBEREEN 42 2.2.1 Introduction 42 2.2.1.1 River Ilen 43 2.2.1.2 Caol Stream 44 2.2.1.3 March Field 44 2.3 GEOLOGY 45 2.3.1 Introduction 45 2.3.2 Topography 45 2.3.3 Rock Types 45 2.3.3.1 Precambrian Rocks 462.3.3.2 The Lower Palaeozoic Rocks 46
2.3.3.3 Caledonian Movement 47
2.3.3.5 Carboniferous Rocks 48
2.3.4 Geological Events after the Carboniferous Period 49
2.3.4.1 Variscan Deformation and Metamorphism 49
2.3.4.2 The Quaternary Period 50
2.3.4.3 The Holocene 51
2.3.5 Geology in Skibbereen today 52
2.3.5.1 Skibbereen town 52 2.3.5.2 Skibbereen Environs 52 2.3.5.3 Marsh Area 53 2.4 PROJECT DESCRIPTION 53 2.4.1 Introduction 53 2.4.2 Caisson Construction 54 2.4.3 Trenchless Technology 55
2.4.3.1 Horizontal Directional Drilling 55
2.4.3.2 Auger Boring 55
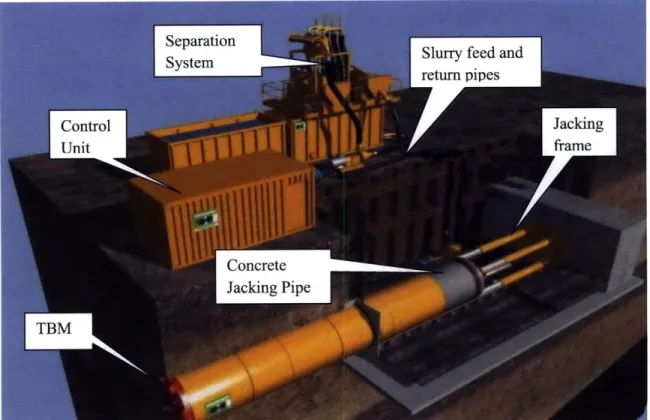
2.4.3.3 Microtunneling 56
2.4.4 Field Operation 57
2.4.4.1 Caissons 57
2.4.4.2 Earthworks 57
2.4.4.3 Pipe lines and tunnels 58
2.5 SITE INVESTIGATION AND LABORATORY TESTING 61
2.5.1. Original Testing Program 61
2.5.2. Further Investigation 63
3
LITERATURE REVIEW
95
3.1 INTRODUCTION 95
3.2 RECONSTITUTION 97
3.2.1 Introduction 97
3.2.2 Most Tamping (Undercompaction) 97
3.2.4 Air and Water Pluviation 103 3.2.5 Fabric 104 3.3 SAMPLING 106 3.3.1 Introduction 106 3.3.2 Sampling Techniques 106 3.4 CONSOLIDATION PROPERTIES 109 3.5 STRESS-STRAIN-STRENGTH PROPERTIES 110 3.5.1 Introduction 110
3.5.2 Shear strength from triaxial tests - Failure criterion 111
3.5.3 Undrained Compression tests (UU) 112
3.5.4 Isotropically Consolidated Undrained triaxial tests 113
3.5.5 Anisotropically Consolidated Undrained triaxial tests 115
3.5.6 K0 Consolidated Undrained triaxial tests 115
3.5.7 K. Consolidated Undrained Direct Simple Shear tests (CKODSS) 116 3.5.8 Overconsolidation ratio and normalized behavior 116
3.6 LIQUEFACTION AND CYCLIC SHEAR RESISTANCE 118
4
MATERIAL PROCESSING, RECONSTITUTION, EQUIPMENT, AND
TESTING PROCEDURES
145
4.1 INTRODUCTION 145
4.2 MATERIAL PROCESSING 146
4.2.1 Introduction 146
4.2.2 Samples for Laboratory Testing at MIT 147
4.2.3 Processing 148 4.3 RECONSTITUTION 150 4.3.1 Introduction 150 4.3.2 Resedimentation 150 4.3.2.1 Introduction 150 4.3.2.2 Resedimentation Procedure 152
4.3.2.3 Resedimentation Problems 153 4.3.2.4 Resedimentation Evaluation 154 4.3.3 Undercompaction 155 4.3.3.1 Introduction 155 4.3.3.2 Procedure 155 4.3.3.3 Undercompaction Problems 157 4.3.3.4 Undercompaction Evaluation 158 4.4 EQUIPMENT 158 4.4.1 Introduction 158 4.4.2 Measurement Instrumentation 158 4.4.2.1 Load Cells 159
4.4.2.2 Axial Displacement Transducers 159
4.4.2.3 Pressure Transducers 159
4.4.2.4 Volume Change Transducers 159
4.4.3 Data Acquisition System 160
4.4.4 Computer Control System 161
4.5 TESTING PROCEDURES 162
4.5.1 Introduction 162
4.5.2 Characterization 163
4.5.2.1 Introduction 163
4.5.2.2 Grain size analysis 163
4.5.2.3 Atterberg Limits 163
4.5.2.4 Specific Gravity 164
4.5.2.5 Salinity 164
4.5.2.6 Organic Content 165
4.5.3 Constant Rate of Strain (CRS) Tests 166
4.5.3.1 Introduction 166
4.5.3.2 Procedure 168
4.5.3.3 Problems 169
4.5.4.1 Introduction 170
4.5.4.2 Procedure 171
4.5.4.3 Problems 172
4.5.5 Direct Simple Shear Tests 173
4.5.5.1 Introduction 173 4.5.5.2 Procedure 174 4.5.5.3 Problems 175 4.5.6 Triaxial Tests 175 4.5.6.1 Introduction 175 4.5.6.2 Procedure 176 4.5.6.3 Problems 179
5
CHARACTERIZATION, CONSOLIDATION, AND HYDRAULIC
CONDUCTIVITY
213
5.1 INTRODUCTION 213
5.2 INDEX PROPERTIES 214
5.2.1 Introduction 214
5.2.2 Grain Size Distribution 214
5.2.3 Atterberg Limits 214
5.2.4 Specific Gravity, Organic Content, and Salt Concentration 215 5.2.5 Scanning Electron Microscope Images and Mineralogy 215
5.3 CONSOLIDATION BEHAVIOR 216
5.3.1 Introduction 216
5.3.2 Constant Rate of Strain Tests 217
5.3.3 Direct Simple Shear Tests 221
5.3.4 Triaxial Tests 223
5.3.4.1 Introduction 223
5.3.4.2 Series A tests - Isotropically consolidated 223
5.3.4.3 Series B tests - Ko consolidated 225
5.3.5 Stiffness in Consolidation 227
6
DIRECT SIMPLE SHEAR AND UNDRAINED TRIAXIAL
COMPRESSION BEHAVIOR
265
6.1 INTRODUCTION 265
6.2 DIRECT SIMPLE SHEAR 266
6.2.1 Introduction 266
6.2.2 Normally Consolidated (NC) Behavior 267
6.2.2.1 Shear Stress-Strain Behavior 267
6.2.2.2 Effective Stress Behavior 268
6.2.2.3 Stiffness 269
6.2.2.4 Specimens with different initial densities 269
6.2.3 Overconsolidated (OC) Behavior 271
6.2.3.1 Shear Stress-Strain Behavior 271
6.2.3.2 Effective Stress Behavior 272
6.2.3.3 Stiffness 272
6.2.3.4 SHANSEP Equation for DSS 273
6.2.4 Cyclic Behavior 273
6.2.4.1 Introduction 273
6.2.4.2 Shear Stress-Strain Behavior 274
6.2.4.3 Effective Stress Behavior 275
6.2.4.4 Cyclic Behavior 276
6.3 ISOTROPICALLY CONSOLIDATED UNDRAINED TRIAXIAL
COMPRESSION (CIUC) TESTS (SERIES A) 277
6.3.1 Introduction 277
6.3.2 Shear Stress-Strain Behavior 278
6.3.3 Effective Stress Behavior 279
6.3.4 Stiffness 281
6.3.5 Summary of behavior 282
6.4 Ko- CONSOLIDATED UNDRAINED TRIAXIAL COMPRESSION (CKoUC)
TESTS (SERIES B) 283
6.4.2 Shear Stress-Strain Behavior 284
6.4.3 Effective Stress Behavior 285
6.4.4 Stiffness 286
6.4.5 Summary of behavior 286
6.5 SHEAR BEHAVIOR SUMMARY 288
6.5.1 Introduction 288
6.5.2 Triaxial comparison - CIUC versus CKoUC 288
6.5.2.1 Shear Stress-Strain Behavior 288
6.5.2.2 Effective Stress Behavior 289
6.5.3 DSS - CIUC - CKoUC Summary 290
6.5.3.1 Undrained Strength Ratio 290
6.5.3.2 Friction Angle and Arctan Th/o'v 290
6.5.3.3 Axial strain at failure 292
6.5.3.4 Stiffness 292
7
SUMMARY, CONCLUSIONS, AND RECOMMENDATIONS
347
7.1 OVERVIEW 347
7.2 SUMMARY OF WORK UNDERTAKEN AT MIT 348
7.3 RESULTS AND CONCLUSIONS 350
7.3.1 Feasibility of testing intact tube samples 350
7.3.2 Development of a successful reconstitution procedure for the material 351 7.3.3 Development of successful testing preparation procedures 352
7.3.4 Index properties 353
7.3.5 Engineering Properties 354
7.3.5.1 Introduction 354
7.3.5.2 Consolidation behavior 354
7.3.5.3 Hydraulic Conductivity 356
7.3.5.4 Direct Simple Shear Behavior 356
7.3.5.5 Undrained Triaxial Compression 358
7.4 RECOMMENDATIONS FOR FUTURE RESEARCH 360 7.4.1 Triaxial Testing 360 7.4.2 Reconstitution Technique 361 7.4.3 Susceptibility to Liquefaction 361 7.4.4 Ground Treatment 362 REFERENCES 363
List of Tables
Table 2-1: Characterization results from Irish Drilling 65
Table 3-1: Parameters for triaxial specimens (Hoeg et al. 2000) 120
Table 3-2: Summary of dimensions and features of samplers (Long, 2007) 120
Table 3-3: Study of sampling induced desification effects on silts (Long, 2007) 120
Table 3-4: Summary of dimensions and features of 54 mm Norwegian samplers (Long et
al. 2010) 121
Table 3-5: Su/p ratios for CIUC tests based on various failure criteria (Brandon et al.,
2006) 121
Table 3-6: Effective stress friction angles (#') and strain to failure (sf) from CIUC tests
for various criteria for Yazoo and LMVD silt (Brandon et al., 2006) 121
Table 3-7: Properties of samples of Arctic silt for shear test program (Ladd et al., 1985) 122
Table 3-8: Values of Su/a'ic for Alaskan Silt (Fleming and Duncan, 1990) 122 Table 3-9: Normalized strength parameters for Normally consolidated Silts 122
Table 4-1: Characteristics of instrumentation used in CRS testing apparatus 182
Table 4-2: Characteristics of instrumentation used in Hydraulic Conductivity testing
apparatus 182
Table 4-3: Characteristics of instrumentation used in DSS testing apparatus 183
Table 4-4: Characteristics of instrumentation used in manual control triaxial testing
apparatus 183
Table 4-5: Characteristics of instrumentation used in automated triaxial testing apparatus 184
Table 5-1: Index Property results on Skibbereen Silt 229
Table 5-2: Summary of X Ray Diffraction giving the mineralogy breakdown of
Skibbereen Silt 229
Table 5-3: Summary of CRS consolidation results 230
Table 5-4: Summary of consolidation results for DSS tests 231
Table 5-5: Summary of consolidation results from isotropically consolidated triaxial tests 232 Table 5-6: Summary of consolidation results from Ko consolidated triaxial tests 233
Table 6-1: Summary of CKoDSS (NC) tests 294
Table 6-2: Summary of CKODSS NC and cyclic tests 295
Table 6-3: Summary of CKoDSS OC tests 296
Table 6-4: Summary of CIUC triaxial tests 297
List of Figures
Figure 2-1: Skibbereen Location (Google Earth) 66
Figure 2-2: Skibbereen Location 66
Figure 2-3: Building use of town centre (not to scale) (Skibbereen Town Development
Plan, 2009-2015) 67
Figure 2-4: Skibbereen town from the southwest (Skibbereen Circa 1900) 67
Figure 2-5: River Ilen (not to scale) 68
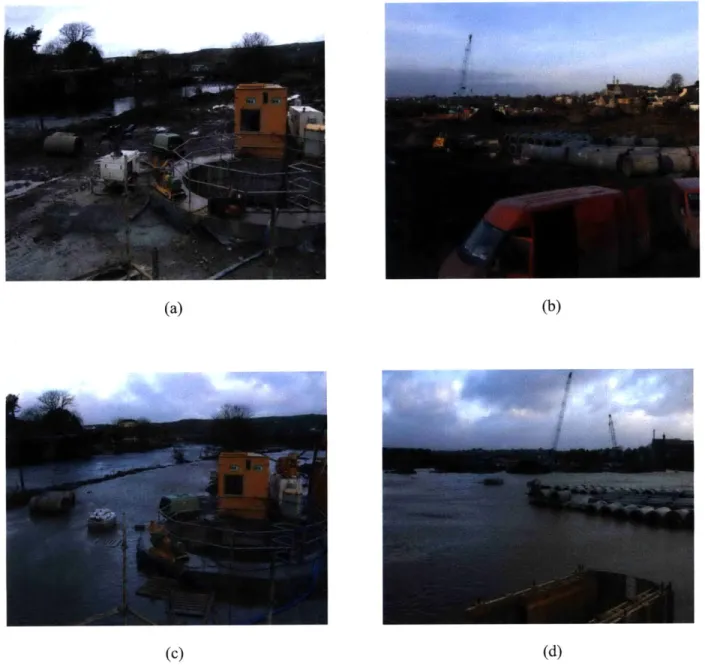
Figure 2-6: Tidal Influence on River Ilen: (a) Low Tide, (b) Low Tide, (c) High Tide and
Heavy Rain, (d) High Tide and Heavy Rain 69
Figure 2-7: Caol Stream (not to scale) 70
Figure 2-8: Pollution along the Caol Stream in Skibbereen: (a) discharge pipe, (b) vertical discharge pipe, (c) polluted stream bed, (d) polluted stream bed (River Ilen and Caol
Stream Redevelopment Project, 2007) 71
Figure 2-9: Marsh Field: (a) schematic (not to scale), (b) photograph 72
Figure 2-10: Topography of West Cork (Pracht & Sleeman, 2002) 73
Figure 2-11: (a) Geochronometric scale (Holland & Sanders, 2009), (b) county map of
Ireland (Holland & Sanders, 2009) 73
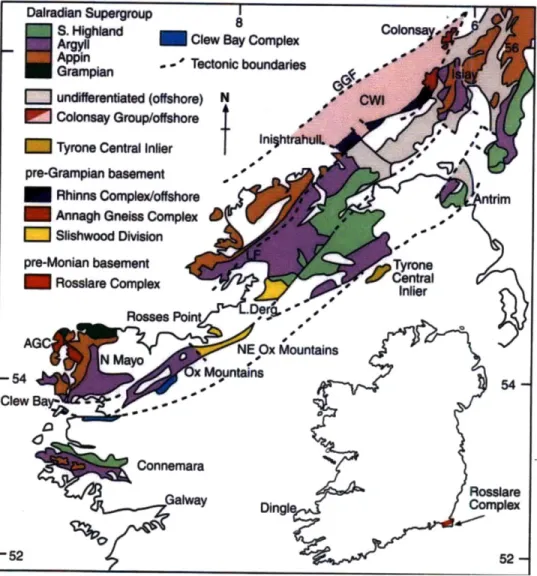
Figure 2-12: Map showing the location of Precambrian rocks in Ireland (Holland and
Sanders 2009) 74
Figure 2-13: Map showing distribution of land (dotted) and sea (white) in Lower
Palaeozoic times (Charlesworth 1953) 75
Figure 2-14: Caledonian movement (Holland and Sanders, 2009) 75
Figure 2-15: Sea location during Devonian times (Dotted = land, Clear = water)
(Charlesworth 1953) 76
Figure 2-16: Distribution of Old Red Sandstone rocks in Ireland today (Holland and
Sanders, 2009) 76
Figure 2-17: Map showing the distribution of land during Carboniferous times, dotted is
land, clear is water (Charlesworth, 1953) 76
Figure 2-18: Distribution of rock types around Skibbereen (Pracht & Sleeman, 2002) 77 Figure 2-19: Major structures in West Cork (Pracht & Sleeman, 2002) 77
Figure 2-20: The pattern of glaciation in Ireland during the last glaciation (Pracht &
Sleeman, 2002) 78
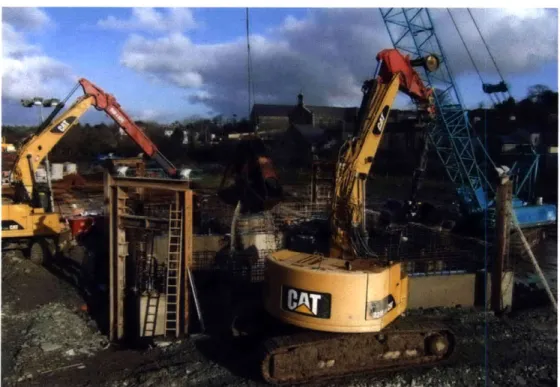
Figure 2-21: Sinking of main pump station caisson using various excavators and
hydraulic jacks 78
Figure 2-22: Schematic diagram of 6m internal diameter caisson (not to scale) 79
Figure 2-23: Directional Drilling equipment used in Skibbereen 80
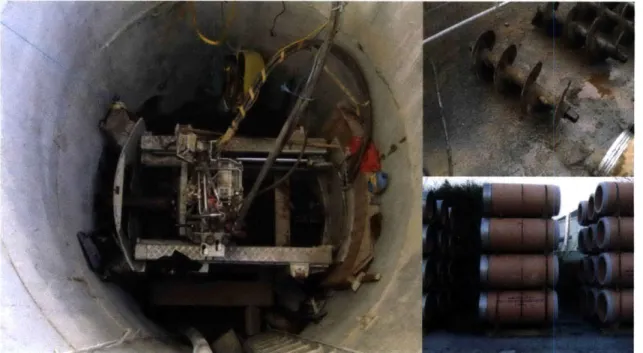
Figure 2-24: Auger boring equipment used in Skibbereen; Launch shaft and jacking
frame, augers, and clay pipes 80
Figure 2-25: Schematic diagram of the micro tunneling system used in Skibbereen 81
Figure 2-26: Pipe skin friction vs. distance for the micro tunneling in Skibbereen 81
Figure 2-27: Tunnel alignment: (a) schematic (blue line is tunnel), (b) photograph from
launch shaft 82
Figure 2-28: Vertical tunnel alignment when TBM began to sink. (Zero in elevation indicates required grade, line with square data points is original TBM position, and
line with circular data points is current pipe position) 83
Figure 2-29: Alignment of HDD grouting under tunnel (dimensions in m) 83
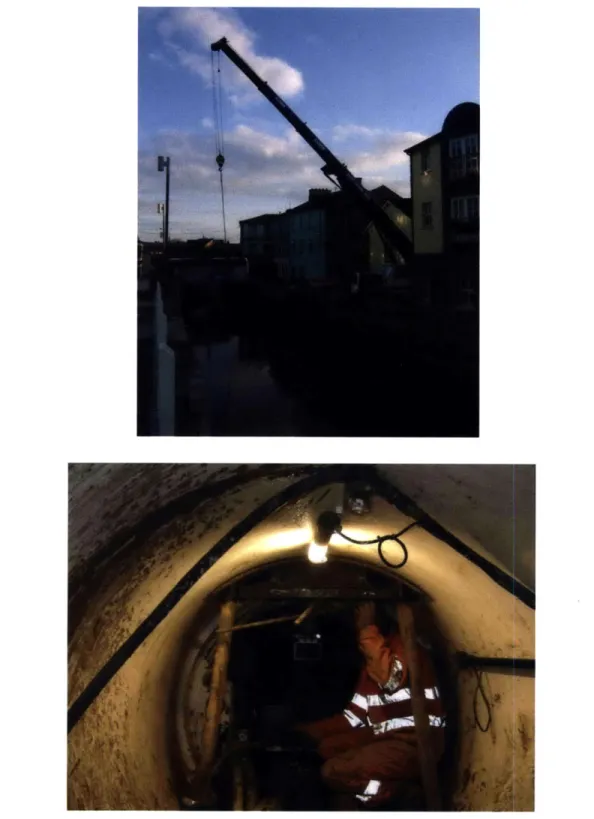
Figure 2-30: Crane attached to TBM: (a) At ground level, (b) inside TBM where crane is
attached 84
Figure 2-31: Examples of structural damage as a result of tunneling; (a) Stone arch bridge cracked, (b) beginning of repair work on bridge, (c) retaining wall damaged where TBM exited stream (wall cracked and rotating towards river) (d) typical example of
cracking in residential property 85
Figure 2-32: Vertical tunnel alignment after completion of tunnel (Zero in elevation indicates required grade, line with square data points is original TBM position, and
line with circular data points is current pipe position) 86
Figure 2-33: Addition of kentledge over tunnel 86
Figure 2-34: Further site investigation in Skibbereen 87
Figure 2-35: Shell and auger for site investigation boreholes 87
Figure 2-36: Geonor field vane in use 88
Figure 2-38: Field vane shear strength information: (a) Field data, (b) scatter plot for
intact tests 89
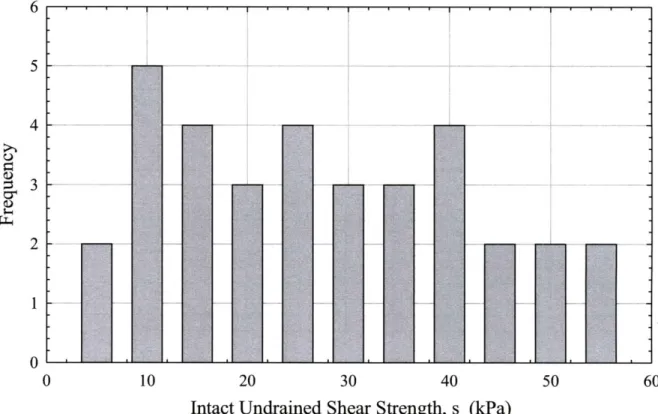
Figure 2-39: Frequency versus intact undrained shear strength for field vane data 90
Figure 2-40: CPT output: Cone resistance, skin friction, friction ration, inclination, and
interpreted soil profile 91
Figure 2-41: CPT output: Cone resistance, skin friction, pore pressure ratio, total pore
pressure 92
Figure 2-42: CPT dissipation test in Skibbereen 93
Figure 3-1: Typical dry unit weight profiles obtained in triaxial silt specimens: (a) Block
sample, (b) Undercompacted specimen (Baxter et al., 2008) 123
Figure 3-2: Undrained triaxial results at 'ac= 500 kPa (Hoeg et al. 2000) 124 Figure 3-3: Undrained triaxial results at 'ac = 250 kPa (Hoeg et al. 2000) 125
Figure 3-4: Schematic diagram of sediementation technique (Hyde et al., 2006) 126 Figure 3-5: Comparison of results from undisturbed, slurry, and water pluviated
specimens (Hoeg et al., 2000) 127
Figure 3-6: One dimensional compressibility of Syncrude sand specimens reconstituted
by different methods (Vaid and Sivathayalan, 1999) 128
Figure 3-7: Undrained simple shear response of specimens reconstituted by different
techniques (Vaid and Sivathayalan, 1999) 128
Figure 3-8: Undrained triaxial compression response of reconstituted Fraser River Sand
specimens (Vaid and Sivathayalan, 1999) 129
Figure 3-9: "Double" U 100 tubes (Standard Ireland-UK U100 or U4 sampling tubes.
Crude cutting shoe shown on right hand side) (Long, 2007) 129
Figure 3-10: One dimensional behavior from oedometer tests, Sligo (Long, 2007) 130
Figure 3-11: One dimensional behavior from oedometer tests, Dunkettle (Long, 2007) 130
Figure 3-12: Consolidation test results for undisturbed samples of Yazoo Silt (Brandon et
al., 2006) 131
Figure 3-13: Compression curves for silt in Harrison Bay area (Ladd et al., 1986) 131
Figure 3-15: Typical oedometer test results (a) Norwegian upper Os silt, (b) lower OS
clayey silt, and (c) Norwegian E39 silt (Long et al. 2010) 133
Figure 3-16: Idealized stress path showing stresses at failure for different failure criteria
(Brandon et al., 2006) 134
Figure 3-17: Deviator stress-strain curves from UU triaxial tests of undisturbed
specimens of Yazoo silt (Brandon et al., 2006) 134
Figure 3-18: Deviator stress-strain curves for reconstituted specimens of Yazoo and
LMVD silt; (a) Yazoo silt, (b) LMVD silt (Brandon et al., 2006) 135
Figure 3-19: Stress-strain relationship for UU tests at confining pressure (aco)= 1.5 ksc
(~147 kPa) on Alaskan Silt (Fleming and Duncan, 1990) 135
Figure 3-20: CIUC tests on undisturbed specimens of Yazoo silt; (a) Deviator stress
strain curve, (b) stress paths (Brandon et al., 2006) 136
Figure 3-21: Deviator stress versus axial strain for reconstituted low plasticity silt (Hyde
et al., 2006) 137
Figure 3-22: Stress path for reconstituted low plasticity silt (Hyde et al., 2006) 137
Figure 3-23: Comparison of deviator stress and pore pressure behavior for undisturbed and remolded samples isotropically consolidated to 1.5 ksc (~150 kPa) (Fleming and
Duncan, 1990) 138
Figure 3-24: Effective stress path for triaxial tests on natural silt; intact and reconstituted
specimen data above stress path (Hoeg et al., 2000) 138
Figure 3-25: CAUC results on Norwegian glaciomarine silt; (a) upper silt, (b) lower clayey silt 7m and 9m samples, and (c) lower clayey silt 8m and 10m samples (Long
et al., 2010) 139
Figure 3-26: Normalized stress strain data from CU triaxial tests on OCR = 1 Harrison
Bay Arctic Silt (Ladd et al., 1985) 140
Figure 3-27: Normalized stress strain data from CU Direct Simple Shear tests on OCR
1 Harrison Bay Arctic Silt (Ladd et al., 1985) 140
Figure 3-28: Intact and reconstituted specimens of NC Fraser River silt during constant volume DSS shear; (a) stress strain and (b) stress path response (Wijewickreme and
Sanin, 2008) 141
Figure 3-29: Deviator stress and effective stress ratio versus axial strain curves in CIUC tests; (a) deviator stress-axial curve and (b) effective stress ratio-axial strain
Figure 3-30: Effective stress paths in CIUC tests; (a) deviator stress path and (b)
normalized effective stress path (Yasuhara et al., 2003) 142
Figure 3-31: Normalized undrained shear strength versus OCR for Alaskan Silt (Fleming
and Duncan, 1990) 143
Figure 3-32: Normalized cyclic stress ration versus plasticity index on undisturbed
samples (Prakash and Puni, 2003) 143
Figure 4-1: Typical MOSTAP Sampler (Lankelma, 2008) 185
Figure 4-2: Extruded tube sample 186
Figure 4-3: Bulk Samples Air Drying 186
Figure 4-4: Schematic of the blending procedure for large samples (Germaine &
Germaine, 2009) 187
Figure 4-5: Blending in Buckets 187
Figure 4-6: Vacuum setup to de air the RBBC slurry (Abdulhadi, 2009) 188
Figure 4-7: Pouring of RBBC into Consolidometer (Abdulhadi, 2009) 188 Figure 4-8: Consolidometer with internal diameter of 7.62 cm: (a) schematic, (b)
photograph (Abdulhadi, 2009) 189
Figure 4-9: Uniform sedimentation with various salt concentrations 190 Figure 4-10: Typical deformation vs. Time Plot during resedimentation 190
Figure 4-11: Specimen "flow" during and after extrusion from consolidometer 191
Figure 4-12: Cut through dense material with razor blade after extrusion flow 191
Figure 4-13: "Jelly donut" behavior of material: (a) extrusion of material, (b) Just after extrusion (the ring in the cross section shows the start of the soft "jelly" material),
(c) touching of sample causing disturbance 192
Figure 4-14: The trimming process: (a) partially saturated specimen after extrusion, (b) placement of specimen in the CRS trimming rig, (c) beginning of trimming when the specimen appears dry, (d) water drawn to trimming location, preventing further
trimming and causing collapse of the specimen structure 193
Figure 4-15: Schematic of reconstituting specimens using the undercompaction procedure
(Germaine & Germaine, 2009) 194
Figure 4-16: Schematic diagram of a centralized data acquisition system (Germaine &
Figure 4-17: Schematic diagram of the control system hardware components 195
Figure 4-18: Original CRS device developed by Smith and Wahls (1969) 196
Figure 4-19: MIT CRS device (Wissa et al., 1971) 196
Figure 4-20: Oedometer configuration for CRS testing: (a) schematic, (b) photograph 197
Figure 4-21: CRS Test setup: (a) schematic, (b) photograph 198
Figure 4-22: Dead load configuration for CRS saturation: (a) successful, (b) unsuccessful 199
Figure 4-23: "Blow holes" resulting from a high water head 200
Figure 4-24: Undercompaction in CRS specimen ring from top to bottom using recess
tool underneath the specimen ring 200
Figure 4-25: Schematic Diagram of Geonor Model 4 DSS Apparatus (Ortega, 1992) 201
Figure 4-26: The DSS device with reservoir and ancillary plumbing 201 Figure 4-27: DSS setup: (a) specimen mold and Geonor membrane, (b) membrane placed
in mold, (c) vacuum applied to membrane and specimen ring lower onto pedestal in
trimming apparatus, (d) positioning of mold using calipers 202
Figure 4-28: Compaction procedure: (a) schematic diagram showing how specimen is compacted in layers, (b) scarifying between layers, (c) final specimen after
compaction 203
Figure 4-29: Connection of the drainage lines for saturation: (a) schematic, (b)
photograph 204
Figure 4-30: Manual triaxial apparatus used for CIUC tests (modified from Sheahan,
1991) 205
Figure 4-31: Schematic of MIT automated stress path triaxial cell (Santagata, 1998) 206
Figure 4-32: Schematic of automated triaxial cell (Santagata, 1998) 207
Figure 4-33: Compaction configuration: (a) schematic, (b) photograph 208
Figure 4-34: Triaxial setup procedure: (a) placing porous stone on specimen, (b) placing top cap on specimen and folding membrane around top cap, (c) fixing o-rings and applying vacuum, (d) removing expander/former , rolling up thin membrane, and
fixing final o-ring 209
Figure 4-36: Unstable structure causing the specimen to lean to one side during saturation
when there is a top cap with no recess for lateral stability 211
Figure 5-1: Grain Size Distribution Curves for Skibbereen Silt from hydrometer tests 234
Figure 5-2: Surface curvature around fall cone during liquid limit testing on Skibbereen
Silt: (a) Extended view, (b) close up 235
Figure 5-3: Classification of Skibbereen Silt on Casagrande Plasticity Chart 236
Figure 5-4: SEM image on Skibbereen Silt, magnified to 2000 times the actual size 236
Figure 5-5: X Ray Diffraction analysis for Skibbereen Silt: Intensity versus Degrees Two
Theta for Cu Ka Radiation (5-39) 237
Figure 5-6: X Ray Diffraction analysis for Skibbereen Silt: Intensity versus Degrees Two
Theta for Cu Ka Radiation (39-65) 238
Figure 5-7: Compression behavior in Ea-loga'v space from CRS 976 239
Figure 5-8: Compression behavior in e-loga'v space from CRS 976 240
Figure 5-9: Axial strain versus G'v/a'vm (OCR') from the unload phases of a typical CRS
test 241
Figure 5-10: Axial strain-time behavior with different initial densities from CRS tests 242
Figure 5-11: Axial strain-log time behavior with different initial densities from CRS tests 242 Figure 5-12: Axial strain-time (close up view) behavior with different initial densities
from CRS tests 243
Figure 5-13: Axial strain post saturation versus initial setup dry density from CRS tests 243 Figure 5-14: Void ratio post saturation versus initial setup dry density from CRS tests 244
Figure 5-15: Compression behavior in Ea-logG'v space from CRS tests 245 Figure 5-16: Compression behavior in e-loga'v space from CRS tests 246 Figure 5-17: Virgin Compression behavior in e-loga'v space from CRS tests 247
Figure 5-18: Post consolidation behavior; a) CRS specimen extrusion into evaporating dish, b) material behavior after one blow to evaporating dish, c) material behavior
after 5 blows to evaporating dish 248
Figure 5-20: Axial strain-time behavior during inundation using different confining
stresses from CRS tests 250
Figure 5-21: Axial strain-log time behavior during inundation using different confining
stresses from CRS tests 250
Figure 5-22: Void ratio post saturation versus initial setup dry density from CRS and DSS
tests 251
Figure 5-23: Axial strain post saturation versus initial setup dry density from CRS and
DSS tests 251
Figure 5-24: Compression behavior in ca-loga'v space from DSS tests 252
Figure 5-25: Compression behavior in e-loga'v space from DSS tests (CRS range
included) 253
Figure 5-26: Compression behavior in cv-loga', space from CIUC tests 254
Figure 5-27: Compression behavior in e-loga'v space from CIUC tests 255
Figure 5-28: Compression behavior in e-loga'v space from CIUC tests compared with the
CRS test range 256
Figure 5-29: Post saturation void ratio versus initial setup dry density for CRS, DSS, and
CIUC triaxial tests 257
Figure 5-30: Compression behavior in Ea-loga' space from CKOUC tests 258
Figure 5-31: Compression behavior in e-loga'v space from CKoUC tests 259
Figure 5-32: Post saturation void ratio versus initial setup dry density for CRS, DSS,
CIUC, CKOUC tests 260
Figure 5-33: Compression and swelling ratios versus stress level from all consolidation
tests 261
Figure 5-34: Lateral stress ratio versus stress level from CKoUC tests 262
Figure 5-35: Effective Stress path during consolidation from CKOUC tests 262
Figure 5-36: Compression behavior in e-loga'v space from CKOUC tests compared with
the CRS range and a CIUC test 263
Figure 5-37: Hydraulic conductivity versus void ratio and hydraulic conductivity versus
vertical effective stress for Skibbereen Silt 264
Figure 6-2: Normalized stress-strain curves from NC CKODSS tests 299
Figure 6-3: Normalized undrained shear strength versus stress level from NC CKODSS
tests 300
Figure 6-4: Strain at failure versus stress level from NC CKODSS tests 300
Figure 6-5: Effective stress paths from NC CKODSS tests 301
Figure 6-6: Normalized effective stress paths from NC CKODSS tests 301
Figure 6-7: Normalized effective stress paths (close up view) from NC CKODSS tests 302
Figure 6-8: Friction angle at peak and end of shear strain versus stress level from NC
CKoDSS tests 302
Figure 6-9: Normalized undrained secant modulus versus shear strain from NC CKODSS
tests 303
Figure 6-10: Normalized undrained secant modulus versus stress level from NC CKoDSS
tests 303
Figure 6-11: Normalized stress-strain curves from NC CKODSS tests of different initial
density 304
Figure 6-12: Normalized effective stress paths from NC CKoDSS tests of different initial
density 304
Figure 6-13: Normalized undrained shear strength versus stress level from NC CKODSS
tests with different initial setup densities 305
Figure 6-14: Strain at failure versus stress level from NC CKODSS tests with different
initial setup densities 305
Figure 6-15: Normalized effective stress paths (close up view) from NC CKODSS tests of
different initial density 306
Figure 6-16: Effective stress paths for NC CKODSS tests of different initial density 306
Figure 6-17: Normalized undrained secant modulus versus shear strain from NC CKODSS
tests of different initial density 307
Figure 6-18: Normalized stress-strain curves from OCR=1, 2, 3, and 4 CKODSS tests
(normalized to the vertical consolidation stress, a'V) 308
Figure 6-19: Normalized stress-strain curves from OCR=1, 2, 3, and 4 CKODSS tests
Figure 6-20: Normalized Undrained Shear strength variations with OCR from CKODSS
tests 309
Figure 6-21: Normalized effective stress paths from OCR = 1, 2, 3, and 4 CKODSS tests
(normalized to the maximum vertical consolidation stress, 'vm) 310
Figure 6-22: Normalized effective stress paths from OCR = 1, 2, 3, and 4 CKODSS tests
(normalized to the vertical consolidation stress, y've) 310
Figure 6-23: Friction angle versus vertical consolidation effective stress from OCR = 1,
2,3, and 4 CKODSS tests 311
Figure 6-24: Normalized undrained secant modulus (Eu/T've) versus shear strain from
OCR = 1, 2, 3, and 4 CKODSS tests 312
Figure 6-25: Normalized undrained strength versus OCR from CKODSS tests 312
Figure 6-26: Shear stress versus strain from a typical cyclic CKODSS test 313
Figure 6-27: Effective stress path from a typical cyclic CKoDSS test 313
Figure 6-28: Stress-Strain curves from Cyclic CKoDSS tests (standard NC CKoDSS
included for comparison) 314
Figure 6-29: Normalized Stress-Strain curves from Cyclic CKoDSS tests (standard NC
CKODSS included for comparison) 314
Figure 6-30: Effective stress paths from cyclic CKoDSS tests 315
Figure 6-31: Normalized effective stress paths from cyclic CKoDSS tests 315
Figure 6-32: Compression behavior in e-loga'v space from cyclic CKoDSS tests 316
Figure 6-33: Normalized shear strength versus total density from NC and cyclic CKoDSS
tests 317
Figure 6-34: Shear strain at failure versus total density from all NC and cyclic CKoDSS
tests 317
Figure 6-35: Undrained strength ratio versus vertical consolidation stress for NC and
cyclic CKoDSS tests 318
Figure 6-36: Stress-strain curves from CIUC triaxial tests 319
Figure 6-37: Normalized stress-strain curves from CIUC triaxial tests 320
Figure 6-38: Normalized stress-strain curves (small strains) from CIUC triaxial tests 321
Figure 6-39: Normalized stress- (log) strain curves from CIUC triaxial tests 321 28
Figure 6-40: Effective stress paths from CIUC triaxial tests showing the failure criteria
used this research 322
Figure 6-41: Effective stress paths from CIUC triaxial tests 323
Figure 6-42: Normalized effective stress paths from CIUC triaxial tests 324
Figure 6-43: Principle stress ratio versus axial strain from CIUC triaxial tests 325
Figure 6-44: Friction angle versus axial strain from CIUC triaxial tests 325
Figure 6-45: Normalized excess pore pressure versus strain from CIUC triaxial tests 326
Figure 6-46: Normalized shear induced pore pressure versus strain from CIUC triaxial
tests 326
Figure 6-47: Skempton A parameter versus strain from CIUC triaxial tests 327
Figure 6-48: Normalized undrained secant modulus versus axial strain from CIUC
triaxial tests 328
Figure 6-49: Normalized undrained secant modulus versus stress level from CIUC
triaxial tests 328
Figure 6-50: Normalized undrained shear strength versus stress level from CIUC triaxial
tests 329
Figure 6-51: Friction angle versus stress level from CIUC triaxial tests 329
Figure 6-52: Strain at failure versus stress level from CIUC triaxial tests 330
Figure 6-53: Stress-strain curves from CKoUC triaxial tests 331
Figure 6-54: Normalized stress-strain curves from CKOUC triaxial tests 331
Figure 6-55: Normalized stress-strain curves (small strain) from CKOUC triaxial tests 332
Figure 6-56: Normalized stress (log) -strain curve from CKoUC triaxial tests 332
Figure 6-57: Effective stress paths from CKoUC triaxial tests 333
Figure 6-58: Normalized effective stress paths from CKOUC triaxial tests 333
Figure 6-59: Principle stress ratio versus axial strain from CKOUC triaxial tests 334
Figure 6-61: Normalized excess pore pressures versus strain from CKOUC triaxial tests 335
Figure 6-62: Normalized shear induced pore pressures versus strain from CKOUC triaxial
tests 335
Figure 6-63: Normalized undrained secant modulus versus axial strain from CKOUC
triaxial tests 336
Figure 6-64: Normalized undrained secant modulus versus stress level from CKOUC
triaxial tests 336
Figure 6-65: Normalized undrained strength versus stress level from CKOUC triaxial tests 337
Figure 6-66: Friction angle versus stress level from CKOUC triaxial tests 337
Figure 6-67: Axial strain at failure versus stress level from CKOUC triaxial test 338
Figure 6-68: Stress-strain curves from CIUC and CKOUC triaxial tests 339
Figure 6-69: Normalized stress-strain curves from CIUC and CKoUC triaxial tests 340
Figure 6-70: Normalized stress-strain curves from CIUC and CKOUC triaxial tests
(Normalized by mean consolidation effective stress) 341
Figure 6-71: Effective stress paths from CIUC and CKOUC triaxial tests 342
Figure 6-72: Normalized effective stress paths from CIUC and CKoUC triaxial tests 343
Figure 6-73: Normalized undrained strength versus stress level from DSS, CIUC, and
CKoUC tests 344
Figure 6-74: Peak friction angle versus stress level from DSS, CIUC, and CKOUC tests 344 Figure 6-75: Friction angle versus consolidation stress level for DSS, CIUC, and CKOUC
tests 345
Figure 6-76: Friction angle versus mean effective stress for DSS, CIUC, and CKOUC tests 345
Figure 6-77: Axial strain at failure versus stress level for DSS, CIUC, and CKOUC tests 346
Figure 6-78: Normalized undrained secant modulus versus stress level from DSS, CIUC,
List of Symbols
AC A/D BASIC BBC CF CHL CID CIU CIUC CKoU CKoUC CKoUDSS CKoUE CL CR CRS CU D/A DC DCDT DSS ESE ESP F HC LVDT MADC MIT ML NC OC OCR PC PID PSD PVA PVC Alternating Current Analog-to-Digital ConverterBeginner's All-purpose Symbolic Instruction Code Boston Blue Clay
Clay Fraction Chlorite
Isotropically Consolidated Drained Shear Test Isotropically Consolidated Undrained Shear Test
Isotropically Consolidated Undrained Shear Compression Test Ko-Consolidated Undrained Shear Test
Ko-Consolidated Undrained Compression Test
Ko-Consolidated Undrained Direct Simple Shear Test Ko-Consolidated Undrained Extension Test
Low Plasticity Clay Virgin Compression Ratio Constant Rate of Strain Consolidated Undrained Test Digital-to-Analog Converter Direct Current
Direct Current Displacement Transducer Direct Simple Shear Test
Effective Stress Envelope Effective Stress Path Feldspar
Hydraulic Conductivity
Linear Variable Differential Transformer Multi-Channel Analog to Digital Converter Massachusetts Institute of Technology Low Plasticity Silt
Normally Consolidated Overconsolidated
Overconsolidation Ratio Personal Computer
Proportional-Integral-Derivative Particle size distribution curve Pressure Volume Actuator Pressure-Volume Controller
Q
RBBC RR SD SR TC TE TX USR UU SHANSEP VCLSkempton's pore pressure parameter (at failure) Skempton's pore pressure parameter
Coefficient of curvature, Compression index Permeability change index
Swelling index
Coefficient of uniformity Coefficient of consolidation Cohesion intercept
Grain size with 10% passing particle size distribution curve Grain size with 30% passing particle size distribution curve Grain size with 60% passing particle size distribution curve Young's modulus
Undrained secant Young's modulus
Undrained secant Young's modulus (maximum) Void ratio
Void ratio at end of consolidation Initial setup void ratio
Specific gravity Shear Modulus Initial shear modulus Height
Plasticity index
Lateral coefficient of earth pressure Coefficient of lateral earth pressure at rest
Normally consolidated coefficient of lateral earth pressure at rest Lateral coefficient of earth pressure at end of consolidation
Quartz
Resedimented Boston Blue Clay Recompression Ratio
Standard deviation Swelling Ratio
Triaxial Compression Shear Test Triaxial Extension Shear Test Triaxial
Undrained Strength Ratio (su/''ve)
Unconsolidated Undrained Compression Test
Stress History and Normalized Soil Engineering Properties Virgin Compression Line
A (Af) b cc Ck Cs Cu cv c' Dio D30 D60 E En EuMAX e ec ei Gs, SG G Gi H Ip K Ko Ko(NC) Kc
k Hydraulic conductivity
kv Vertical hydraulic conductivity
L Length
m OCR exponent in SHANSEP equation for undrained strength ratio
mv Coefficient of volume change
p, p' Average effective stress, (cai + C3) / 2, (G'i + (7'3) /2
q Shear stress, (01 - 03) / 2
qf Shear stress at failure
r2 Coefficient of determination
S Undrained strength ratio for NC soil in SHANSEP equation
Si Initial setup saturation
su Undrained shear strength
t Time
t, Time to end of primary
u, Au Pore pressure, change in pore pressure
ue Excess pore pressure
us Shear induced pore pressure
ui Pore (back) pressure at start of shearing
V, AV Current volume, change in volume
Vi Initial volume
w, we Water content
wi Initial setup water content
WL, LL Liquid limit
wn Natural water content
wp, PL Plastic limit
c Strain
Esa Axial strain
Ef Strain at peak shear stress
EV Specimen volume strain
E , 6/6t Strain rate
p, (' Friction angle, effective friction angle
e'p
Effective friction angle at peaky Shear strain
y, 6y/6t Shear strain rate
Yd Dry Unit Weight
Yt Total Unit weight
7W Unit weight of water
p Density
a, a'v Vertical stress, vertical effective stress
Ch, c h Horizontal stress, horizontal effective stress
GP Preconsolidation pressure
ay9 Vertical effective stress
Y've Vertical consolidation effective stress
' vm Maximum vertical consolidation effective stress
(1, a72, (3 Principal stresses
Toct Mean octahedral stress
T Shear stress
Th Horizontal shear stress
Arctan Th/&yv for direct simple shear
Effective arctan Th/G'v for direct simple shear Peak effective arctan Th/G'v for direct simple shear
1
INTRODUCTION
1.1
BACKGROUND
In contrast to the extensive geotechnical research that exists on clay and sand soils, little information exists on the engineering properties of low plasticity silts. There are many reasons for this trend. The material is not very common and it is generally avoided in construction due to the poor site conditions. Disturbance during sampling and the subsequent preparation and testing in the laboratory also pose significant difficulties and problems. As a consequence, industry relies more on field testing from methods such as the standard penetration test, field vane test, and cone penetration test. However, many of the empirical methods that transform field results into engineering parameters were originally developed from laboratory data. Therefore, the need for accurate laboratory information still exists.
The difficulty in obtaining intact samples has resulted in laboratory research concentrating more on reconstituted specimens to obtain the engineering parameters. Several reconstitution techniques have been used on silts, some to a greater degree of success than others. They have generally been modified from techniques used in reconstituting clays and sands. However, the exact details of a successful reconstitution procedure have still to be defined.
The material source for this study comes from Skibbereen, Co. Cork, Ireland. The town is located in Southwest Ireland approximately 85km south west of Cork City and 32 km from the town of Clonakilty. It is situated on the N71, the primary Cork to Killarney road. The southwest area is deeply penetrated by the sea in a series of long coastal inlets whose depth and width gradually diminish inland. Skibbereen is located in a valley close to the sea on the banks of the River Illen. The river is tidally influenced causing a fluctuation in ground water levels in the town on a daily basis.
The town is home to an interesting and intricate geology. Various rock types outcrop the Southwest Irish area while the town itself is built on a limestone bed overlain by alluvial deposits from glacier melt-water and river deposits. The properties of the overlying deposits are the focus of this thesis.
The material was obtained during a major upgrade of the wastewater infrastructure in Skibbereen. The project was needed to stop the discharge of raw sewerage into water courses and to increase the capacity of the system for the increasing population. The project involved the construction of many deep pumping stations and new sewerage pipelines. To minimize the risks of ground settlement and structural damage to existing developments, many innovative and technically challenging construction techniques were utilized. Caisson construction and the most recent trenchless technologies were used continuously throughout the project.
Despite the efforts to prevent damage to existing structures in the town, some serious problems did occur. Structural damage together with other construction difficulties soon made it apparent that a greater understanding of the soil properties and behavior was required. The realization of the difficulty to obtain this information ultimately resulted in the transportation of both intact and disturbed samples to the MIT geotechnical laboratory.
1.2
RATIONALE FOR CHARACTERIZATION OF LOW PLASTICITY
SILT FROM SKIBBEREEN
The rationale behind the need to characterize the low plasticity silt found in Skibbereen is extremely simple. The original site investigation and laboratory testing program undertaken at Skibbereen was extremely limited and can be described as "poor" quality. The original site investigation produced standard penetration test values less than 10, some cone penetrometer data, and some index testing information. However, there was a large deviation in the results obtained from this program. Furthermore, no laboratory tests were conducted to provide the engineering properties of the material, i.e. such as oedometer tests for the consolidation properties or simple triaxial tests to provide stress-strain-strength information. Therefore, it can be stated that up until the arrival of the material at the MIT geotechnical laboratory relatively nothing was known about its properties and behavior.
Reliable testing information was needed to understand the behavior seen in the field and to help explain some of the problems encountered during the construction. The silt deposits found in Skibbereen are not localized to that area only. Throughout the south and west coast of
Ireland, low plasticity silts are reported in many locations. However, the properties and testing techniques are relatively unknown. For future construction projects it is imperative that an understanding of the behavior and properties are known before construction work commences to limit the possibility of construction problems and structural damage like that encountered in
Skibbereen.
Besides the need to characterize the material at the Skibbereen site and Irish locations, at present there is a shortage of information for low plasticity silts. It is known that the behavior of silts are somewhere between the behavior of clay and sand. However, silt properties cannot be interpolated from clay and sand results. Of those who have studied the properties of low plasticity silts, there are many contrasting views, opinions, and results. Various sampling, testing, and reconstitution procedures have been documented with no one preferred method emerging. The results and behavior found among researchers also show a large deviation.
It can be concluded that low plasticity silts are difficult to test and characterize. There is a shortage of information about the material and the properties can change significantly with location. Therefore, the need for further research exists.
1.3
RESEARCH OBJECTIVES AND SCOPE
The objectives and corresponding scope of the research can be divided into the following components.
1) Conduct a detailed literature review of low plasticity silt properties and behavior.
2) Process the bulk material transported to the MIT geotechnical laboratory to ensure that the engineering tests will be run on material that is homogeneous and of high quality.
3) Characterize the material by the use of index property tests. Methods utilized will include grain size distribution analysis, specific gravity tests, Atterberg limits, organic content evaluation, salt concentration testing, scanning electron microscope images, and X-ray diffraction.
5) Determine the feasibility of testing tube samples without disturbance.
6) Develop successful testing preparation procedures for tests such as constant rate of strain
tests, hydraulic conductivity tests, direct simple shear tests, and isotropically and Ko consolidated triaxial tests.
7) Characterize the engineering properties of Skibbereen silt. This objective will be
accomplished through a combination of sophisticated laboratory tests run on the processed material. The program can be broken into the following
components:-a) The use of constant rate of strain (CRS) tests on material with different initial densities to stresses up to 15 MPa.
b) The use of hydraulic conductivity testing using a modified CRS device with automated control.
c) The use of the automated direct simple shear (DSS) device to provide consolidation and stress-strain-strength information on normally consolidated and overconsolidated specimens. The overconsolidated specimens will make use of the SHANSEP theory. The DSS device will finally be used for cyclic shear testing.
d) The use of isotropically consolidated undrained triaxial compression tests to
develop stress-strain-strength properties over a range of consolidation stresses for normally consolidated specimens
e) The use of automated triaxial equipment to conduct Ko-consolidated undrained compression tests. The tests will provide good one-dimensional compression curves, measurements of the coefficient of earth pressure at rest (Ko), plus the stress-strain-strength properties over a range of consolidation stresses.
8) Develop a recommended set of properties for the low plasticity silt in Skibbereen. This portion of the research will make a detailed analysis of the results from the laboratory consolidation and strength testing. The collective evaluation will lead to a set of
engineering properties that can be used with confidence for the geotechnical design of future construction in this soil type. The research will include:
a) Typical consolidation properties at various stress levels, along with representative hydraulic conductivity properties.
b) A set if normalized soil properties correlated to stress level dependence, such as
undrained shear strength and undrained modulus. Other critical parameters such as the friction angle and strains at failure will also be included.
1.4
ORGANIZATION OF THE THESIS
This thesis is organized into seven chapters, with the aim of presenting the reader with a logical picture of the problem investigated.
Chapter 2 provides the background information related to this research project. The town of Skibbereen is first discussed with its location and features presented in detail. The geologic history of the soil underlying the town is then reviewed. The area has a very interesting and intricate geology. A summary of the south Ireland geology is first discussed and then a correlation is made for Skibbereen. The rest of the chapter focuses on information specific to the construction of the new waste water infrastructure in the town. First, an overview of the project is presented, followed by some of the construction techniques used during the project. Some of the major construction difficulties are then discussed. The chapter ends with details of the original site investigation and the secondary investigation where the material for this thesis was sourced.
Chapter 3 presents a literature review of low plasticity silt properties and behavior. The chapter summarizes existing reconstitution procedures to prepare test specimens, test preparation methods for various test types, sampling, and sampling disturbance. Typical index and engineering properties are provided. In particular, the current knowledge on the consolidation and undrained shear strength is reviewed in great detail. The various testing conditions and failure criteria for shear strength testing are finally presented. The main aim of this chapter is to provide a good database to analyze the results found in this research.
Chapter 4 provides a complete description of the experimental procedures and equipment used to perform the tests presented in this thesis. The chapter includes the successful and unsuccessful reconstitution procedures, the test preparation methods undertaken for all devices, and the modifications to existing testing procedures. The control system hardware, software, measurement instrumentation, and data acquisition system are all described.
Chapter 5 presents the consolidation results from constant rate of strain (CRS) tests, direct simple shear (DSS) tests, and isotropically and Ko consolidated triaxial tests. The initial conditions were varied for the CRS tests and specimens were consolidated to stresses up to 15 MPa. The DSS and triaxial tests were consolidated prior to shear. The chapter also includes hydraulic conductivity results from three tests in a modified CRS device.
The DSS and triaxial shear results are presented and analyzed in Chapter 6. The chapter first reviews the DSS results. Both normally and overconsolidated behavior is analyzed, the
SHANSEP framework for the material is presented, followed by cyclic DSS test results. The
second part of the chapter focuses on the isotropically consolidated behavior before a similar analysis is presented for the KO consolidated results. The final section of the chapter summarizes all DSS and triaxial test findings.
Chapter 7 summarizes the most important results from the research, presents the best estimates of properties and other correlations for low plasticity silt from Skibbereen, and recommends guidelines for future research.
2
BACKGROUND
2.1
INTRODUCTION
This chapter provides the background information about Skibbereen and the reasons behind the testing program at the MIT Geotechnical laboratory. The town of Skibbereen is located in Southwest Ireland and serves as an administrative, employment, commercial, health, recreational, and educational centre for a large hinterland area. The town is also a very popular destination for many tourists and tourism is now one of its main industries. Skibbereen has many key geological features such as the River Ilen, Caol stream, and the Marsh area. All relevant features of the town are presented including the sewerage system before the new upgrade.
Section 2.3 discusses in detail the geology of Skibbereen. The town is located on low lying ground in a valley floored by sandstones and mudstones of the Carboniferous age. The overlying sediments are as a result of glaciation and they have accumulated to great depths. The geology of Skibbereen has been interpreted from information found on the West Cork area and general Irish geology. The rock developments are first discussed in detail followed by the overlying sediment formations. Finally, the existing geologic conditions are presented.
Section 2.4 describes the new sewerage scheme construction. It presents a brief overview of the overall contract and the various construction techniques. The project relied heavily on caisson and trenchless technology construction to overcome the poor ground conditions. However, numerous construction difficulties occurred despite these measures.
The final section of the chapter covers the site investigation for the project. The original site investigation is first described. An extensive field testing program was undertaken. Standard penetration tests, in situ falling head tests, and groundwater observations provide important information about the ground conditions. However, the original testing program was not backed with a good laboratory investigation. During construction of the project a second site investigation was undertaken to provide additional information. Field vane tests and cone penetration tests were conducted to give strength properties for the soil. Both intact and disturbed samples were taken for laboratory testing. Results from index tests on the disturbed material are also presented.