CHARACTERIZATION AND MODELING OF THE FUNDAMENTAL ASPECTS
OF OIL TRANSPORT IN THE PISTON RING PACK
OF INTERNAL COMBUSTION ENGINES
byBenoist Thirouard M.S., Engines (1996)
Ecole Nationale Supdrieure du P6trole et des Moteurs, Paris
DEA, Energy Conversion (1995) Universiti Paris VI
Engineering Degree, Mechanics (1995)
Ecole Supdrieure de l'Energie et des Materiaux, Orleans
Submitted to the Department of Mechanical Engineering in Partial Fulfillment of the Requirements for the Degree of
DOCTOR OF PHILOSOPHY at the
MASSACHUSETTS INSTITUTE OF TECHNOLOGY
June 2001
@ Massachusetts Institute of Technology All Rights Reserved
BARKER
MASSACHUSETTS INSTITUTE 0F TECHNOLOGY
JUL 16 001
LIBRARIES
Signature of the A uthor...
De echanical Engineering
June 2001
Certified by... ---Douglas P. Hart iate Profess .Oepartment of Mechanical Engineering Thesis Supervisor
A ccep ted b y ...
Ain A. Sonin Chairman, Department Committee on Graduate Studies
CHARACTERIZATION AND MODELING OF THE FUNDAMENTAL ASPECTS OF OIL TRANSPORT IN THE PISTON RING PACK
OF INTERNAL COMBUSTION ENGINES by
Benoist Thirouard
Submitted to the Department of Mechanical Engineering on May 10, 2001
in Partial Fulfillment of the Requirements for the Degree of Doctor of Philosophy
ABSTRACT
Engine oil consumption is one of the primary interests for the automotive industry in controlling emissions and reducing service cost. Due to a lack of understanding of the mechanisms of oil transport along the piston, reducing oil consumption from the ring pack of internal combustion engines has been extremely challenging for engine manufacturers and suppliers. This work addressed
the fundamental aspects of oil transport in the piston ring pack through experiments and modeling. A two-dimensional multiple-dye Laser-Induced Fluorescence (LIF) visualization system was successfully implemented in a diesel and a spark-ignition engine. Real time high resolution images of the ring pack oil distribution were acquired and analyzed for the entire range of operating conditions typically encountered by passenger car engines.
Based on experimental observations, major oil flow patterns in the piston ring pack were identified and characterized. Physically based models were proposed to describe each individual oil transport process, such as, oil flows on the piston lands in both axial and circumferential directions and oil flows through the ring grooves and gaps. Modeling results showed good agreement with the experimental data.
Then, using the individual oil transport models, the contributions of the different oil transport mechanisms to oil flow in and between the piston regions and the effects of piston and ring designs were analyzed. Finally, a global oil transport scheme was presented by integrating all major paths and mechanisms of oil transport along the piston. It highlighted that the rate at which oil is lost to the combustion chamber is mostly determined by the competing oil transport processes occurring on the piston lands. While the effect of the inertia force results in a net oil flow toward the top of the piston, the dragging action of the blow-by gases removes oil from the piston lands and recycles it to the crankcase.
This work was the first comprehensive investigation of the mechanisms of oil transport in the piston ring pack of internal combustion engines. It constitutes a major step in the development of analytical tools for oil consumption reduction.
Thesis Supervisor: Douglas P. Hart
ACKNOWLEGMENTS
I would like to thank my committee members for their guidance and constructive advice. In particular, I would like to thank Professor Douglas Hart, my advisor, and Professor John Heywood, Director of the Sloan Automotive Laboratory, for giving me the opportunity to conduct my doctoral studies at MIT. Furthermore, I would like to express the most special thanks to Tian Tian who has contributed to every part of my work at MIT. Tian Tian has been involved in my doctoral research as one of my committee members, as an everyday advisor and most importantly as a supportive friend. Among other things, I would like to thank Tian for his encouragement through the easy and most meaningfully the difficult and stressful moments. I would also like to thank Tian for his everyday inputs from which I gained insights on how to apply scientific knowledge to engineering problems. Not only Tian has been a key contributor to this project but he also taught me how to get the best out of my stay at MIT and has been the most supportive friend during the four and a half years spent in the Sloan Lab.
I would like to use this opportunity to thank the people from the industry sponsors of this project. First of all, I would like to thanks people from PSA Peugeot Citroen for their continuing and extensive support in this project. Especially, I would like to thank the PSA Research Department for providing the prototype single-cylinder research engine that was used to build the unique testing facility used in this project. I would like to express special thanks to Bernard Cousyn who gave me the opportunity to go to MIT as a visiting engineer and who strongly supported this project by encouraging PSA contribution to the Lubrication Consortium. I am particularly thankful to Bernard for his trust and very valuable advice. Inside PSA, I would also like to thank Thierry Duverger for dedicating part of his time to the design and assembly of the prototype engine and Jacques Theron for his expertise in the design of the optical access and the cooling jacket. I would also like to thanks Nick Lee for his help and support in this project. Eventually, I would like to thanks Nicolas Charollais, who have been a very supportive friend, for his very valuable inputs on engine control.
I would like to express special thanks to R6mi Rabut6 from Perfect Circle Europe (Dana Corp.), not only for his numerous and pertinent technical inputs and suggestions but also for his strong support in this project and its friendship. I also would like to thank R6mi Rabut6 for supplying prototype rings for both engines used in this work. I would like to thank Steve Systma, Kim Karrip and Randy Lunsford from Dana Corp. for their technical inputs. I would also like to thank Dr Mokhtar Maamouri from Renault for its valuable inputs and numerous advice, Adam Bloomberg, Frederick Stromstedt, Jonas Rick, and Bengt Olsson from Volvo for their support and interest in the project. Eventually, I would like to thank Mr. Kopf and Mr. Fiedler from Mahle GmbH for their technical expertise.
I would like to thank Dr. Victor Wong, Sloan Lab Manager, for his support and his help. Among the supporting staff, I would like to thank Brian Corkum, Pete Menard, John Baron and Thane Dewitt for their technical help and advice, and Nancy Cook, Suzanne Lutin and Karla Striker for their help and pleasant conversations. Eventually, I would like to express my gratitude to Leslie Reagan for the tremendous help she provides to the students of the Mechanical Engineering Department.
Among the graduate students and visiting engineers with whom I have shared time in the Sloan Lab I would like to thank Mark Kiesel from Caterpillar and Pierre Mulgrave for designing the optical access in the Kubota engine. I would like to express special thanks to Ertan Yilmaz, Bertrand Lecointe, Gerald Chamarre, Conor McNally and Liang Liu for their technical contribution and most importantly for making my time at MIT both enjoyable and fulfilling.
My stay at MIT has constituted my first experience of living abroad, away from my family and my friends at home with whom I had shared much of my free time in the past. Many persons outside the Sloan Lab have in their way contributed to make this experience unique and enjoyable. Among others I want to thank Booke Noordjig, Geoffrey Adams, Nicolai Cauchy, Mehri Sater, Marie-Laure Grillet, Steve Patterson, Michael Boccara, Micha Wiegel and Cornelius O'Sullivan. I also would like to express special thanks to my friends at home for their continuous esteem. Eventually, I want to thanks my family and especially my parents for their encouragement, trust and support.
This work was sponsored by the Consortium on Lubrication in Internal Combustion Engines, whose current members are Dana Corporation, Mahle GmbH, PSA Peugeot Citroan, Renault SA and Volvo.
TABLES OF CONTENTS
Abstract 2 Acknowledgments 3 Tables of Contents 4 List of Figures 8 List of Tables 14 CHAPTER 1. INTRODUCTION 18 1.1 Background 181.2 Lubrication versus Oil Consumption: Oil Transport 19
1.3 Related Previous Work 20
1.4 Thesis Objectives and Approach 21
CHAPTER 2. EXPERIMENTAL SETUP 22
2.1 Experimental Strategy 22
2.1.1 Experimental objectives 22
2.1.2 Measurement and diagnostic choices 22
2.1.3 Times scales 23
2.2 Experiments Configurations 25
2.2.1 Engine operating conditions 25
2.2.2 Window positions 27
2.2.3 Ring gap positions 28
2.2.4 Ring designs 31
2.3 Engines and Optical Access Design 34
2.3.1 The Kubota engine 34
2.3.1.1 Engine characteristics 34
2.3.1.2 Optical access 34
2.3.2 The PSA single-cylinder engine 36
2.3.2.1 Engine characteristics 36
2.3.2.2 Optical access and window design 37
2.3.2.3 Cooling system design 40
2.4 Diagnostics 42
2.4.1 Laser-Induced Fluorescence 42
2.4.1.1 Principle 42
2.4.1.2 Theory 43
2.4.1.3 Application 47
2.4.2 Calibration of the LIF signal 48
2.4.2.1 Temperature effect 36
2.4.2.2 Calibration challenges 49
2.4.2.3 Dual emission LIF technique 54
2.4.2.4 Dual emission calibration (applied in the Kubota engine) 60
2.4.2.5 Improved in-situ calibration (applied in the PSA engine) 64
2.4.3 Imaging system 71
2.4.3.1 Laser 72
2.4.3.2 Detection device 73
2.4.3.3 Control and timing 75
2.4.3.4 Complete optical setup 77
2.4.4 Blow-by measuring system 78
2.4.4.1 Challenges 78
2.4.4.2 Dampening system 80
2.4.4.3 Blow-by flowmeter 83
CHAPTER 3. CHARACTERIZATION OF OIL TRANSPORT MECHANISMS 85
3.1 Oil Transport on the Piston Lands 85
3.1.1 Inertia driven oil transport 85
3.1.1.1 Observation and description 85
3.1.1.2 Modeling 96
3.1.1.3 Results analysis 102
3.1.1.4 3-Dimensional aspects 111
3.1.2 Gas flow driven circumferential oil transport 115
3.1.2.1 Observations and description 115
3.1.2.2 Modeling 123
3.1.2.3 Effect of gas flow dragging on the uniformity of the oil layer 130 3.1.2.4 Effect of the uniformity of the oil layer on the oil transport rate 133
3.1.3 Gas flow driven axial oil transport 145 3.1.3.1 Effect of the axial gas flow resulting from the piston/liner 146
relative motion
3.1.3.2 Effect of gas exchange with the ring grooves and with adjacent 149 lands
3.2 Oil Transport between the Liner and the Piston Lands 152
3.2.1 Ring scraping 152
3.2.1.1 Description 152
3.2.1.3 Scraping observations 153
3.2.1.4 Implications for oil transport on the piston 154
3.2.2 Oil release 155
3.2.2.1 Observations 155
3.2.2.2 Description 158
3.2.2.3 Implications for oil transport 159
3.3 Oil Transport Through the Ring Groove 161
3.3.1 Oil transport from the lands into the grooves 161
3.3.1.1 Ring pumping 163
3.3.1.2 Pressure gradient due the inertia force 168 3.3.1.3 Lateral motion of the piston relative to the rings 170 3.3.1.4 Dragging of the gas flow from the lands to the grooves 171
3.3.1.5 Conclusions 172
3.3.2 Oil transport from the grooves to the lands 173
3.3.2.1 Ring squeezing 173
3.3.2.2 Gas flow in the ring/groove clearances 178
3.3.3 Conclusions 188
3.4 Oil Flow Through the Ring Gaps 189
3.4.1 Mechanisms 189
3.4.1.1 Gas driven flow 189
3.4.1.2 Inertia driven flow 195
3.4.2 Low load and closed throttle situations 196
3.4.2.1 Low load engine operation 196
3.4.2.2 Closed throttle situation 201
CHAPTER 4. OIL TRANSPOR ROUTES IN THE PISTON RING PACK 202
4.1 Dividing the Ring Pack Into Three Regions 202
4.2 Region 1: Controlling the Oil Supply to the Upper Ring Pack 204 4.2.1 Oil Supply
4.2.1.1 Twin-land oil control ring 205
4.2.1.2 Three-piece oil control ring 210
4.2.1.3 U-Flex oil control ring 211
4.2.1.4 Oil supply through the OCR gap 214
4.2.2 Internal Flow Pattern 214
4.2.2.1 Scraper ring with hook 215
4.2.2.2 Scraper ring without hook 218
4.2.2.3 Third land circumferential oil flow 219
4.2.3 Outward oil flows and net oil transports 219
4.2.3.1 Oil flow pass the OCR 220
4.2.3.2 Oil flow pass the scraper ring 223
4.3 Region2: Controlling the Oil Supply to the Top Ring Groove 228
4.3.1 Oil flows in and out of region 2 228
4.3.1.1 Through the second ring gap 228
4.3.1.2 From the second ring groove 229
4.3.1.3 To the top ring groove 229
4.3.1.4 Through the top ring gap 231
4.3.1.4 Top ring down scraping 232
4.3.2 Effect of the total amount of oil stored on the second land 233 4.3.2.1 Oil supply to the top ring groove lower clearance 233
4.3.2.2 Second land oil balance 234
4.4 Region 3: The Oil Consuming Region 240
4.4.1 Oil supply 241
4.4.2 Oil flow to the combustion chamber 242
4.5 Global Oil Transport Scheme 244
4.5.1 Reference case: Diesel engine and SI engines at high load 244
4.5.1.1 Upward oil transport 245
4.5.1.2 Downward oil transport 245
4.5.1.3 Occasional oil transport processes 245
4.5.1.4 Liquid oil consumption and main controlling points 246 4.5.2 SI engine running at low load and closed-throttle engine operation 247
CHAPTER 5. CONCLUSIONS 249
REFERENCES 253
ANNEX 1. 258
LIST OF FIGURES
Figure 2.1 Kubota engine operating range and tested operating conditions 26 Figure 2.2 PSA single-cylinder engine operating range and tested operating conditions 27 Figure 2.3 Description of the transient test conducted in the PSA single-cylinder engine 27 Figure 2.4a Ring pinned at the gap (method used in two-stroke engines) 29 Figure 2.4b Ring pinned away from the gap (method used in this project) 29 Figure 2.5 Kubota engine - Description of the ring gap positions for the experiments 30
conducted with top two ring pinned
Figure 2.6 PSA single-cylinder engine. Description of the ring gap positions for the 30 experiments conducted with top two ring pinned.
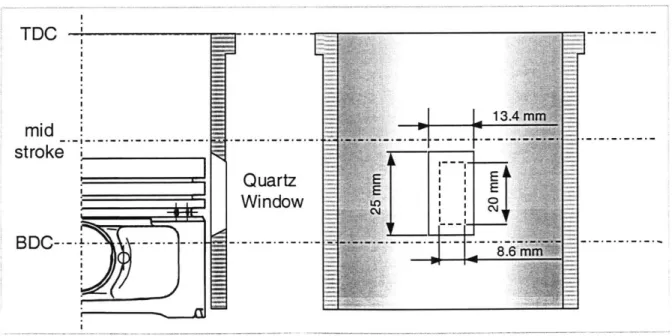
Figure 2.7 Most commonly used ring designs for spark ignition and small diesel engines 32 Figure 2.8 Description of ring configurations tested on the Kubota engine 33 Figure 2.9 PSA single-cylinder engine. Description of the tested ring gap geometry 33 Figure 2.10 Dimension and position of the quartz window installed in the liner of the 35
Kubota engine
Figure 2.11 Cooling jacket modification on the Kubota engine 36
Figure 2.12 Dimension and position of the sapphire window installed in the PSA engine 39 Figure 2.13 Cooling jacket design and clamping system in the PSA engine 39 Figure 2.14 Lubrication system of the PSA single-cylinder engine 41
Figure 2.15 Fluorescence process 41
Figure 2.16 Excitation and Absorption spectrum 43
Figure 2.17 Solid angle of fluorescence signal acquired 46
Figure 2.18 Example of Laser-Induced-Fluorescence image of the piston oil distribution 47 (PSA engine - 3500 rpm 500 mbar - Intake stroke 33)
Figure 2.19 Piston operating temperatures in vehicle engines at full load. (Source: Mahle 49 Mini Piston Manual)
Figure 2.20 Mineral oil oxidation (Source: IFP Lubricant Booklet) 50 Figure 2.21 Absorption and emission spectra for two dyes with small emission spectrum 53
overlap and significant pumping effect
Figure 2.22 Absorption and emission spectra for two dyes with large emission spectrum 53 overlap
Figure 2.24 Temperature response of Pyrro 567 (5.0 10-4 mol/liter) and Rhd 640 (2.0 10-4 59 mol/liter) while mixed together (Emission of Pyrro 567 measured at 570 nm with a 10 nm narrow-band filter, emission of Rhd 640 measured at 650 nm with a 10 nm narrow band filter)
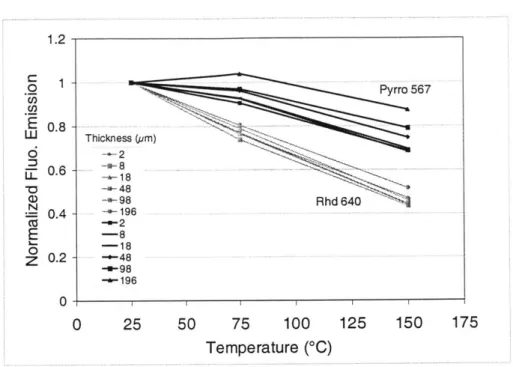
Figure 2.25 Thickness and temperature response of Pyrro 567 (5.0 10-4 mol/liter) and Rhd 59 640 (2.0 10-4 mol/liter) while mixed together (Emission of Pyrro 567 measured at 570 nm with a 10 nm narrow-band filter, emission of Rhd 640 measured at 650 nm with a 10 nm narrow band filter).
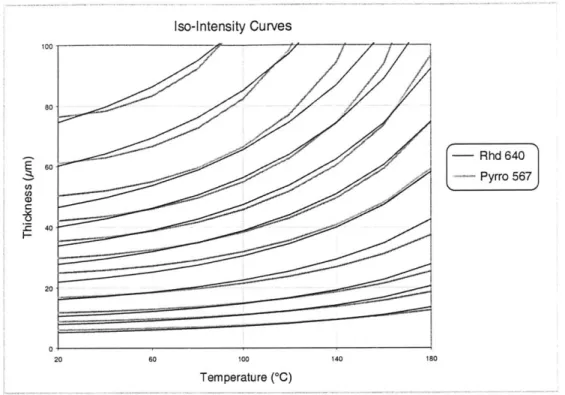
Figure 2.26 Curves of iso-intensity of fluorescence emission for Pyrro 567 (5.0 10-4 60 mol/liter) and Rhd 640 (2.0 10~4 mol/liter) while mixed together (Emission of Pyrro 567 measured at 570 nm with a 10 nm narrow-band filter, emission of Rhd 640 measured at 650 nm with a 10 nm narrow band filter)
Figure 2.27 Oil film thickness profile calibrated with Dual Emission Fluorescence 63 technique.
Kubota engine - 1200 RPM No load - Expansion stroke
Figure 2.28 Evolution of absorptivity and quantum yield efficiency with temperature for 65 Rhd 640 and Pyrro 567 ,
Figure 2.29 Evolution of the function G (agi.x) 67
Figure 2.30 Temperature response of Pyrro 567 (1.0 10~4 mol/liter) and Rhd 640 (1.0 10-4 68 mol/liter) while mixed together (Emission of Pyrro 567 measured at 570 nm with a 10 nm narrow-band filter, emission of Rhd 640 measured at 650 nm with a 10 nm narrow band filter)
Figure 2.31 Thickness and temperature response of Pyrro 567 (1.0 10-4 mol/liter) and Rhd 69 640 (1.0 10-4 mol/liter) while mixed together (Emission of Pyrro 567 measured at 570 nm with a 10 nm narrow-band filter, emission of Rhd 640 measured at 650 nm with a 10 nm narrow band filter)
Figure 2.32 Aspect of the oil layer on the piston lands with toll marks ( shown for an 70 average oil thickness of 30 /Lm)
Figure 2.33 Oil film thickness profile calibrated with Dual Emission Fluorescence 70 technique.
Kubota engine - 1200 RPM No load - Expansion stroke
Figure 2.34 Camera and laser timing 74
Figure 2.35 Example of burst acquisition for stroke to stroke oil distribution observation. 75 (Using frame transfer mode)
Figure 2.36 Timing of the LIF images acquisition and video frame rate 76
Figure 2.37 Complete optical setup 77
Figure 2.38 Engine and acquisition control diagram 78
Figure 2.39 Blow-by oscillations due to the piston motion 79
Figure 2.40 Fourth order acoustic filter (Electrical analogy) 80
Figure 2.41 Designed acoustic filter (Components and dimensions) 81 Figure 2.42 Performance of the blow-by acoustic filter: attenuation of the flow oscillations 83 Figure 2.43 Performance of the blow-by acoustic filter: oscillations of the crankcase 84
pressure
Figure 2.44 Blow-by meter design 84
Figure 3.1 Oil distribution on the piston lands of the Kubota engine, showing the effect of 86 the inertia force on the second oil accumulation
Figure 3.2 Inertia force computed for the Kubota engine running at 1200 rpm (Timing of 86 the LIF image acquisition)
Figure 3.3 Effect of the engine speed on the inertia-driven oil displacement 87 Figure 3.4 Effect of the volume of the oil accumulation on the inertia-driven displacement 88 Figure 3.5a Cycle resolved evolution of the third land oil distribution, showing the effect of 89
the inertia force (I)
Figure 3.5b Cycle resolved evolution of the third land oil distribution, showing the effect of 90 the inertia force (II)
Figure 3.6 Description of the parameters used for the thin film modeling 91 Figure 3.7 Description of the formation of a steep edge at the front of oil puddles 93 Figure 3.8 Formation of a steep edge at the front of oil puddles observed in the Kubota 94
engine
Figure 3.9 Rolling-over process occurring a the front edge of oil puddles displaced by the 95 inertia force
Figure 3.10 Puddle motion. Description of the oil flow and modeling approach 96 Figure 3.11 Description of the computation scheme used to determine the position of the 98
front edge of puddles moving under the effect of the inertia force
Figure 3.12 Modeling of the spreading of an oil puddle undergoing the inertia force 100 (Assumptions and results)
Figure 3.13 Computed evolution of the shape and position of a two-dimensional oil puddle 101 with repeated oil supply
Figure 3.14 Comparison between the computed and measured axial distribution of the oil 103 accumulated on the second land
Figure 3.15 Computed effect of the engine speed and oil volume on the distance traveled by 103 the front edge of a two-dimensional puddle
Figure 3.16 Description of the inertia-driven oil transport across the piston lands (I) 105 Figure 3.17 Description of the inertia-driven oil transport across the piston lands (II) 106 Figure 3.18 Computed effect of the engine speed and oil volume on the maximum height of 107
a two-dimensional puddle
Figure 3.19 Computed effect of the engine speed and oil volume on the aspect ratio of a 108 two-dimensional puddle
Figure 3.20 Computed non-dimensional puddle width (The surface was generated with 109 linear interpolation of the data points)
Figure 3.21 Computed non-dimensional puddle maximum height (The surface was 109 generated with linear interpolation of the data points)
Figure 3.22 Surface showing the non-dimensional puddle width computed with the 110 analytical function fitted to the data points obtained with the inertia-driven flow model
Figure 3.23 Surface showing the non-dimensional puddle maximum height computed with 110 the analytical function fitted to the data points obtained with the inertia-driven flow model
Figure 3.24a 3-dimensional aspect of the third land oil distribution (I) 113 Figure 3.24b 3-dimensional aspect of the second land oil distribution(II) 114 Figure 3.25 Circumferential oil flow observed on the second land of the Kubota engine (I) 115 Figure 3.26 Circumferential oil flow observed on the second land of the Kubota engine (II) 116 Figure 3.27 Lands pressures and gas flow rate at the gaps in the Kubota engine at 1200 rpm 117
1N.m load (Results computed with RINGPACK-OC)
Figure 3.28 Circumferential oil transport observed on the second land of the PSA engine 117 Figure 3.29 Circumferential oil transport observed on the third land of the PSA engine 118 Figure 3.30 Circumferential oil transport observed on the second land of the PSA engine 119
while the blow-by was negative
Figure 3.31 Description of the gas flow and oil profile used for modeling the dragging 120 action of the blow-by gases
Figure 3.32 Wavy aspect of the second land oil layer (PSA engine - Compression stroke) 122 Figure 3.33 Wavy aspect of the second land oil layer (PSA engine - Expansion stroke) 123
Figure 3.34 Figure 3.35 Figure 3.36 Figure 3.37 Figure 3.38 Figure 3.39
Figure 3.40 Computed evolution of the rate of oil transport with the cumulative volumetric gas flow (Initial puddle shape corresponding to the puddle-type oil distribution) Figure 3.41 Computed evolution of the rate of oil transport with the cumulative volumetric
gas flow (Initial puddle shape corresponding to the wave-type oil distribution)
Definition of the control volume for the evaluation of the second land circumferential oil distribution
Circumferential repartition of the oil around a piston land (second or third) plotted as a function of the relative positions of the ring gaps
Effect of the relative position of the top two ring gaps observed in the Kubota engine
Total volume of oil accumulated on a land plotted as a function of the relative positions of the gaps
Blow-by flow rate measured in the PSA engine and rate of the circumferential gas flows sweeping the second and third land (calculated with RINGPACK-OC)
Description of the axial gas flow induced by the piston/liner relative motion (secondary gas flow)
Comparison between oil displacement induced by the secondary gas flow and the inertia force
Reynolds number and flow rate of the gas flow sweeping the second land (Calculated for the PSA engine with RINGPACK-OC)
Ratio of the convection and viscous dissipation terms for the gas sweeping the second land (Calculated for the PSA engine with RINGPACK-OC)
Definition of the piston land sectors
Definition of the two types of oil distribution used for the modeling of oil transport induced by the dragging action of the blow-by gases
Computed evolution of the shape and position of a two-dimensional oil puddle dragged by gas flow (Initial shape corresponding to the wave-type oil distribution)
Computed evolution of the shape and position of a two-dimensional oil puddle dragged by gas flow (Initial shape corresponding to the puddle-type oil distribution) 138 139 140 141 143 144 148 124 125 128 129 131 132 135 136 Figure 3.42 Figure 3.43 Figure 3.44 Figure 3.45 Figure 3.46 Figure 3.47 Figure 3.48
Figure Figure Figure Figure Figure Figure Figure Figure Figure Figure Figure Figure Figure 3.49 3.50 3.51 3.52 3.53 3.54 3.55 3.56 3.57 3.58 3.59 3.60 3.61 Scraping mechanism
Oil scraping by the upper land of the OCR observed in the PSA engine Oil scraping by the scraper ring observed in the PSA engine
Oil release from the hook of the Napier ring observed in the PSA engine Oil release from the hook of the Napier ring observe in the Kubota engine Description of the oil release mechanism
Oil flow out of the ring grooves observed in the PSA engine (I) Oil flow out of the ring grooves observed in the PSA engine (II). Oil pumping and squeezing observed in the Kubota engine
Oil flow through the top ring groove following a sudden increase of the amount of oil on the second land
Ring lift and inertia force computed for the Kubota
Oil transport to the ring groove, timing of the inertia force and ring lift
Description of the oil transport into the ring groove resulting from the pressure gradient generated by the inertia force
Description of the oil transport into the ring groove resulting from the lateral motion of the piston relative to the rings
Main squeezing direction for inside and outside sealing configurations
Effect of the ring static twist on the rate of oil squeezing on both side of the ring (assuming rectangular groove).
Determination of the direction of the net oil transport through the ring groove (assuming that there is no ring flutter)
Instantaneous oil squeezing rate at the lower clearance of the top ring groove (Calculated with RINGPACK-OC for the PSA engine running at 2500 rpm 500 mbar)
Cycle-averaged oil squeezing rate at the lower clearance of the top ring groove (Calculated for the PSA engine running at 2500 rpm 500 mbar)
Computed rate of oil transports induced the dragging action of the blow-by gases in the side clearances of the top ring groove (Computed for the PSA engine)
Computed rate of oil transports induced the dragging action of the blow-by gases in the side clearances of the second ring groove (Computed for the PSA engine) 152 154 155 156 157 157 162 163 164 165 166 166 168 170 174 174 175 177 177 180 180 Figure 3.62 Figure 3.63 Figure 3.64 Figure 3.65 Figure 3.66 Figure 3.67 Figure 3.68 Figure 3.69
Figure 3.70 Computed rate of oil transports induced the dragging action of the blow-by 181 gases in the upper side clearance of the OCR (Computed for the PSA engine)
Figure 3.71 Top and second ring lift computed for the PSA engine running at 2500 rpm 300 181 mbar. Left figure: average cylinder pressure trace and top ring groove oil filling 20%.Right figure: lower than average cylinder pressure trace and top ring groove oil filling 80%
Figure 3.72 Intermittent top ring fluttering observed in the PSA engine running at 2500 rpm 184 300 mbar
Figure 3.73 Oil flow through the second ring gap and mist formation observed in the 190 Kubota engine
Figure 3.74 Left figure: width of the gas flow close to the gap. Right figure: description of 191 the oil control volume used to compute the rate of oil transport at the gaps
Figure 3.75 OCR gap observed in the Kubota engine 192
Figure 3.76 Description of the gas-driven mechanism of oil transport through the ring gaps 193 Figure 3.77 Large oil accumulation observed above the OCR gap in the PSA engine running 195
at low load
Figure 3.78 Top ring gap observed at low load in the PSA engine 197
Figure 3.79 Oil flow from the third to the second land observed at the second ring gap in the 199 PSA engine running at low load (4500 rpm)
Figure 3.80 Oil flow from the third to the second land observed at the second ring gap in the 200 PSA engine running at low load (2500 rpm)
Figure 3.81 Oil flow from the third to the second land observed at the second ring gap in the 200 PSA engine running at low load (3500 rpm)
Figure 4.1 Definition of the ring pack regions 203
Figure 4.2 Piston tilt and land/liner clearances of the twin-land OCR, calculated for the 206 PSA engine running at 2500 rpm 500-mbar intake pressure
Figure 4.3 Wetting conditions of the scraper ring when used with a twin-land OCR, 207 calculated for the PSA engine at 2500 rpm 500-mbar intake pressure
Figure 4.4 Second ring scraping observed in the PSA engine 208
Figure 4.5 Second ring scraping observed in the Kubota engine 208
Figure 4.6 Effect of the twin-land OCR tension on the second and third land oil 209 accumulation (observed in the Kubota engine)
Figure 4.8 Oil squeezed from the OCR groove to the third land, observed in the Kubota engine while using a U-flex OCR
Figure 4.9 U-flex structure and deformation of the U-flex flanks
Figure 4.10 Oil transport from the third land to the hook of the Napier ring
Figure 4.11 Oil transport from the hook to the third land and to the liner (Observed in the PSA engine)
Figure 4.12 Oil and gas flows through gaps U-flex OCR
Figure 4.13 Effect of various OCR designs on oil transports between the upper skirt region and the third land region
Figure 4.14 Effect of the second ring/third land geometry on the second land oil accumulation (I)
Figure 4.15 Effect of the second ring/third land geometry on the second land oil accumulation (II) Figure 4.16 Figure 4.17 Figure 4.18 Figure 4.19 Figure 4.20 Figure 4.21 Figure 4.22 Figure 4.23 Figure 4.24 Figure 4.25 Figure 4.26
Computed second ring lift for the Kubota engine running at 2000 rpm 35% load Effect of various scraper ring design on oil transports in and out of the third land region
Description of top ring flutter and reverse flutter Second land oil balance
Schematic description of engine speed and load effect on the second land oil balance
Effect of engine load on the second land oil accumulation (measured in the PSA engine)
Effect of engine speed on the second land oil balance (measured in the PSA engine)
Oil squeezed out of the top ring groove toward the crown land (observed in the PSA engine)
Top ring oil squeezing and inertia-driven oil transport observed on the crown land of the PSA engine
Description of oil transport on the crown land
Global oil transport scheme for diesel engine and spark ignition engine at high load (Intake pressure > -500 mbar)
212 213 216 216 221 222 223 224 225 227 230 236 237 238 239 239 242 243 244
Global oil transport scheme for spark ignition engine running at low load 247 (Intake pressure 300 -500 mbar)
Global oil transport scheme for spark ignition engine with closed or near to 248 closed throttle (intake pressure <-200 mbar)
Figure 4.27
LIST OF TABLES
Table 2.1 Potential driving forces for oil transport in the piston ring pack 24 Table 2.2 Description of the engine configurations and running conditions tested in the 255
PSA single-cylinder engine
Table 2.3 Description of the engine configurations and running conditions tested in the 258 Kubota single-cylinder engine
Table 2.4 Kubota engine characteristics 34
Table 2.5 PSA single-cylinder engine characteristics 37
Table 2.6 Optical material properties 38
CHAPTER 1. INTRODUCTION
1.1 Background
Today's research in internal combustion engines is driven by the demand for reduced pollutant emissions and improved fuel economy and customer satisfaction. The performances of the piston ring pack, which are measured in terms of friction loss, oil consumption, oil degradation and wear, affect all these three factors. Unburned and partially burned oil flowing into the exhaust accounts for hydrocarbon and particulate emissions [1, 2, 3, 4]. Additionally, some of the chemical compounds present in oil additives, mainly high sulfur content ones, are poisonous to catalytic converters and thus dramatically reduce their conversion efficiency [5, 6]. Oil flow to the combustion chamber through the piston/liner interface is estimated to account for 40 to 80% of the total engine oil consumption [7]. Minimizing oil consumption from the piston ring pack is therefore of primary interest when trying to reduce lubricant originated emissions. The ring friction, which is an increasing function of the ring sealing ability [8] and hence inversely related to oil consumption, is estimated to account for 10 to 20% of the total engine friction power loss [9, 10]. Eventually, the degradation of the oil properties, which results from high temperature oxidation and combustion soot contamination occurring in the piston ring pack [1, 11], limits the lubricant lifetime and thus affect the customer satisfaction.
In order to meet the increasingly stringent regulations on emissions and fuel economy, new engine designs such as direct injection gasoline and diesel engines are now implemented in passenger cars. Meanwhile the specific power output is increased by allowing higher engine speed and lighter materials such as aluminum alloys are used in the design of new engine blocks. As a result, the thermal and mechanical stresses and deformation have been greatly enhanced, making the ring pack lubrication and sealing ability more critical. Consequently, designing efficient and reliable piston and piston rings for new engine development is increasingly challenging for engine manufacturers and
1.2 Lubrication versus Oil Consumption: Oil transport
The primary function of the piston rings is to prevent the leakage of gases from the combustion chamber to the crankcase, and to create a heat path for the cooling of the piston crown. Because the rings are sliding along the liner and the groove sides, lubrication is needed to minimize friction and wear. Consequently, a sufficient lubricant supply must be allowed to the contact regions, whose most critical ones, namely the top ring running surface and groove, constitute direct links to the combustion chamber. The performance of the piston ring pack can thus be regarded as a compromise between friction, wear, and oil consumption. The key to minimizing oil consumption is to optimize oil transport within the piston ring pack. Because the regions above the oil control ring are only partly flooded with oil [12, 13], the rate at which oil flows from the upper skirt region to the combustion chamber is the result of numerous oil transport processes between the various regions defined by the ring pack geometry, namely the piston lands, the ring grooves, and the liner [14].
One of the major difficulties for oil transport analysis lies in the number of sub-regions and the multitude of flow paths. For instance, oil may flow from one land to another through the grooves, the gaps or the ring liner interface. Furthermore, due to the motion of the rings in their grooves, connections between ring grooves and piston lands are repeatedly opened and closed, making the gas and oil flows highly coupled with the ring dynamics [14]. Potential driving forces for oil transports between the different part of the piston ring pack are pressure gradients, shear stress from gas flows, ring/liner and ring/groove relative motion and inertia forces. Pressure gradients and resulting gas flows greatly vary in amplitude and direction with the engine load. For instance, in typical passenger car spark ignition engine, from closed to wide opened throttle (WOT) the blow-by flow rate varies from negative values (toward the combustion chamber) to several liters per minute per cylinder toward the crankcase; the absolute intake pressure varies from about 170 mbar to 1 bar, and the peak cylinder pressure from several bars to about 60 bar. Besides, from 1000 to 6000 rpm, the average inertia force induced by the piston alternating motion varies from 280 to 10 000 m/s2
. Consequently,
oil transports are expected to exhibit great variations over the range of potential engine operating conditions. Eventually, oil consumption and thus oil transports were found to be significantly affected by the detailed geometry of the ring pack components, to name a few, ring and groove relative angles, ring running surfaces [15, 16, 17], piston land geometry [18, 19] and bore thermal and mechanical deformations [20, 21].
Due to the underlined complexities associated with the optimization of the ring pack lubrication and sealing ability, a thorough characterization of the fundamental aspects of oil transport is critical for further improvements of piston and piston ring designs. Moreover, to reduce development lead-time
and costs, the demand for analytical tools to predict oil consumption has increased. Consequently, there is a strong need for physically based oil transport models.
1.3 Previous related work
Oil may flow through the piston ring pack along two routes, namely, the liner and the piston. These paths are geometrically connected by the rings and thus oil may be transported between the liner and the piston. Oil displacements along the liner, which are governed by the ring/liner lubricating conditions, have been thoroughly studied [22, 23, 24, 14] and are now very well modeled [25, 26, 27]. Oil transport along the piston involves oil flow across the lands, through the ring grooves and gaps. The oil flows through the ring grooves require oil from the piston lands to be supplied to the ring/groove clearances and are therefore highly related to oil displacements on the lands. The oil flows out of the ring/groove side clearances are mostly determined by the ring/groove interactions and the resulting oil squeezing process, which have been studied and modeled in great details by T. Tian [14]. A few attempts to model oil transport driven by the flow of blow-by gases through the ring gaps have been reported [28]. However, due to the lack of experimental validations and the absence of model to predict the oil supply to the region upstream of the gaps, the significance of the results was limited. As today, due to lack of direct experimental observations and theoretical efforts, the oil mechanical behavior on the piston lands has never been thoroughly investigated. Consequently, even though some of the controlling factors for flows within the piston ring pack such as the ring and piston dynamics have been extensively studied [29, 30, 31, 32, 33, 14], very little success was achieved in modeling the oil flow along the piston. Accordingly, no comprehensive study of oil transports through the piston/liner interface was yet conducted.
Although well-developed one-point Laser-Induced-Fluorescence technique have had success in quantifying the oil film thickness between the rings and the liner [34, 35, 36, 37, 38, 39, 40, 41], it was not sufficient for studying oil transport processes on the piston as oil moves both axially and circumferentially. Other than observations of oil flows in non-firing glass-liner engine, which for obvious reasons were of little interest, there is a limited amount of published work reporting two-dimensional visualization of oil transport on the piston. In 1995 Inagaki and al. [42], using a flash lamp as light source, developed the first two-dimensional LIEF oil film measuring system. Their work demonstrated the benefits of having a two dimensional view of the evolution of the oil distribution during engine operation.
1.4 Thesis objectives and Approach
Controlling the oil transport among various regions of the piston ring pack is the key to optimization of oil consumption in internal combustion engines. The major obstacle for the development of analytical tools that could help reducing oil consumption has been the lack of understanding of oil transport processes on the piston lands and of their interactions with oil transports through the ring grooves and gaps. Accordingly, the primary objectives of this thesis are to:
1. Based on experiments, identify and characterize the different oil transport mechanisms between the various sub-regions of the piston ring pack.
2. Propose a physically based model to describe the oil transport processes on the piston lands and their coupling with the oil flows to the other sub-regions.
3. Propose a mass-conserving oil transport scheme describing the main oil routes through the piston ring pack.
4. Study the effect of engine operating conditions and piston ring designs on the oil flows along the piston.
In this work, a two-dimensional visualization system, based on multiple-dye LIF technique, was designed to conduct direct real-time observation of the oil distribution in the piston ring pack during engine operation (Chapter 2). The setup was implemented in both a diesel and a spark ignition single cylinder engine. In order to correlate observed oil displacements with potential driving forces, simulation codes developed in the Sloan Automotive Laboratory by T. Tian [25, 26, 27, 33] were used to compute the ring dynamics and the gas flows between the various sub-regions of the piston ring pack. First, each type of oil transport, namely, oil transport on the lands, through the grooves, through the gaps and between the lands and the liner, were identified and characterized. Then, the physical mechanisms governing each oil transport process were proposed (Chapter 3). A specific theoretical effort was devoted to modeling the oil transport on the piston lands. Then, dividing the ring pack in three zones, oil transport processes were analyzed region by region, emphasizing the effect of the ring design and engine operating conditions on the ability to control the oil supply to the critical areas that are the top ring groove and the crown land (Chapter 4). Eventually, in an attempt to provide a comprehensive description of the routes of oil transport through the piston ring pack, a global oil transport scheme was proposed.
CHAPTER 2. EXPERIMENTAL SETUP
2.1 Experimental Strategy
2.1.1 Experimental Objectives
In order to achieve a full characterization of the various oil transport processes taking place in the piston ring pack, the oil flux and oil distribution need to be qualitatively and quantitatively related to the forces driving the oil motions. Therefore, the paths and rates of oil flows as well as the amplitude and direction of the driving forces must be accurately determined. Accordingly, the experimental objective can be divided in four tasks:
1- Identification of the main oil routes.
2-Understanding the driving forces and governing factors behind each oil transport mechanisms.
3- Provide quantitative data on oil flow rates and oil distribution in the piston ring pack. 4- Provide the measurements needed to compute the amplitude of the driving forces.
2.1.2 Measurement and Diagnostic Choices
Due to the complexity of the ring pack geometry and the resulting multitude of potential flow paths, 2-dimensional direct observation of the oil distribution was found to be the most suited way to identify the main oil routes through the piston ring pack. This method implies the design of an optical access in the cylinder liner and the use of an adequate visualization technique. Laser-Induced-Fluorescence (LIF) was chosen as the visualization technique because it can provide clear images of a correctly doped media. Moreover, the fluorescence intensity is a function of the volume of media that is excited and therefore the optical signal can be converted into quantitative measurements. By using a laser as excitation source very short exposure time (-a few nanoseconds) can be achieved. In fact, exposure time must be less than 1 As to obtain sharp images of the piston at 5000 rpm. Eventually, in order to develop and validate oil transport models it was necessary to obtain quantitative oil distribution data. Consequently, a great deal of effort was put in developing a reliable calibration technique.
The forces that may drive oil through the piston ring pack are of four types:
- Mechanical actions: the lubricant can be displaced by a moving part like for instance the piston moving relative to the liner or a ring moving in its groove.
- Body force: the alternative piston motion creates a strong body force (up to 2000g) that is acting on the lubricant moving with the piston. This force will be called inertia force in this work.
- Pressure drop and pressure gradient: the significant pressure difference between the combustion chamber and the crankcase results in a series of pressure gradients and pressure drops within the ring pack.
- Shear stress on the surface on the lubricant layer: gas flows between the different regions of the ring pack induce shear stress at the interface between the gas and the oil layers.
The computation of the inertia force is trivial and therefore its amplitude and direction is perfectly known at any time during the engine cycle. The piston and ring dynamics as well as the gas flows and pressure distribution have to be computed with an elaborate simulation code. RINGPACK-OC, which is the main code used in this work, was developed in the Sloan Auto Lab by T.Tian [14]. The accuracy of this code on predicting ring dynamics, gas flows and pressures mainly depends on the accuracy of the input parameters such as cylinder pressure and piston and liner geometry during engine operation. In particular, piston and liner clearances all along the stroke must be known with a great accuracy and thus thermal deformations must be taken into account. Even though the exact piston and liner dimensions can be very difficult to evaluate, the critical values such as the amplitude of the bore and piston deformation can be obtained by tuning the model to match blow-by measurements. This procedure requires having accurate measurements of the blow-by flow rate for the engine operating conditions tested. For this reason, a great deal of effort was put into the design of a reliable blow-by measurement device. Using the cylinder pressure trace and the blow-by measurements, the RINGPACKOC simulation code was used to provide detailed descriptions of the ring dynamics and the gas flows through the gaps and grooves.
2.1.3 Time Scales
The time scale of the different oil transport driving factors varies from a few crank angle degrees for the motion of the rings in their grooves to one complete engine cycle for the flow of blow-by gases through the entire ring pack.- Moreover, as oil transports are repeated every cycle, some of them may lead to oil accumulation processes that last for hundreds of engine cycles. Therefore, to study the
few milliseconds to several minutes. The optical diagnostic system was designed to accommodate these constraints. To study oil transports that take place at a specific time interval with a span of a few crank angle degrees, the optical window must cover the piston position that corresponds to this particular timing. Therefore, to maximize the possibility of oil transport observations, the optical access had to be designed such that the longest possible part of the piston stroke could be seen.
Oil Transport Potential Types of transport Characterization Measurement required
Driving Forces induced of the driving
forces
Relative motion of: Using Blow-by
Piston and the liner Scraping, RINGPACK-OC Cylinder pressure
Rings in their groove Squeezing, Simulation code
Rings along the liner Pumping
Inertia force Body force driven Computation of
flow the piston
acceleration
Pressure gradient Poiseuille flow Using Blow-by
RINGPACK-OC Cylinder pressure Simulation code
Shear-stress at the oil surface Couette flow Using Blow-by
RINGPACK-OC Cylinder pressure Simulation code
2.2
Experiment Configurations
2.2.1 Engine Operating Conditions
One of the main objectives of this project was to study oil transports over the whole range of operating conditions encountered by today's passenger car engines. The oil transport driving forces are greatly affected by the engine speed and load variations. For instance, the inertia force typically varies from 400 m/s2
at 1000 rpm to 20 000 m/s2
at 6000 rpm. On a spark-ignition engine the blow-by flow rate per cylinder (net flow rate of gases flowing through the ring pack) can vary from zero (or even negative values) to several liters per minutes as the throttle is moved from a closed to a fully opened position. The two engines used for this work allowed us to cover the entire range of operating conditions needed for a complete characterization of oil transport mechanisms. Both engines were coupled with a motoring dynamometer and could thus be spun independently of the engine load. The Kubota engine is a diesel engine with a speed range that spans from 800 to 3000 rpm. As any naturally-aspirated diesel engine its intake-manifold pressure is constant and almost equal to atmospheric pressure through the entire load range. As a result, the combustion chamber pressure is always equal or larger than the crankcase pressure, and therefore gases flowing through the ring pack are mostly flowing toward the crankcase. In order to cover most of its operating range, the Kubota engine was tested in nine different running conditions shown in Figure 2.1, which were all firing conditions with positive torque was output. The PSA single cylinder engine is a spark-ignited engine with a speed range that spans from 1000 rpm to 6000 rpm. Its load variation is obtained by changing the intake manifold pressure. The domain of operating conditions of the PSA single-cylinder engine and the steady-state running conditions tested are shown in Figure 2.2. Due to the presence of a complete valve train and four balancing shafts the friction losses and thus the torque output of the single-cylinder engine was not representative of a real car engine. Accordingly, the line separating the negative and positive torque output shown in Figure 2.2 was measured on the four-cylinder engine (two-liter displacement) from which the single-cylinder engine is derived.
In real driving conditions, negative loads are typically encountered when the accelerator is suddenly released while driving at a significant speed. In this case, the throttle is closed and the engine is driven by the car inertia. As a result, the pressure in the intake manifold can decrease below 200 mbar. In spark ignition engines, when the intake pressure is decreased below the crankcase pressure
(~ atmospheric pressure), gases and oil in the ring pack region are pulled toward the combustion chamber. This phenomenon can lead to dramatic oil consumption level if the intake pressure is
maintained very low [42]. Therefore, it was important to exactly duplicate and thoroughly study the engine operating conditions leading to very low intake manifold pressure. In today's production engine the minimum intake manifold pressure is limited by action of the ECU on the throttle position. Typically, the minimum accepted intake manifold pressure is between 170 and 200 mbar. At such low level of intake pressure the engine always output negative torque. Consequently, in a car, very low intake manifold pressure can only be obtained during transient operating conditions (typically accelerator release while the car is cruising) and thus can not be maintained for more than 30 seconds. Moreover, during this type of transient engine operation from high load to closed throttle, the injection is shut off to save gasoline and therefore the engine is not firing. Transient tests representative of the transient engine operations described above were conducted (see Figure 2.3).
Torque Output
(N.m) 15
Nm Max Torque Output
---0 0 0 0 0 Spe 20 200 ( 2000 2800 3000 (RPM) 1200 10-5 10 0
Figure 2.1 -Kubota engine operating range and tested running conditions.
Kubota Diesel Engine
Area of possible engine operation
0 Tested running conditions
Intake Manifold Pressure (mbar) 1000. WOT
o
o©
o 0 0 280 mbar 0 320 mbar 200 mbar 170 mbar Spe( 1000 2500 3500 4500 6000 (RPClosed throttle Minimum intake pre
Figure 2.2 - PSA single cylinder engine and tested operating conditions.
Intake Manifold Pressure (mbar) 700 Engine firing X = 1.00 1%pl -L 10 Minutes 200
.-Figure 2.3 - Description of the
Injection shut off
15 seconds 3 minutes
01
Time
Video Acquisition Duration
transient test conducted in the PSA single-cylinder engine.
2.2.2
Window positions
In the Kubota engine the window was located on the anti-thrust side and could not be moved. Therefore, all the observations were conducted at the same circumferential location. The liner of the
Mi) ssure 700 -500 -300 -200
-PSA single-cylinder engine
Areas of possible engine operation
Positive torque output Negative torque output
o Running conditions in
Steady state operation Running conditions
0 tested during transient
Engine Speed:
4500 RPM
0.5 secondI
to be located either on the thrust side or on the anti-thrust side. The piston secondary motion can locally affect ring motions [27, 43] and gas flows and thus has an effect on oil transport and oil consumption [44]. In order to study the effect of the piston secondary motion on the lubricant behavior in the piston ring pack, observations were conducted on both the thrust and the anti-thrust side for most of the operating conditions tested on the PSA single-cylinder engine (see Table 2.2 in annex 2).
2.2.3
Ring gap positions
First, due to the presence of the ring end gaps the oil distribution in the piston ring pack is not axi-symmetric. Therefore, it was necessary to conduct oil distribution observations with the ring gaps located at different circumferential positions relative to the observation window. Moreover, the relative angle between the ring gaps has an effect on the repartition of the circumferential gas flows sweeping the piston lands and thus on oil transports. Accordingly, experiments had to be conducted for different relative positions of the gaps. Consequently the positions of the ring gaps had to be measured or fixed.
Secondly, observations of the lubricant behavior in the piston ring pack have shown that the oil distribution on the piston lands was not reaching a steady state during stabilized engine operation. The amount of oil accumulated in the different regions of the piston ring pack was continuously changing on a time scale of several thousands engine cycles (several minutes). As a consequence, the oil distribution data were very difficult to interpret. Furthermore, the unsteady aspect of the oil distribution was found to be directly related to the evolution of the gap locations while the rings were rotating around the piston. In order to facilitate the identification and understanding of oil transport mechanisms, the unsteady lubricant behavior had to be suppressed and therefore the ring rotation prevented. This was achieved by pinning the ring in their groove. Finally, by pinning the rings, the position of the ring gaps relative to each other and relative to the observation window could be set and fixed.
In order to not alter oil transports, it was necessary to pin the ring without restricting the ring axial motion (ring lift in its groove) and the gas flows through the ring grooves and gaps. For this reason, the rings were not pinned at the gap like it is usually done in two stoke engines (see Figure 2.4a). Instead the rings were pinned away from the gap as shown in Figure 2.4b. With this method the gap geometry is not modified and the gas flows through gaps and grooves are not altered. The only drawback of this method is that the local ring tension is slightly affected by the presence of the slot machined on the backside of the ring. In the experiments conducted with pinned rings, only the top
two rings were pinned. The oil control ring was not pinned for the following reasons. First, due to their complex geometry, twin-land OCR and three-piece OCR are difficult to pin without restricting their axial motion. In the case of U-flex OCRs, there is no need to prevent them from rotating since they are completely axi-symmetric once assembled. Secondly, due to their high tension, OCRs rotate around the piston much slower than the top two rings and therefore their rotation does not introduce strong unsteady oil distribution.
The different configurations of ring gap positions tested in the pinned-ring experiments are described in Figure 2.5 for the Kubota engine and in Figure 2.6 for the PSA single cylinder engine.
Eventually, to investigate the effect of the ring rotation on the lubricant behavior and to observe oil transports in configuration identical to a production engine, experiments with non-pinned rings were conducted for all the tested engine operating conditions.
Figure 2.4a - Ring pinned at the gap. Figure 2.4b - Ring pinned away from the gap Method used in two-stroke engine. Method used in this project.
Top two rings pinned "on the window side" (anti-thrust side)
Top two rings pinned "opposite to the window" (thrust side)
Thrust Side]
nti-Thrust Side
I .-
-Top Ring Scraper
gap Ring
ggap
Window
Crown Land ---.
Skit
Figure 2.5 - Kubota engine - Description of the ring gap positions for the experiments conducted with top two ring pinned.
Top two rings pinned pinned on the piston pin axis Top two rings pinned on the piston pin axis
Window on the anti-thrust side Window on the thrust side
Liner -Th Top Ring gap Pin axis Scraper Ring gap Anti-T
rust Side Liner
=-Top Ring gap Scraper Ring gap-hrust Sid~e] Crown Land
Figure 2.6 - PSA single-cylinder engine. Description of the ring gap positions for the experiments conducted with top two ring pinned.
.... .. . ... Liner -"
Piston
Top ing Scraper T apRRigg
p
Rin 1.1* 11* 11* I ---Skict L ---- i2.2.4 Ring Designs
The ring designs that are most commonly used in today's small diesel and spark-ignition engines are presented in Figure 2.7. In this project, the mechanisms of oil transports were first investigated using the original ring pack of each engine (see Figure 2.8 and 2.9). Then, different ring designs chosen among the most commonly used ones were tested. By observing the effects of changing ring geometry, a better understanding on the ring-related oil transport mechanisms can be gained and the benefits and drawbacks of the different ring designs can be analyzed.
The original ring pack of the Kubota engine, described in Figure 2.8, is composed of a half-keystone top ring, a scraper ring with hook (hereinafter called Napier ring) and a twin-land oil control ring. Four design variations were tested in the Kubota engine (Figure 2.8). Two of them were made to study how oil transports are affected by the specific geometrical features associated with the Napier ring, namely the hook and the third land cut-off. These two design changes are described below:
1- The Napier ring was replaced by a scraper ring without hook. This scraper ring had no torsion chamfer. It had a tapered face and therefore had a slight negative twist. Scraper rings without hook and without torsion chamfer are not commonly used but by using one we were able to specifically study the effect of the hook on oil transports.
2- A cut-off was machined in the upper part of the third land and the original Napier ring was used. In most applications, Napier rings are used in association with a third-land cut-off that matches the hook geometry. As the original design of the Kubota piston does not have any cut-off, this configuration was used to observe the effect of the third land cut-off on oil transports.
The two other design variations made on the Kubota engine ring pack consisted in changing the oil control ring type. As all the oil supply to the upper ring pack has to flow by the oil control ring, it was important to examine the effect of any of the three typical OCR designs on the lubricant behavior. Therefore a three-piece OCR and a U-Flex OCR were tested in the Kubota engine. Additionally, oil distribution was observed for three different tensions of the twin-land oil control ring.
The half keystone top ring, which is an intermediate design between the keystone ring used in heavy-duty diesel engines and the rectangular ring used in light-heavy-duty ones, is not commonly used in recently designed engines. Therefore, the effect of the half-keystone geometry on oil transports seems to be of little interest. However, a half-keystone top ring has a positive static twist, and therefore the data obtained with this ring were used to gain insights on how positively-twisted top rings affect oil transports in other engines.