Publisher’s version / Version de l'éditeur:
Vous avez des questions? Nous pouvons vous aider. Pour communiquer directement avec un auteur, consultez la première page de la revue dans laquelle son article a été publié afin de trouver ses coordonnées. Si vous n’arrivez Questions? Contact the NRC Publications Archive team at
PublicationsArchive-ArchivesPublications@nrc-cnrc.gc.ca. If you wish to email the authors directly, please see the first page of the publication for their contact information.
https://publications-cnrc.canada.ca/fra/droits
L’accès à ce site Web et l’utilisation de son contenu sont assujettis aux conditions présentées dans le site LISEZ CES CONDITIONS ATTENTIVEMENT AVANT D’UTILISER CE SITE WEB.
Technical Report (National Research Council of Canada. Institute for Ocean Technology); no. NRC-IOT-6318, 2006-02
READ THESE TERMS AND CONDITIONS CAREFULLY BEFORE USING THIS WEBSITE. https://nrc-publications.canada.ca/eng/copyright
NRC Publications Archive Record / Notice des Archives des publications du CNRC :
https://nrc-publications.canada.ca/eng/view/object/?id=db2dacd4-05da-46ac-9c84-991baaacfc3d https://publications-cnrc.canada.ca/fra/voir/objet/?id=db2dacd4-05da-46ac-9c84-991baaacfc3d
NRC Publications Archive
Archives des publications du CNRC
For the publisher’s version, please access the DOI link below./ Pour consulter la version de l’éditeur, utilisez le lien DOI ci-dessous.
https://doi.org/10.4224/12340937
Access and use of this website and the material on it are subject to the Terms and Conditions set forth at
Comparison of the strength of iceberg and other freshwater ice and the effect of temperature
National Research Council Conseil national de recherches Canada Canada Institute for Ocean Institut des technologies
Technology océaniques
COMPARISON OF THE STRENGTH OF ICEBERG AND OTHER
FRESHWATER ICE AND THE EFFECT OF TEMPERATURE
TR-2006-07
Stephen J. Jones
February 2006
DOCUMENTATION PAGE
REPORT NUMBER
TR-2006-07
NRC REPORT NUMBER DATE
February 2006
REPORT SECURITY CLASSIFICATION
Unclassified
DISTRIBUTION
Unlimited
TITLE
COMPARISON OF THE STRENGTH OF ICEBERG AND OTHER FRESHWATER ICE AND THE EFFECT OF TEMPERATURE
AUTHOR(S)
Stephen J. Jones
CORPORATE AUTHOR(S)/PERFORMING AGENCY(S)
Institute for Ocean Technology, National Research Council, St. John’s, NL
PUBLICATION
Institute for Ocean Technology, National Research Council, St. John’s, NL
SPONSORING AGENCY(S)
PERD/CHC Report 20-83
IOT PROJECT NUMBER
42-2093-10
NRC FILE NUMBER KEY WORDS
Temperature, iceberg, ice
PAGES iii, 15 FIGS. 14 TABLES 4 SUMMARY
Based on literature results, the temperature of an iceberg around the Grand Banks of Newfoundland is shown to vary from –2oC at the surface to approximately –20oC at depth. This temperature variation affects the strength of the ice. The strength of iceberg ice is shown to be 1.7 times less than other freshwater ice at a strain-rate of 10-3s-1, probably due to pre-existing cracks. Using an activation energy of
80kJ/mol., the uniaxial compressive strength of iceberg ice is shown to vary from 5 MPa at –2oC near the surface, to 8 MPa at –20oC, at 10-20m depth.
ADDRESS National Research Council
Institute for Ocean Technology Arctic Avenue, P. O. Box 12093 St. John's, NL A1B 3T5
ABSTRACT
Based on literature results, the temperature of an iceberg around the Grand Banks of Newfoundland is shown to vary from –2oC at the surface to
approximately –20oC at depth. This temperature variation affects the strength of the ice. The strength of iceberg ice is shown to be 1.7 times less than other freshwater ice at a strain-rate of 10-3s-1, probably due to pre-existing cracks. Using an activation energy of 80kJ/mol., the uniaxial compressive strength of iceberg ice is shown to vary from 5 MPa at –2oC near the surface, to 8 MPa at –20oC, at 10-20m depth.
TABLE OF CONTENTS Abstract...iii List of Tables ... iv List of Figures ... iv 1.0 INTRODUCTION...1 2.0 ICEBERG TEMPERATURES...1
3.0 COMPRESSIVE STRENGTH DATA...6
4.0 CONCLUSIONS...13
5.0 REFERENCES...14
LIST OF TABLES Table 1. Uniaxial compressive strength test results at –5oC (El-Tahan et al., 1984) ...6
Table 2. Uniaxial compressive strength data for iceberg ice from Nadreau (1985) ...6
Table 3. Failure stress data from Sinha and Frederking (1987) ...6
Table 4. Uniaxial compressive strength of iceberg ice (Gagnon and Gammon, 1985) ...7
LIST OF FIGURES Figure 1. Temperature data obtained from icebergs near St. John’s, Newfoundland in 1983 (Diemand, 1984)...2
Figure 2. Ice temperature registrations of Iceberg #13 from 15 April to 13 July, 1989 (Løset, 1993)...2
Figure 3. Ice temperature profile from Iceberg #13, 27 April 1989. Snow depth 0 cm and air temperature 1.6oC (Løset, 1993)...3
Figure 4. Distance from surface vs temperature profiles for six thermal probes in an iceberg in Okak Bay, Labrador (Gagnon and Gammon, 1997)...3
Figure 5. Iceberg temperature data from Diemand (1984), Løset (1993) and Gagnon’s bergy bit data (Cumming et al., 2001). Note maximum depth in this figure is 6 m. ...4
LIST OF FIGURES (cont'd)
Figure 6. Iceberg temperature data from Goodrich (1987) and Gagnon and Gammon (1997). Note depths reach 20 m...4 Figure 7. Uniaxial compressive strength data for iceberg ice at –10oC except
where noted. ...7 Figure 8. Uniaxial compressive strength data for all freshwater ice excluding
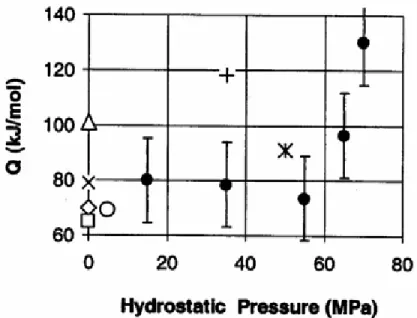
iceberg ice, ...8 Figure 9. Combined data from Fig 7 and 8 above...9 Figure 10. All data as in Fig. 9, but without distinguishing the different authors...9 Figure 11. All data less than a strain-rate of 10-3s-1. ... 10 Figure 12. All data for strain-rates greater then 10-3 s-1... 10 Figure 13. Variation of activation energy, Q, with temperature for iceberg ice. .. 11 Figure 14. Result of combining the mean iceberg data at –10oC in Fig. 11 above
with an activation energy of 80kJ/mol. derived from Barrette and Jordaan (2003). The –10oC line is the best fit to the data in Fig.11, and the other two lines are calculated for –2oC and –20oC. ... 12
COMPARISON OF THE STRENGTH OF ICEBERG AND OTHER FRESHWATER ICE AND THE EFFECT OF TEMPERATURE
1.0 INTRODUCTION
The temperature of the ice making up an iceberg is not constant. It has been found to vary significantly with depth. Since the properties of ice, particularly its strength, depend on temperature it follows that in an iceberg-structure collision the force generated will depend on the temperature of the ice.
This paper reviews briefly the temperature data for icebergs, and then shows how the strength of glacial, or iceberg, ice depends on temperature.
2.0 ICEBERG TEMPERATURES
The temperature of an Antarctic iceberg was measured as long ago as 1902 (von Drygalski, 1983). He monitored the temperature of a large, 1 km long, iceberg at depths down to 20 m, over an extended period from April 1902-January 1903. Below a depth of 15 m the temperature was constant at about –10oC. Above this depth the temperature varied with the seasonal air temperature. While
interesting, these large icebergs are not subject to the same climate nor to the same rolling and wave action as is found in the northern hemisphere in the region of the Grand Banks and, therefore, his measurements are not directly relevant to this review.
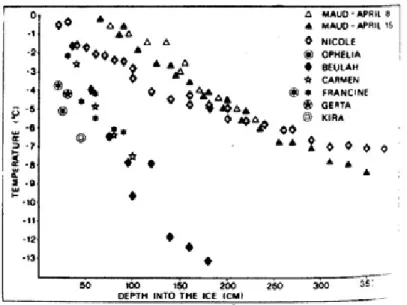
Diemand (1984) measured the temperature of several icebergs in the vicinity of St. John’s, Newfoundland, during the spring and summer of 1983. She showed, first, that rapid ablation at the surface leads to a high temperature gradient in the ice, or colder surface ice, and second that the internal temperature at a depth of 2-3 m was, in one iceberg, as low as –13oC, as shown in Fig. 1. She concluded that the original temperature of icebergs found in the North Atlantic is in the vicinity of –17oC.
Figure 1. Temperature data obtained from icebergs near St. John’s, Newfoundland in 1983 (Diemand, 1984).
LØset (1993[a]) measured the temperature in an iceberg in the Barents Sea at an initial depth of 2 m as a function of time between April and July 1989. As shown in Fig. 2, the original temperature at this depth was -13.4oC, warming up as the ice melted and the thermometer reached the surface. He also quoted a value of –12.5oC at a depth of 6 m from another borehole measurement (Fig. 3).
Figure 2. Ice temperature registrations of Iceberg #13 from 15 April to 13 July, 1989 (Løset, 1993).
Figure 3. Ice temperature profile from Iceberg #13, 27 April 1989. Snow depth 0 cm and air temperature 1.6oC (Løset, 1993)
Løset (1993[b]) gives results of numerical modeling of the internal temperatures of icebergs in the Barents Sea. He showed that the temperature in the central region of an iceberg is almost unaffected by the thermal conditions imposed on its boundary. Thus the original temperature of an iceberg at the time of calving is retained in its core owing to the insulating properties of the ice. He also showed that the temperature at a depth of about 12 m into the ice is essentially constant and unaffected by boundary influences, and proposed this as a method of
deducing from where an iceberg had calved. If this is the case, it is probable that in Fig. 1 above, the icebergs measured came from two different sources, one significantly colder than the other.
Figure 4. Distance from surface vs temperature profiles for six thermal probes in an iceberg in Okak Bay, Labrador (Gagnon and Gammon, 1997).
Gagnon and Gammon (1997) measured the internal temperature of an iceberg grounded in Okak Bay, Labrador, at six places with results as shown in Fig. 4. There is a significant temperature gradient near the surface with temperatures falling to –15oC at depths of 4 - 10 m depending on the specific location of the probe relative to the submerged ice surface.
-16 -14 -12 -10 -8 -6 -4 -2 0 0.0 1.0 2.0 3.0 4.0 5.0 6.0
Depth into ice m
Temperature oC Maud, 15 April Maud, 8 April Nicole, 4 May Ophelia, 14 May Beulah, 20 May Carmen, 10 June Francine, 26 June Gerta, 26 June Kira, 3 July Gagnon, B05 Gagnon, B14 Gagnon, B16 Loset (1993)
Figure 5. Iceberg temperature data from Diemand (1984), Løset (1993) and Gagnon’s bergy bit data (Cumming et al., 2001). Note maximum depth in this figure is 6 m.
igure 6. Iceberg temperature data from Goodrich (1987) and Gagnon and Gammon
-25 -20 -15 -10 -5 0 0 2 4 6 8 10 12 14 16 18 20
Depth into ice m
T e m p er atu re o C Berg 1, 84/03/28 Berg 1, 84/05/30 Berg 2, 84/03/28 Berg 2, 84/05/15 Berg 2/2, 84/03/28 Berg 2/2, 84/05/15 Berg 2/3, 84/03/28 Berg 2/3, 84/05/15 G & G 97, probe 1 G & G 97, probe 2 G & G 97, probe 3 G & G 97, probe 4 G & G 97, probe 5 G & G 97, probe 6 F
All these data, and additional data from Gagnon’s bergy bit experiments
(Cumming et al., 2001), were digitized and plotted in Figs. 5 and 6 above. Note that Fig. 5 only goes to 6 m depth while Fig. 6 goes to 20 m. Goodrich (1987) data is slightly unusual in that in some cases the surface temperature was colder than the interior temperature while the reverse is true for all the other
measurements. This simply reflects the colder air temperatures at the time of his measurements, which were carried out between March and May 1984 at the northern end of Baffin Island. The other measurements were made at locations further south, off Labrador or Newfoundland, and somewhat later in the year. All the measurements show a steep temperature gradient at the surface and a more constant temperature at a depth of 10 m or so. The value of this interior temperature seems to vary from about -7to -17oC, but it is unlikely to be lower than -20oC. The temperature at the water-ice interface must always be close to –2oC, the freezing point of seawater, but the surface temperature will reflect the seasonal air temperature.
We conclude that for icebergs off the Grand Banks of Newfoundland, it is very unlikely that the temperature at depth in an iceberg is lower than –20oC, while the temperature at the ice-water interface will be about –2oC. This, then, is the
temperature range of interest for a study of the mechanical properties of iceberg ice.
3.0 COMPRESSIVE STRENGTH DATA
El-Tahan et al. (1984, 1988) conducted three types of tests on iceberg ice as well as snow ice namely, uniaxial compressive, indentation, and impact tests. The compressive tests were done at –5oC, over a strain-rate range of 10-4 to 10-1 s-1 and their mean results are shown in Table 1 reproduced below:-
Table 1. Uniaxial compressive strength test results at –5oC (El-Tahan et al., 1984)
Ice Type Mean
strain-rate s-1 Mean strength MPa Mean tangent modulus GPa Mean time to failure s Mean strain at failure % Iceberg ice 0.82 x 10⁻³ 0.59 x 10⁻² 0.58 x 10⁻¹ 7.43 6.6 6.97 5.04 5.97 6.7 2.38 0.20 0.02 0.19 0.12 0.11
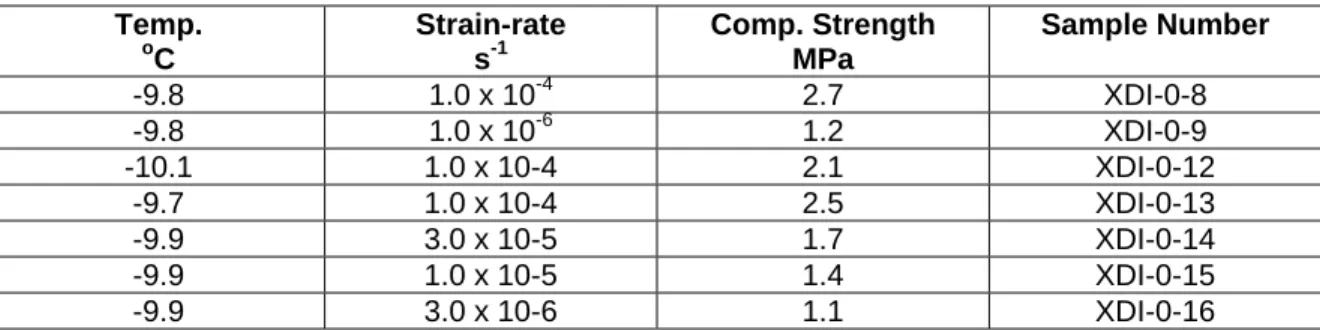
Nadreau (1985) included some iceberg ice samples in his study of the compressive strength of ice under uniaxial, and confined, conditions. His unconfined data, taken from his Table 4.11, are given below in Table 2.
Table 2. Uniaxial compressive strength data for iceberg ice from Nadreau (1985) Temp. o C Strain-rate s-1 Comp. Strength MPa Sample Number -9.8 1.0 x 10⁻⁴ 2.7 XDI-0-8 -9.8 1.0 x 10⁻⁶ 1.2 XDI-0-9 -10.1 1.0 x 10⁻⁴ 2.1 XDI-0-12 -9.7 1.0 x 10⁻⁴ 2.5 XDI-0-13 -9.9 3.0 x 10⁻⁵ 1.7 XDI-0-14 -9.9 1.0 x 10⁻⁵ 1.4 XDI-0-15 -9.9 3.0 x 10⁻⁶ 1.1 XDI-0-16
Sinha and Frederking (1987) have reported compressive strength data for iceberg ice at –10oC. Their data, taken from their Fig.7, is listed below in Table 3.
Table 3. Failure stress data from Sinha and Frederking (1987) Strain-Rate s-1 Failure Stress MPa 1 x 10⁻⁷ 1.1 1 x 10⁻⁶ 1.6 1 x 10⁻⁵ 1.9 3 x 10⁻⁵ 4.0 1 x 10⁻⁴ 4.8 3 x 10⁻⁴ 5.5
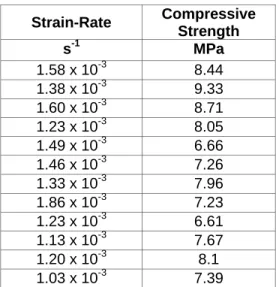
Gagnon and Gammon (1985) reported results for the uniaxial and triaxial
compressive strength of iceberg ice. Their uniaxial results are shown in Table 4 below, all at a strain-rate of about 10-3 s-1.
Table 4. Uniaxial compressive strength of iceberg ice (Gagnon and Gammon, 1985)
Strain-Rate Compressive Strength s-1 MPa 1.58 x 10⁻³ 8.44 1.38 x 10⁻³ 9.33 1.60 x 10⁻³ 8.71 1.23 x 10⁻³ 8.05 1.49 x 10⁻³ 6.66 1.46 x 10⁻³ 7.26 1.33 x 10⁻³ 7.96 1.86 x 10⁻³ 7.23 1.23 x 10⁻³ 6.61 1.13 x 10⁻³ 7.67 1.20 x 10⁻³ 8.1 1.03 x 10⁻³ 7.39
Lachance and Michel (1987) have reported extensive data on the uniaxial compressive strength of iceberg ice in the brittle region of strain-rates, above 10-4s-1. Their data are shown in Fig. 7 together with others as indicated.
igure 7. Uniaxial compressive strength data for iceberg ice at –10oC except where noted. 0.1
1 10 100
1.0E-08 1.0E-07 1.0E-06 1.0E-05 1.0E-04 1.0E-03 1.0E-02 1.0E-01 1.0E+00 1.0E+01
Strain-rate s-1
Uniaxial Compressive Strength MPa
Gagnon & Gammon(1995) Jones et al. (2003) HS Jones et al. (2003) LS Sinha and Frederking (1987) El. Tahan et al. (1988) -5C Nadreau (1985)
Lachance & Michel (1987)
An extensive set of measurements on the uniaxial compressive strength of
iceberg ice as a function of strain-rate at –10oC has been reported by Jones et al. (2003). Their two sets of data refer to the use of two different testing machines; high-speed (HS) and low speed (LS). Their data are shown in Fig. 7 above together with all the other data previously mentioned. From strain-rates of 10-8 to 10-3 s-1, the compressive strength rises fairly uniformly with strain-rate, and then levels off and falls somewhat with increasing rate to 10-1 s-1, before rising again at very high rates. However, the data are much more scattered at these high strain-rates, which are in any case higher than that anticipated for most ice-structure interactions.
igure 8. Uniaxial compressive strength data for all freshwater ice excluding iceberg ice,
e have excluded data from Hobson’s Choice Ice Island because the origin of
or comparison, Fig. 8 shows all available data for freshwater ice of either r 0.1
1 10 100
1.0E-08 1.0E-07 1.0E-06 1.0E-05 1.0E-04 1.0E-03 1.0E-02 1.0E-01 1.0E+00 1.0E+01 1.0E+02
Strain-rate s-1
Uniaxial Compressive Strength MPa
Jones (1982) Cole (1987)-5C Meglis (1998) Dutta et al. (2004) Ramseier (1976) Jones (1997) F
–10oC except where noted.
W
that ice is not thought to be glacial (Jeffries et al., 1991) but formed largely by superimposed ice and bottom accretion.
F
natural or laboratory grown origin. All the results are for –10oC except Cole (1987), which is for –5oC. These data show much less scatter particularly fo strain-rates less than 10-3s-1. Fig. 9 below combines all the data of Figs. 7 an 8 into one figure. To illustrate better the difference between iceberg ice and other freshwater ice strengths, Fig. 10 shows the data of Fig. 9 grouped into the two types of ice, iceberg and freshwater, but without distinguishing the different authors.
Overall, the results in Fig. 10 show that iceberg ice is slightly weaker than the other freshwater ice types. At the lowest strain-rates there is no difference but above 10-6s-1, the freshwater data show somewhat higher strengths than the iceberg ice.
Figure 10. All data as in Fig. 9, but without distinguishing the different authors. 0.1
1 10 100
1.0E-08 1.0E-07 1.0E-06 1.0E-05 1.0E-04 1.0E-03 1.0E-02 1.0E-01 1.0E+00 1.0E+01 1.0E+02
Strain-rate s-1
Uniaxial compressive strength MPa
Iceberg Freshwater 0.1
1 10 100
1.0E-08 1.0E-07 1.0E-06 1.0E-05 1.0E-04 1.0E-03 1.0E-02 1.0E-01 1.0E+00 1.0E+01 1.0E+02
Strain-rate s-1
Uniaxial Compressive Strength MPa
Gagnon and Gammon (1995) Jones et al (2003) HS Jones et al (2003) LS Sinha and Frederking (1987) El. Tahan et al. (1988) -5C Nadreau (1985) Lachance & Michel (1987) Jones (1982) Meglis (1998) Dutta (2004) Cole (1987) -5C Ramseier (1976) Jones (1997)
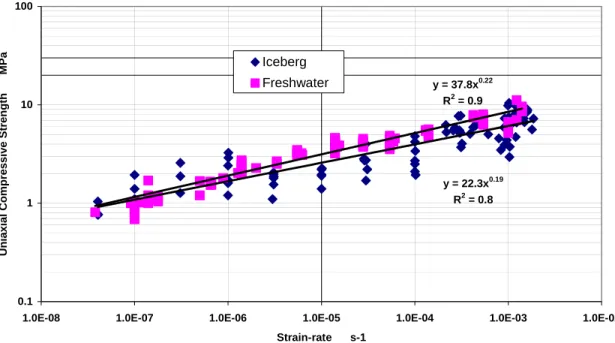
In Figs. 11 and 12 we have broken down these data into two groups depending on strain-rate. Fig 11 includes data up to 10-3 s-1 while Fig. 12 contains only the data above 10-3s-1. Least squares straight lines have been fitted to the data, which are very scattered in Fig. 12.
y = 22.3x0.19 R2 = 0.8 y = 37.8x0.22 R2 = 0.9 1 10 100
1.0E-08 1.0E-07 1.0E-06 1.0E-05 1.0E-04 1.0E-03 1.0E-02
Uniaxial Compressive Strength MPa
0.1
Strain-rate s-1
Figure 11. All data less than a strain-rate of 10-3s-1.
Figure 12. All data for
Iceberg Freshwater y = 3.40x-0.02 R2 = 0.02 y = 8.23x0.07 R2 = 0.24 1 10 100
1.0E-03 1.0E-02 1.0E-01 1.0E+00 1.0E+01 1.0E+02
Strain-rate s-1
Uniaxial compressive strength MPa
Freshwater Iceberg
strain-rates greater then 10-3 s-1.
Fig. 11 shows tha n the iceberg
ice data by a factor of 1.7 at strain-rates close to 10-3s-1, but are virtually identical t the freshwater ice strength data are higher tha
at rates below 10-6s-1. Any impact scenario between a structure and an iceberg would involve the higher end of this strain-rate range. Fig. 12 shows that the freshwater strength data are approximately twice the iceberg ice data, although there is considerable scatter and some variation with strain-rate.
We conclude that for strain-rates appropriate to iceberg-structure interaction, the strength of iceberg ice is one half that of other types of freshwater ice. This weaker strength for the iceberg ice is probably due to the presence of pre-existing cracks in that ice, but no account has been taken of possible grain size effects (Cole, 1987).
Barrette and Jordaan (2003) have tested iceberg ice as a function of hydrostatic confining pressure and of temperature, but unfortunately they gave no data at zero confining pressure. We can use their data, however, to determine the temperature dependence of the strength of iceberg ice. They maintained a constant axial stress of 15 MPa and varied temperature from –26oC to –5oC, and confining pressure from 10 to 65 MPa. They interpreted their data using the well-known equation combining Glen’s (or Norton’s) law with an Arrhenius relationship
) Q -exp( ) ( n A σ ε&= --- (1) RT where ε& agreement is strain-rate, σis stress, A is a constant, n is the exponent of the
power-law relationship, Q is the activation energy, R is the universal gas constant and T is the absolute temperature. Their major result was that Q varied with confining pressure, as shown in Fig. 13, but at the low confining pressures
elevant to this review, the activation energy, Q, was 80 kJ/mol. in r
with the value previously obtained by Barnes et al. (1971).
By combining this value for Q and the mean line for iceberg ice in Fig. 11 abo we can derive Fig. 14 below, which shows the expected temperature
dependence for the strength of iceberg ice.
ve,
In Fig. 14, the –10oC line is the best fit to the iceberg ice data in Fig. 11. The other two lines are calculated from this line using equation (1) above with the values, Q=80kJ/mol., n=5.04 (Jones, 1982), R=8.31 J/mol.K and T is absolute temperature (K). Equation (1) can be re-written as:-
Figure 14. Result of combining the mean iceberg data at –10oC in Fig. 11 above with an activation energy of 80kJ/mol. derived from Barrette and Jordaan (2003). The – 10oC line is the best fit to the data in Fig.11, and the other two lines
calculated for –2 are o C and –20oC. ⎥ ⎦ ⎤ ⎢ ⎣ ⎡ = 2 1 2 1 1 -1 exp T T nR Q σ σ --- (2)
where the subscripts 1 and 2 refer to the strengths corresponding to two different temperatures. If T1 is –10oC (263 K) and T2 is –20oC (253 K), then
2 1=0.75•σ σ or σ2 =1.330•σ1 Similarly, if T1 is –10oC, and T2 is –2oC, 2 1=1.24•σ σ or σ2 =0.81•σ1 -20oC -10 oC -2oC 1 10
1.0E-06 1.0E-05 1.0E-04 1.0E-03
Strain-rate s-1
Using these ratios, the two lines in Fig. 14 corresponding to –2oC and –20oC were drawn from the –10oC line. From Fig. 14 and the above equations, it is clear that the ratio of strengths between –2oC and –20oC is
) 2 ( ) 20 (- =1.65•σ -σ 4.0 CONCLUSIONS
The temperature of an iceberg on the Grand Banks of Newfoundland varies from about –2oC at the surface to no less than –20oC at a depth of between 10-20m. The strength of iceberg ice is less than other freshwater ice, laboratory grown or natural. At –10oC, and at a strain-rate of 10-3s-1, typical of ice-structure
interaction, iceberg ice has a strength of approximately 1.7 times less than other freshwater data in the literature. This difference increases to a factor of 3.0 less at the highest strain-rates tested, 10+1 s-1, but the data in this region are very scattered. This difference is probably due to pre-existing cracks and flaws in the iceberg ice. At very low strain-rates, below 10-6 s-1, there is no difference in the
The uniax ing
temperatu of interest to this study, -2 to –20oC, the strength increases by a factor of 1.65. At a strain-rate of 10-3s-1, this gives a strength of 5 MPa at the surface of an iceberg (-2oC) and 8 MPa at a depth of 10-strength of iceberg and other freshwater ice.
ial compressive strength of ice is known to increase with decreas re. In the temperature range
5.0 REFERENCES
Walker, J.C.F., 1971. The friction and creep of
y. Soc. London, A324, p. 127-155.
ompressive behaviour of laboratory-grown and iceberg ice. Cold Regions Barnes, P., Tabor, D., and
polycrystalline ice. Proc. Ro
Barrette, P. D., and Jordaan, I. J., 2003. Pressure-temperature effects on the c
Science and Technology, 36, p. 25-36.
Cole, D.M., 1987. Strain-rate and grain-size effects in ice. J. Glaciol. 33, 115, p. 274-280.
Cumming, D., Gagnon, R. E., Ritch, R., Browne, R. P., Johnston, M., Frederking, R., and Ralph, F., 2001. Overview of Bergy Bit Impact Trials Carried Out on the CCGS Terry Fox - June 2001. Institute for Marine Dynamics, TR-2001-10.
gh strain rate loading. Int. J. Offshore and Polar Engineering, 14, 3, p. 182-188.
El-Tahan, H., Swamidas, A.S.J., Arockiasamy, M., and Reddy, D.V., 1984. Strength of iceberg and artificial snow ice under high strain-rates and impact loads. Proc. 3rd OMAE, ASME, New York, 3, p. 158-165.
El-Tahan, H., Swamidas, A.S.J., Arockiasamy, M., 1988. Impact/indentation strength of iceberg and artificial snow ice. J. Offshore Mechanics and Arctic
Engineering, 110, p. 87-93.
Gagnon, R.E., and Gammon, P.H., 1995. Triaxial experiments on iceberg and glacier ice. J. Glaciol., 41, No. 139, p. 528-540.
Gagnon, R.E., and Gammon, P.H., 1997. In situ thermal profiles and laboratory impact experiments on iceberg ice. J. Glaciol., 43, No. 145, p. 569-582.
Goodrich, L.E., 1987. Core temperature measurements on three Arctic icebergs.
Proc. OMAE ’87, Houston, ASME, New York, 4, p. 103-107.
Jeffries, M.O., Serson, H.V., Krouse, H.R., and Sackinger, W.M., 1991. Ice physical properties, structural characteristics and stratigraphy in Hobson’s Choice Ice Island and implications for the growth history of East Ward Hunt Ice Shelf, Canadian High Arctic. J. Glaciol., 37, 126, p. 247-260.
Diemand, D., 1984. Iceberg temperatures in the North Atlantic – theoretical and measured. Cold Regions Science and Technology, 9, p. 171-178.
Dutta, P.K., Cole, D.M., Schulson, E.M., and Sodhi, D.S., 2004. A fracture study of ice under hi
Jones, S.J., Gagnon, R.E., Derradji, A., and Bugden, A., 2003. Compressive trength of iceberg ice. Can. J. Physics, 81, No. 1/2, p. 191-200.
. J.
,
Ø
tes de pression. Ph.D thesis, Rapport GCS-85-05, Sciences et
e. n
isson’s ratio of iceberg ice. Workshop on Extreme 6.
Iceberg Research, 6,
s
Jones, S.J., 1982. The confined compressive strength of polycrystalline ice
laciol., 28, p. 171-177.
G
Jones, S.J., 1997. High strain-rate compression tests on ice. J. Phys. Chem. B 101, No. 32, p. 6099-6101.
Lachance, J., and Michel, B., 1987. Experimental study of the brittle behaviour of iceberg ice. Proc. POAC ’87, Fairbanks, Alaska, 3, p.11-19.
LØset, S., 1993[a]. Numerical modeling of the temperature distribution in tabular icebergs. Cold Regions Science and Technology, 21, p. 103-115.
set, S., 1993[b]. Thermal energy conservation in icebergs and tracking by L
temperature. J. Geophysical Research, 98, No. C6, p. 10,001-10,012. eglis, I., 1998. High speed testing of freshwater granular ice. Institute for M
Marine Dynamics, National Research Council of Canada, Report CR-1998-02 Nadreau, J-P., 1985. Lois de comportement et de fluage de la glace granulaire
imulée de crê s
Génie, Universite Laval, Quebec.
Ramseier, R.O., 1976. Growth and mechanical properties of river and lake ic hèse D.Sc., U iversité Laval, Québec, Canada. Also Manuscript Report Series, T
No. 40, Department of the Environment, Ottawa, Canada.
Sinha, N.K., and Frederking, R., 1987. Preliminary observations on compressive trength, deformation and Po
s
Ice Features, Banff, NRC Technical Memorandum 141, NRCC 28003, p.413-42 on Drygalski, E., 1983. The temperatures of the iceberg.
V
p. 10-12. Translated from Deutsche-Südpolar Expedition 1901-03, 1, Hft. 4, Chapter 11, p. 650-52.