Publisher’s version / Version de l'éditeur:
Proceedings: 8th International Conference on Contact Mechanics and Wear of
Rail, Wheel Systems: 15th - 18th September 2009, Firenze, Italy, 2009
READ THESE TERMS AND CONDITIONS CAREFULLY BEFORE USING THIS WEBSITE. https://nrc-publications.canada.ca/eng/copyright
Vous avez des questions? Nous pouvons vous aider. Pour communiquer directement avec un auteur, consultez la
première page de la revue dans laquelle son article a été publié afin de trouver ses coordonnées. Si vous n’arrivez pas à les repérer, communiquez avec nous à PublicationsArchive-ArchivesPublications@nrc-cnrc.gc.ca.
Questions? Contact the NRC Publications Archive team at
PublicationsArchive-ArchivesPublications@nrc-cnrc.gc.ca. If you wish to email the authors directly, please see the first page of the publication for their contact information.
Archives des publications du CNRC
This publication could be one of several versions: author’s original, accepted manuscript or the publisher’s version. / La version de cette publication peut être l’une des suivantes : la version prépublication de l’auteur, la version acceptée du manuscrit ou la version de l’éditeur.
Access and use of this website and the material on it are subject to the Terms and Conditions set forth at
Study of friction: measurement, analysis and practical implications for
the wheel/rail contact
Magel, Eric; Liu, Yan
https://publications-cnrc.canada.ca/fra/droits
L’accès à ce site Web et l’utilisation de son contenu sont assujettis aux conditions présentées dans le site LISEZ CES CONDITIONS ATTENTIVEMENT AVANT D’UTILISER CE SITE WEB.
NRC Publications Record / Notice d'Archives des publications de CNRC:
https://nrc-publications.canada.ca/eng/view/object/?id=37d072e5-e09a-4255-a92c-5b82c698b073 https://publications-cnrc.canada.ca/fra/voir/objet/?id=37d072e5-e09a-4255-a92c-5b82c698b073STUDY OF FRICTION – MEASUREMENT, ANALYSIS AND PRACTICAL
IMPLICATIONS FOR THE WHEEL/RAIL CONTACT
Eric Magel* and Yan Liu
National Research Council, Canada * Eric.Magel@nrc-cnrc.gc.ca
ABSTRACT
Through a range of increasingly featured models of wheel-rail contact, vehicles and track it is possible to model in great detail the vehicle/track performance. But one aspect of the wheel/rail interaction that remains poorly understood and more poorly applied in models is the traction-creepage characteristic. Most models depend on the theory of Kalker, one that applies to “scrupulously clean surfaces”. A simple scaling factor approach to the Kalker model is available in many of the existing dynamics codes but is poorly understood and often not used. Even in the UK, with more experience than most countries in understanding prevailing friction conditions, consistent peak friction measurements of 0.23 +/- about 0.05 standard deviation are co-opted by the use of a 0.45 value in many experiments because the larger value gives ”best agreement with test force measurements and observations”.
We report on a new instrument for field measurements of the traction creepage characteristic based on lateral creepage, and then show some early measurement values and compare them with those measured by a standard Salient hand pushed tribometer. Through dynamic modeling, the implications of the traction creepage relationship on forces, wear and vehicle stability are explored.
1 INTRODUCTION
Friction is the resistive force that arises between two bodies in relative motion. The basic understandings of DaVinci (1599), Amontons (1699) and Coulomb (1785) gave us the following:
• Friction is proportional to the normal force between surfaces.
• Friction is independent of the nominal area of contact.
• The kinetic friction is nearly independent of speed. Furthermore, it was generally understood that “kinetic friction” is generally less than “static” friction.
Since then, through the efforts of Green [1], Tabor [2] and Bowden and Tabor [3] we have come to understand that friction depends on the strength of the surfaces (or interface) in compression and shear. And by controlling the properties of the interfacial layer, we can control the friction characteristic [4].
The friction characteristic refers to the relationship between slip and tractive force. This was established by Kalker [5] for the case of clean surfaces in contact and then measured experimentally by many in small scale laboratory tests [e.g. 6]. A summary of some early measurements was compiled by Hobbs [7, Figure 1]. Since then friction has been measured on various wheelset rigs [8], including several at high speeds [9, 10], and through full scale test car [11] and locomotive tests [12].
Figure 1: Kalker's theoretical curve is affected significantly by the presence of interfacial contaminants [7].
Because of the difficulty and cost to undertake field tests of vehicle/track performance on operating railways, there is an increasing reliance on modeling using computer systems of ever increasing complexity and capability. But these and nearly all other such models have in common the use of Kalker’s model for the traction creepage relationships which applies to dry and clean surfaces only. The practical condition sees the actual wheel/rail contact separated by contaminant films, also known as the third-body layer [13]. The characteristics of these layers govern the shear properties of the contact, including friction, wear, traction/adhesion and stress. The traction-creepage characteristic in particular is highly dependent on the properties of the interface and has a huge impact on the vehicle-track interaction. Accordingly, the best possible models should be applied for both quantitative and phenomenological models.
2 LATERAL CREEPAGE ROLLING
CONTACT TRIBOMETER
Measurements of the traction coefficients on full scale systems are possible by monitoring slip and tractive effort on locomotives [12] and less directly with instrumented wheelsets [14]. At the intermediate scale are rail-bound “high speed” tribometers [15] specifically designed to evaluate friction over long lengths of track. On a smaller scale, there are a limited number of tools available. The field is dominated by the Salient Tribometer [16], which uses a wheel that is aligned along the rail length. An electronic brake progressively increases torque (i.e. the longitudinal creepage) until the wheel slips. The peak torque that immediately precedes gross slip is used along with the normal force on the wheel to calculate the friction coefficient. This tool presents only a display of the peak value of µ - there is no means in the field to capture the longitudinal creepage characteristic at the same time. The recent development of a tribometer that operates in the low creep regime to avoid the gross slip has been reported by Harrison [17]. Utilizing lateral creepage by varying the yaw angle of the wheel with respect to the rail, this tribometer has been used to capture the traction creepage curve against a laboratory dynamometer. Reference 16 reports on a high speed system where the measuring wheel sweeps out a small yaw angle range to generate lateral creepage for measuring friction levels. The unit is pushed in front of a hy-rail vehicle and simultaneously applies four measuring wheels – to the crown and gage-face of both rails. As another approach for measuring peak friction it is effective, but since the angular position is not controlled or measured, it is not yet suitable for field measurements of traction creepage curves.
A new rolling contact tribometer developed at NRC-CSTT is simply a field adaptation of an instrument developed by Kalousek in the 1980’s and reported in Reference 18. A schematic is shown in Figure 2. This device was originally designed for laboratory studies of Kalker’s relationships under mixed creepage (longitudinal, lateral and spin) conditions but was engineered and constructed to be sufficiently robust for use in the field on rail.
For the purpose of measuring the traction-creepage characteristic in the field, it is necessary only to exploit the fine yaw angle control of the system. At zero yaw angle the 197mm diameter measuring wheel rolls along the length of the rail. In the longitudinal direction the wheel rolls freely. Note that only the traction-creepage at the top of rail is to be measured since at the gauge face the creepage is surely saturated and a standard tribometer can be used to measure the peak friction. At the top of the rail the contact angle, compared with the plane of the rail, will be small. Although further improvements are pending, the real situation of a small
roll angle between the wheel and the contact plane is currently ignored. Since the lateral force arising due to gravity (the “gravitational stiffness”) will be offset somewhat by the spin creepage that arises, this error is not large.
Mounted into a rail bound carriage and pushed manually, the yaw angle of the measuring wheel is electronically controlled and the resulting lateral force measured. Plotting lateral force (divided by the normal load) against the yaw angle between measuring wheel and the longitudinal axis of the rail allows the traction creepage characteristic to be developed. The physical properties of the measuring system are listed in Table
1
.Figure 2: Schematic and photograph of the rolling contact tribometer. The measuring wheel carries the full vertical load of that side of the cart – the cart wheels on the tribometer side flange only and do not contact the top of the rail.
The yaw angle is varied from slightly greater than zero to a positive value to continuously draw the guiding wheels into flange contact, hence ensuring that the cart stays referenced parallel to the rail. The measuring wheel sits about 45mm from the gauge side of the rail.
Table 1: Physical characteristics of the rolling contact tribometer.
NRC Tribometer
Measuring wheel diameter 0.197 m (7.75”) Wheel transverse radius 0.0127 m ( 0.5”) Nominal Vertical load 1,779 N (400 lbf) Nominal normal stress 1.6 x 10⁹ Pa Typical contact ellipse a/b 4.0
Typical forward speed Walking speed Yaw angle range ± 3º
Lateral creepage range ± 5%
3 MEASUREMENTS
The first set of measurements was made on a very rusty rail roughly four metres in length. The yaw angle was varied linearly from zero up to 3 degrees (≈5% creepage). An initial dead weight load of 64.4 kg (632N) was measured on the wheel. The measured lateral force signal (Figure 3, middle) is quite noisy, in part due to the uneven contamination, rough and uneven rail surface, and the short length of track evaluated (the system has insufficient time to “settle down”). There may also be some stick-slip effects, as considered in reference 17. The DC lateral force offset pointed to difficulties with ensuring the cart was parallel to the rail for this first set of measurements, an issue that was subsequently corrected by ensuring that the measuring wheel draws the guide wheels into flange contact. The change in vertical force is a result of load being picked up by the wheel flanges of the guide wheels.
Dividing the lateral force by the measured vertical force in Figure 3 and converting yaw angle to percent creepage (100* sin[α]) results in the traction creepage curve of Figure 4. The “linear” portion of the Kalker curve is readily distinguished, as are the saturation creepage of about 2.5% and friction coefficient of about 0.575. The line marked Kalker is calculated for pure lateral creepage using the geometrical characteristics of Table 1 on a rail with a 250mm head radius, and friction coefficient of 0.575. The remaining lines represent a quasi-Kalker fit to the measured data. The difference between the theoretical (Kalker) line and the fit line is believed to be entirely due to the influence of the contaminant layer.
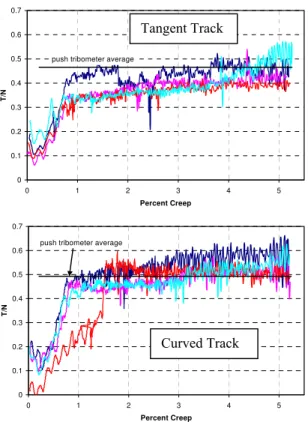
A second set of field measurements were made at a local railroad over about 300 m of tangent track and then another 100 metres through a roughly 800 metre radius curve. Top of rail friction on the north/high rail was measured. A typical sample of the resulting traction-creep curves are shown in Figure 5, with the top plots showing tangent examples and the bottom graph showing typical plots through the curve. A Salient tribometer was run over the same length of track – the average of those values is noted in the same graphs. Whereas the lateral tribometer suggests an increase in saturated friction from roughly 0.4 in tangent track to
0.5 in the curve, the Salient measurements show a much smaller difference. 0.0 0.5 1.0 1.5 2.0 2.5 3.0 3.5 yaw an gl e ( d e g rees ) -700 -600 -500 -400 -300 -200 -100 0 100 200 lat e ra l f o rce (N ) -250 -200 -150 -100 -50 0 50 20 25 30 35 time (sec) v e rti c a l fo rc e (N)
Figure 3: Field measurements on very busy, dry rail. Shown are the controlled yaw angle (top), measured lateral force (middle) and measured vertical force (bottom). Saturation appears to occur at a yaw angle of about 1.5 degrees (2.5% creep).
0.0 0.1 0.2 0.3 0.4 0.5 0.6 0.7 0.8 0.9 1.0 0 1 2 3 4 5 6 percent creep T/N Kalker
Figure 4: The traction/creepage curve for rusty, dry rail.
0 0.1 0.2 0.3 0.4 0.5 0.6 0.7 0 1 2 3 4 5 Percent Creep T/ N
push tribometer average
0 0.1 0.2 0.3 0.4 0.5 0.6 0.7 0 1 2 3 4 5 Percent Creep T/ N
push tribometer average
Figure 5: Field measurements on a low tonnage freight railway (vertical load equals 1,779N). The top plot shows the measured traction-creep characteristic for tangent track and lower plot shows the same for the adjacent curve.
These figures show that it is clearly not necessary to go to 5% creepage – a value of half that would be sufficient for measurement of even heavily contaminated rail (Figure 4). This is consistent with Harrison in Reference 16. Also, reducing the creepage range to half will reduce the current 16 second cycle time (and travel distance per cycle) proportionally, increasing the frequency of readings. Mechanical changes will probably be required to reduce that further to roughly four or five seconds.
4 IMPACT OF FRICTION
CHARAC-TERISTIC ON VEHICLE MODELING
That calculations of wheel/rail creep force should adjust the Kalker curves to account for the practical conditions experienced in the field was noted early by British Rail. Their approach was to scale the slope of the Kalker curve by 0.6 [19]. Many packages ignore this factor, with some simply using a non-adjustable 1.0 scale factor. In NUCARS, the default is also 100% but is user changeable via the \PERCENT_KALKER parameter. A short series of simulations was run in NUCARS to illustrate the impact of that parameter on modeling results. In the first set, a standard covered hopper car was run over the AAR Chapter XI dynamic curving WRM loop (in a clockwise direction). The \PERCENT_KALKER value was varied from 20% to
100% in 20% increments. The simulation results were compared with the measured values from physical testing on that track.
The vertical wheel unloading in Figure 6 is relatively independent of the friction characteristic, primarily because it is dominated by inertial effects and not friction, and because any creepage components in the vertical direction (e.g. at the wheel flange) are well into the saturated creepage regime where the linear sloped portion of the Kalker curve is no longer relevant. This is reinforced by the quasi-static curving plot of Figure 7 which shows the percent Kalker having virtually no effect on wheel unloading.
0 10 20 30 40 50 60 70 80 15 20 25 30 35 40 45 50 55 Speed (km/h) M ini m un Ver ti cal U n lo adi ng ( % ) Percent Kalker = 20 Percent Kalker = 40 Percent Kalker = 60 Percent Kalker = 80 Percent Kalker = 100 Dynamic Curving Test Results
Figure 6: Wheel unloading calculated for a hopper car, AAR Chapter XI simulation (µ=0.5).
0 20 40 60 80 100 120 15 20 25 30 35 40 45 50 55 Speed (km/h) M inim un V e rt ic a l U n loa d ing ( % ) Percent Kalker = 20 Percent Kalker = 40 Percent Kalker = 60 Percent Kalker = 80 Percent Kalker = 100
Figure 7: Wheel unloading calculated for a hopper car, 173m radius (10 degree curve), quasi-static curving (µ=0.5).
Calculation of the maximum wheel L/V under dynamic curving shows much greater sensitivity to the Kalker slope where creepages may or may not be saturated (Figure 8). The strong sensitivity at 19 km/hr was examined in more detail. It was found that although the lateral forces progressively decline with decreasing \PERCENT_KALKER values, and the cyclic vertical wheel loads do not vary much in amplitude, that the maximum L/V is governed by the dynamic response of the vehicle to the Chapter X1 perturbed track and not due to the shear forces that arise from creepage and friction.
Tangent Track
0.0 0.2 0.4 0.6 0.8 1.0 1.2 1.4 1.6 1.8 15 20 25 30 35 40 45 50 55 Speed (km/h) M axi m u m W h eel L /V Percent Kalker = 20 Percent Kalker = 30 Percent Kalker = 40 Percent Kalker = 60 Percent Kalker = 80 Percent Kalker = 100 Dynamic Curving Test Results
Figure 8: Maximum wheel L/V calculated for a hopper car, AAR Chapter XI simulation (µ=0.5).
In contrast, under quasistatic curving the maximum L/V for different \PERCENT_KALKER values (Figure 9) illustrates a more intuitively satisfying picture. The lateral force in curving is affected significantly by the slope of the Kalker curve, until the point at which saturation is reached. The strong change in response between 60% and 40% suggests that the wheelset is running at saturated creepage for the former and unsaturated for the latter. This was confirmed by examining the wheelset angles of attack.
0.0 0.1 0.2 0.3 0.4 0.5 0.6 15 20 25 30 35 40 45 50 Speed (km/h) M axi m u m W h eel L /V Percent Kalker = 20 Percent Kalker = 40 Percent Kalker = 60 Percent Kalker = 80 Percent Kalker = 100
Figure 9: L/V under quasi-static curving.
Lastly, we show in Figure 10 the results of a hunting simulation for a passenger car, running up to 200 km/h (125 mph). The carbody lateral accelerations decline significantly for lower values of \PERCENT_KALKER.
0.00 0.02 0.04 0.06 0.08 60 80 100 120 140 160 180 200 Speed (km/h) S T DV o f Ca r Bo d y L e a d L a tl Ac c . ( g 's ) Percent Kalker = 20 Percent Kalker = 40 Percent Kalker = 60 Percent Kalker = 80 Percent Kalker = 100
Figure 10: Maximum lateral car body accelerations for a passenger car (µ=0.5).
Since the calculated lateral forces prior to saturated creep are directly related to the slope of the creep-force
curve, any wheel/rail interactions that occur in unsaturated creep will be affected by that slope. It was noted by Pearce and Rose [19] that “the initial slope at low creepage is of fundamental importance in the linear stability analysis” (i.e. hunting) but it should in fact play a significant role in any phenomena dominated by creepage below the saturation level, including curving through small radius curves. Accordingly, great care should be taken especially in modeling wheel/rail systems where these conditions occur. Wheel climb and lateral force derailments on the other hand are governed by the absolute friction levels obtained in saturated creep and the simple friction limit should be sufficient. An example of the impact on fatigue is illustrated in Figure 11. Pummelling plots [21] show the accumulated “surface damage” calculated for a passenger car running through 500m of tangent and an 873m radius (2 degree) curve that is 425m long. Measured track geometry and several different rail shapes are used in the simulation. The limiting friction is 0.5. The RCF damage model of Burstow [22] is applied based on the calculated Tγ values. The reduction in predicted RCF is large for lower values of \PERCENT_KALKER.
Inside (low) wheel Outside (high) wheel
Figure 11: Pummel plots of the relative surface damage for the inside (left column) and outside (right column) wheels for the lead axle of a passenger coach car running through 925m of track that includes an 875m radius curve. The \PERCENT_KALKER values from top row to bottom row are 100, 60 and 40.
5 CONCLUSIONS
It is well understood that the friction coefficient plays a strong role in many aspects of the vehicle interaction, so it is good practice to collect tribometer measurements in the field for use in an analytical effort. Multibody dynamics models in particular are seeing increasing application to a range of wheel/rail studies including
investigations of hunting, forces, corrugation, wear and fatigue. Most of these models depend on Kalker’s relationships to calculate the wheel/rail forces but in doing so fail to consider the effect of interfacial layers on the linear portion of the creep characteristic. A new tribometer has been developed that by controlling the yaw angle and measuring lateral force is able to capture the traction creepage curve in the field. Under practical conditions the saturation creepage increases from the typical Kalker value of 0.6% to a value of 1-2%. This suggests that the Kalker coefficients should be scaled down by a value between 0.6 and 0.3.
Important impacts of saturation creepages on vehicle track interaction have been demonstrated through dynamic modelling by setting the \PERCENT KALKER option available in NUCARS. Values of 100, 80, 60, 40, and 20 were examined. While the \PERCENT_KALKER had little impact on “vertical” phenomena such as wheel unloading (Figure 7) it did impact the L/V in curving (Figures 7 and 8) and dynamic lateral accelerations (Figures 9 and 10). Furthermore, delaying creep saturation through lower \PERCENT_KALKER values decreases calculated wear and RCF damage (Figure 11).
The early British rail work suggested the use of a 0.6 multiplier [19] but subsequent work suggested Kalker’s relationships hold without modification in many practical cases. Full scale locomotive tests [12] provide data that suggests considerably reducing that factor, to 0.2 or even lower. Initial measurements using the field tribometer introduced in this paper currently support a multiplier in the range of 0.6, but these are only preliminary measurements and some bugs in the system are still being worked through. Work continues not only on the tribometer itself but also to better understand possible speed and scaling effects associated with the relatively small and lightly loaded contact patch of this tribometer in comparison with the full scale wheel/rail contact.
6 ACKNOWLEDGEMENTS
The authors wish to gratefully acknowledge the US Federal Railroad Administration for sponsoring the tribometer adaptation project and for its ongoing support of several activities to measure and understand the wheel rail interaction on passenger and freight railroad systems.
The technical and engineering support of NRC-CSTT engineers Albert Wahba and Wei Huang, is also sincerely appreciated,
7 REFERENCES
1. A.P. Green: Friction between unlubricated metals:
a theoretical analysis of the junction model, Proceedings of the Royal Society of London, 1955, vol. 228.
2. D. Tabor: Junction growth in metallic friction: the
role of combined stresses and surface contamination, Proceedings of the Royal Society of London, 1959, Series A, Mathematical and Physical Sciences, vol. 251.
3. F.P. Bowden and D.Tabor, The friction and
lubrication of solids, Pt. II, Oxford University Press, 1964.
4. J. Kalousek, K. Hou, E. Magel and K. Chiddick (1996), The benefits of friction management - a
third body approach, World Conference on Railway Research, Colorado, June, pp.461-467. 5. J.J. Kalker, On the rolling contact of two elastic
bodies in the presence of dry friction, 1967, Doctoral Dissertation, Technical University Delft,. 6. K. Hou, J. Kalousek and E. Magel: Rheological
model of solid layer in rolling contact, 1997, Wear, vol. 211, pp. 134-140.
7. Hobbs, A.E.W., A survey of creep. British Rail Dpt. DYN 52, Derby 1967.
8. A. Matsumoto et al: Creep force characteristics
between rail and wheel on scaled model, 2002, Wear, vol. 253.
9. T. Ohyama, Adhesion Characteristics of wheel/rail
system and its control at high speeds, 4th RTRI Symposium, Tokyo, 07 November 1991.
10. W. Zhang et al: Wheel/rail adhesion and analysis
by using full scale roller rig, 2002, Wear, vol. 253, pp. 82-88.
11. D.J. Watkins: Exploring adhesion with British
Rail’s tribometer train, 1975, Railway Engineering Journal, vol. 4, no. 4.
12. C.F. Logston and G.S. Itami: Locomotive
Friction-Creep Studies, 1980, ASME Journal of Engineering for Industry, vol. 102, pp. 275-281.
13. M. Godet, Third-body approach: A mechanical
view of wear, Wear, vol. 100, pp. 437-452.
14. E. Magel et al, Traction, forces, wheel climb and
damage in high speed railway operations, 2008, Wear, vol. 265, pp. 1446-1451.
15. R. Sims, K. Miller and G. Schepmann, Rail
lubrication measurement, Proceedings of the 1996 ASME/IEEE Joint Railroad Conference, Oakbrook, Il, USA, May 1996.
16. H. Harrison, T. McCanney and J. Cotter: Recent
developments in coefficient of friction measurements at the wheel/rail interface, 2002, Wear, vol. 253, pp. 114-123.
17. H. Harrison: The development of a low creep
regime, hand operated tribometer, 2008, Wear, vol. 265, pp 1526-1531.
18. J. Kalousek, Establishment of a quantitative wear
and fatigue model for railway rail subjected to heavy traffic conditions and different lubrication regimes, NRC Technical report TR-WE-2, 1984. 19. T.G. Pearce and K.A. Rose, “Tangential force –
creepage relationships in theory and practice”,
Contact Mechanics and Wear of Rail/Wheel Systems, Vancouver, Canada, 1982.
20. O. Polach: Creep forces in simulations of traction
vehicles running on adhesion limit, 2005, Wear, vol. 258, pp 992-1000.
21. E. Magel and J. Kalousek, The influence of
creep forces on surface fatigue of wheels, 14th International Wheelset Congress, Orlando, Florida, October 2004.
22. M. C. Burstow, Whole life rail model
application and development for RSSB, continued development of an RCF damage
parameter, Report #AEATR-ES-2004-880
![Figure 1: Kalker's theoretical curve is affected significantly by the presence of interfacial contaminants [7]](https://thumb-eu.123doks.com/thumbv2/123doknet/14159853.473096/2.918.483.786.561.740/figure-kalker-theoretical-affected-significantly-presence-interfacial-contaminants.webp)