Publisher’s version / Version de l'éditeur:
International Journal of Powder Metallurgy, 44, 6, pp. 49-59, 2008
READ THESE TERMS AND CONDITIONS CAREFULLY BEFORE USING THIS WEBSITE. https://nrc-publications.canada.ca/eng/copyright
Vous avez des questions? Nous pouvons vous aider. Pour communiquer directement avec un auteur, consultez la première page de la revue dans laquelle son article a été publié afin de trouver ses coordonnées. Si vous n’arrivez pas à les repérer, communiquez avec nous à PublicationsArchive-ArchivesPublications@nrc-cnrc.gc.ca.
Questions? Contact the NRC Publications Archive team at
PublicationsArchive-ArchivesPublications@nrc-cnrc.gc.ca. If you wish to email the authors directly, please see the first page of the publication for their contact information.
This publication could be one of several versions: author’s original, accepted manuscript or the publisher’s version. / La version de cette publication peut être l’une des suivantes : la version prépublication de l’auteur, la version acceptée du manuscrit ou la version de l’éditeur.
Access and use of this website and the material on it are subject to the Terms and Conditions set forth at
Transient Liquid-Phase Sintering of Copper-Nickel Powders: In Situ
Neutron Diffraction
Turriff, Dennis M.; Corbin, Stephen F.; Cranswick, Lachlan M.D.; Watson,
Michael J.
https://publications-cnrc.canada.ca/fra/droits
L’accès à ce site Web et l’utilisation de son contenu sont assujettis aux conditions présentées dans le site LISEZ CES CONDITIONS ATTENTIVEMENT AVANT D’UTILISER CE SITE WEB.
NRC Publications Record / Notice d'Archives des publications de CNRC:
https://nrc-publications.canada.ca/eng/view/object/?id=7f48b957-a62b-47b3-9a5e-fe47a3c36a7c https://publications-cnrc.canada.ca/fra/voir/objet/?id=7f48b957-a62b-47b3-9a5e-fe47a3c36a7cINTRODUCTION
Transient liquid-phase sintering (TLPS) is a unique powder metallur-gy (PM) processing technique typically used to form near-net-shape parts1and more recently, as in this study, as a means of developing liquid-rich low-temperature solders2,3and brazing filler materials4that exhibit variable melting point (VMP) characteristics. In TLPS, starting mixtures normally consist of a low-melting-point additive powder and a higher-melting-point base-metal powder. The transient liquid phase that forms during heat-up past the additive’s melting point aids in rapid densification of the mixture.1,5–8This liquid alloys with the base-metal powder during sintering and can lead to complete isothermal, or diffusional, solidification and a shift in melting point for the bulk pow-der mixture.4
In order to achieve the maximum melting-point shift for VMP braz-ing applications the isothermally solidified phase should have a com-pletely homogenized composition. The consequence of diffusional solidification and incomplete homogenization was previously studied4 via differential scanning calorimetry (DSC). DSC results for nickel and copper powder mixtures (65 w/o Cu) showed quantitatively that a hold time of 150 min at 1,140°C enabled complete isothermal solidification of the copper-rich liquid during TLPS. Upon reheating, the TLP-sin-tered specimens exhibited a measurable melting-point increase, and an enhanced melting range due to incomplete homogenization of the isothermally solidified microstructure. Metallographic characterization of the post-sintered DSC specimens revealed that significant composi-tional gradients remained between the nickel-rich particle cores and the surrounding copper-rich solid-solution regions, even after holding for 150 min at 1,140°C.4
The initial melting behavior and solidification kinetics during transient liquid-phase sintering (TLPS) of elemental copper–nickel powder mixtures have been investigated via in situ neutron diffraction (ND). By conducting ND experiments at various isothermal sintering temperatures and durations above the copper melting point, partial liquation of the powder mixtures was induced. By tracking the post-melt evolution of the (200) diffraction peak profiles during prolonged sintering cycles, insight has been obtained regarding interdif-fusion of copper and nickel within the unmelted nickel powder, which is responsi-ble for the diffusional, or isothermal, solidification of the surrounding liquid phase. It is concluded that the transient liquid is removed primarily by the rapid growth of a copper-rich solid solution having a composition given by the phase diagram solidus.
T RAN SI EN T LI QU I
D-PH ASE SI N T ERI N G OF
COPPER–N I CK EL
POWDERS: I N SI T U
N EU T RON DI FFRACT I ON
Dennis M. Turriff,* Stephen F. Corbin,** Lachlan M.D. Cranswick,***
and Michael J. Watson****
*Instructor/Research Associate, **Professor and Associate Chair of Research, Materials Processing and Engineering Group, Department of Mechanical & Mechatronics Engineering, University of Waterloo, 200 University Avenue W, Bldg. E2-4404, Waterloo, Ontario, Canada, N2L 3G1; E-mail: dmturrif@uwaterloo.ca, ***Research Scientist, ****Research Scientist, Retired, Canadian Neutron Beam Centre, National Research Council Canada, Bldg. 459, Chalk River Laboratories, Chalk River Ontario, Canada, K0J 1J0
From this discussion, it is clear that interdiffu-sion between the copper and nickel phases during the isothermal solidification and homogenization stages of TLPS is important in determining the rate of liquid removal at 1,140°C, as well as the extent of melting-point shift. Therefore, the pri-mary objective of this investigation was to develop an experimental method using neutron diffraction (ND) to measure in situ the extent of interdiffu-sion taking place during TLPS of copper–nickel powders. Rudman and Fischer9 and Delhez et al.10have shown that X-ray diffraction techniques (XRD) can be used to investigate the increasing degree of interdiffusion of copper–nickel during solid-state sintering. This was done by tracking the evolution of the (220) diffraction profiles for copper and nickel after isothermal sintering of copper and nickel powder mixtures below 1,085°C. The gradual formation of alloyed regions within the compacts due to sintering and interdif-fusion gave rise to XRD peak broadening and the generation of a wide diffraction signal at all inter-mediate 2θ angles, since nickel and copper consti-tute an isomorphous alloy system.
It should be noted that the studies cited focused on solid-state sintering and XRD measurements were done after the sintering treatment (i.e., ex situ). The authors are not aware of any in situ studies on sintering of powder mixtures in the presence of a transient liquid, which inherently complicates the process. The large penetration depth and large representative-sample volumes (grams) offered by monochromatic neutron beams makes them an ideal probe for such investigations. MATERIALS AND METHODS
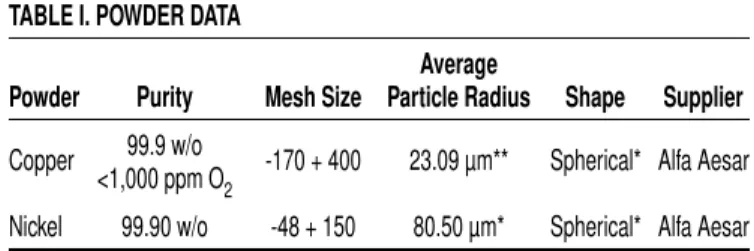
Table I lists the copper and nickel powders used and their relevant characteristics. The cop-per powder represents the low-melting-point addi-tive phase (Tm = 1,085°C) and source of liquid during sintering, whereas the nickel powder rep-resents the high-melting-point base-metal phase
(Tm= 1,455°C). Specimens were prepared by mix-ing the loose elemental powders such that the bulk mixture composition, (CO) was 65 w/o Cu. The specimens were placed in large cylindrical Al2O3 crucibles (6 mm dia. × 42 mm tall), which could accommodate large sample sizes in order to provide sufficiently strong diffraction signals.
Neutron diffraction experiments were conduct-ed in the C2 powder diffractometer locatconduct-ed at the National Research Universal (NRU) research reac-tor at the Chalk River Laborareac-tory, Chalk River, Canada.11,12The crucibles were placed into cylin-drical vanadium containment canisters, which were centered/aligned in the body of the vacuum furnace and the diffractometer. A planar silicon single crystal monochromator was used via the 531 reflection and 92.7° takeoff angle to generate a monochromatic incident beam having a wave-length of 0.133069 (7) nm. Calibration and align-ment of the instrualign-ment were performed prior to experimentation via Rietveld analysis using the General Structure Analysis System (GSAS) code on an external powder standard at room tempera-ture (Si 640c; National Insitute of Standards & Technology (NIST)).
Diffraction patterns spanning 20°–100° in 2θ (with a 0.1° step size) were collected during 1 min time sequences/steps (or data sets) during the sintering cycles. These data sets could be summed over sequential 5 min periods to improve signal quality at the expense of time resolution. Multiple experiments were conducted at different heating rates (10°C–40°C/min), processing tem-peratures TP (1,080°C–1,200°C) and isothermal hold durations in a 99.998 v/o dynamic nitrogen atmosphere (Table II).
Sample no. 1 consisted of a preliminary experi-ment performed on a pure copper powder sample. Sample no. 2 consisted of a preliminary experi-ment in which an alumina powder barrier layer was used to divide two separate copper and nickel powder layers within the crucible, thus preventing any copper–nickel interactions. Slow heating rates were used to allow complete temperature equili-bration of the sample and to initially characterize the evolving, interaction-free nickel and copper peaks within the ND patterns using GSAS.
Sample temperatures were measured using redundant thermocouples. These measurements were verified by tracking the Al2O3peak positions, which inevitably contributed to the diffraction sig-nal, but without overlap or interaction issues with
TABLE I. POWDER DATA
Average
Powder Purity Mesh Size Particle Radius Shape Supplier
99.9 w/o Copper
<1,000 ppm O2 -170 + 400 23.09 µm** Spherical* Alfa Aesar Nickel 99.90 w/o -48 + 150 80.50 µm* Spherical* Alfa Aesar Verified via optical microscopy*, SEM* and a Horiba CAPA–700 particle size analyzer**
the (200) face-centered cubic (FCC) copper/nickel peaks. The resulting shifts of the Al2O3reflections due to thermal expansion of the inert alumina crucible thus served as a an internal temperature reference.13 It should be noted that the tempera-ture variation from the top to the bottom of the crucible was 50°C.14 The temperature quoted throughout this paper is that determined from the ND signal collected from the entire Al2O3crucible and therefore represents the average temperature of the specimen. Following the ND experiments, samples were prepared using standard metallo-graphic techniques.
RESULTS AND DISCUSSION
Following a presentation of preliminary experi-ments on the pure copper and non-interacting copper–nickel samples, the ND results will be pre-sented according to the metallurgical stages of TLPS, namely, (1) solid-state sintering during heat-up, (2) melting/dissolution, (3) diffusional or isothermal solidification, and (4) homogenization. A description of the important TLPS stages in liq-uid-rich systems is described elsewhere.1,4,15
Preliminary Experiments
Figure 1 illustrates a series of ND patterns, or data sets, acquired/summed over 5 min time intervals for pure copper powder heated to 1,112°C and then cooled. After a series of
pat-terns was collected at room temperature, all the peaks shifted to lower diffraction angles due to the thermal expansion of the copper and Al2O3as temperature increased. Once a temperature above 1,085°C is reached, the complete disappearance of the copper (200) diffraction peak (and the entire copper diffraction pattern not shown in Figure 1) confirms that the copper phase has undergone melting. As such, the in situ ND technique is effective in detecting the copper melting event.
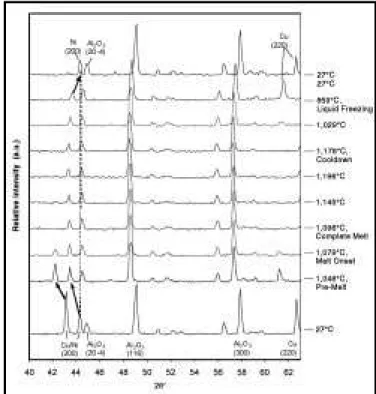
Figure 2 illustrates ND patterns for the noninter-acting copper–nickel specimen (no. 2) at selected temperatures below and above the melting point of pure copper. As in Figure 1, both the copper (200) and nickel (200) diffraction peaks shift to lower angles due to thermal expansion until the copper (200) peak disappears above the melting point of copper. Upon cooling from the high-temperature segments, the liquid copper appeared to have solid-ified directionally. This is evidenced by the reap-pearance of larger copper (220) peaks, generating a significant degree of solidification texture only in this experiment employing the Al2O3powder barri-er. The nickel (200) peak is clearly stable over the entire temperature range up to 1,178°C. In
addi-Figure 1. Three-dimensional plot of diffraction pattern evolution at 5 min intervals
for pure copper powder heated to 1,112°C and then cooled (sample 1)
Figure 2. 5 min ND patterns collected in situ for a Ni-65 w/o Cu non-interacting
mixture (sample 2). The nickel and copper powders were separated by an alumina barrier. The mixture was slowly heated to 1,096°C, isothermally held at 1,145°C, and 1,196°C, and cooled to 27°C
tion, upon cooling back to room temperature, the nickel (200) peak returns to its original 2θ position, as indicated by the dashed vertical line. This con-firms that the alumina barrier was effective in pre-venting interdiffusion between the copper and nickel and that the heating and cooling of the nick-el powder does not alter its 2θ diffraction line posi-tions, other than reversible shifting due to thermal expansion. As will be shown subsequently, interac-tion between the nickel and copper powders during TLPS creates an evolving copper/nickel (200) dif-fraction profile that is significantly different from the behavior exhibited in Figure 2.
Solid-State Sintering and Interdiffusion Prior to Melting
Before an analysis of ND patterns from inter-acting powders is presented, it is important to note that the lattice parameter of copper–nickel solid solutions at a given temperature (aalloy) varies linearly from aCuto aNi (the elemental lat-tice parameters);16it is given by:
aalloy= aCuCalloy+ aNi(1–Calloy) (1) where Calloyis the fractional copper concentration in the alloy. For cubic systems such as FCC nick-el and copper, the peak positions q of a given hkl reflection are given by:
λ2
a2= ———— (h2+ k2+ l2) (2) 4sin2θ
Substitution of equation (2) in (1) yields:
Calloy 1–Calloy sinθalloy=
(
———— + ————)
-1
(3) sinθCu sinθNi
In equation (3), θCu and θNi are the diffraction angles of the pure copper and pure nickel hkl reflections respectively. θalloy is the diffraction angle of the same hkl reflection corresponding to a given homogeneous alloy composition. Conse-quently, the 2θ axis in diffraction patterns for iso-morphous copper–nickel alloys is analogous to composition (i.e., decreasing copper concentration from the copper peak position to the nickel peak position).9 Equation (3) can be used to estimate the expected (200) reflection position for a 65 w/o copper specimen (i.e., CO).
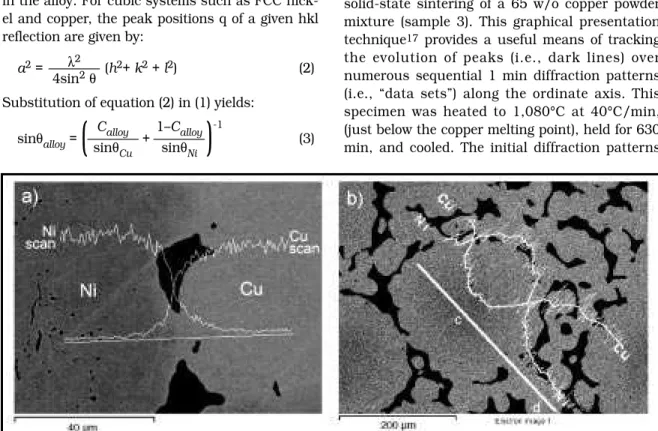
Figure 3(a) shows an isolated nickel–copper contact from a 65 w/o copper mixture after solid-state sintering during heat up to 1,075°C and immediate cooling. The energy dispersive spec-troscopy (EDS) line scans for copper and nickel clearly indicate that interdiffusion between pure copper and nickel particles has occurred in the neck regions. This typical interdiffusion profile illustrates the isomorphous nature of the cop-per–nickel binary system, where solid solutions of any intermediate composition can form.
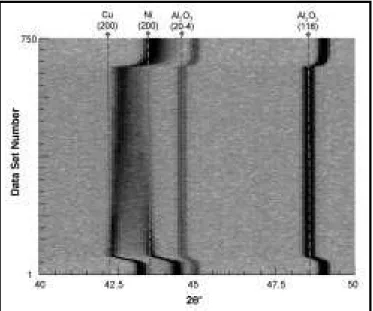
Figure 4 is a “film plot” showing the evolution of diffraction patterns over time during prolonged solid-state sintering of a 65 w/o copper powder mixture (sample 3). This graphical presentation technique17 provides a useful means of tracking the evolution of peaks (i.e., dark lines) over numerous sequential 1 min diffraction patterns (i.e., “data sets”) along the ordinate axis. This specimen was heated to 1,080°C at 40°C/min, (just below the copper melting point), held for 630 min, and cooled. The initial diffraction patterns
Figure 3. Backscattered electron images (BSE) and EDS line scans showing copper–nickel interdiffusion profiles between contacting
collected at room temperature show stable copper and nickel (200) peaks at 42.24° and 44.42°, respectively, as well as Al2O3 peaks ((20-4) at 44.99° and (116) at 49.11°).
During heat-up, all peaks shift to lower angles due to thermal expansion of the respective lat-tices. Vertical dashed lines have been included to mark the positions of key high-temperature peaks. Once the isothermal processing tempera-ture is reached (TP= 1,080°C), the alumina peaks cease to shift. However, as the sample is held at this temperature, ongoing copper–nickel interdif-fusion causes noticeable asymmetric broadening effects in both the copper and nickel peaks. The developing alloy regions within the sample cause inward broadening of the initial elemental copper and nickel diffraction peaks, as well as increasing diffraction intensities at intermediate angles between them over time. Upon cooling after the isothermal hold, a broad diffraction profile still exists at room temperature. However, it is clear that the most intense portion of this profile has a diffraction angle between that of the original pure copper and pure nickel peaks. As the micrograph in Figure 3(b) indicates, this broad peak is attrib-uted to the significant compositional gradients that still remain between the nickel particle core (point c) and the sintered copper particles (point d) at the end of this experiment.
Figure 5 shows time–temperature resolved pat-terns acquired over 5 min sequences (summa-tions of five 1 min data sets) at discrete points during the sintering cycle to more clearly show the evolution of two dimensional patterns. The pre-sintered and post-sintered patterns (bottom) show that solid-state interdiffusion for over 600 min has generated a broad alloy peak indicative of a partially homogenized sample, Figure 1. The centroid of the alloy peak is in agreement with that expected for the copper-rich bulk composi-tion of the sample (dashed line at CO = 65 w/o copper). While the centroid of the post-sintered peak corresponds closely to the lattice parameter for a 65 w/o copper mixture, it is clear that a sig-nificant “tail” in the peak exists toward higher 2θ angles, indicating that some nickel-rich regions are still present in the sample after 600 min at temperature.
Close examination of Figure 5 reveals that even after 120 min at 1,080°C, there exists near-pure copper and nickel regions in the sample. Note that the furnace temperature rose slightly after this 2 h hold but enough interdiffusion occurred prior to this point such that liquid should not have formed up to 1,096°C (i.e., the sample still constitutes a solid-state-sintered case). At this
Figure 4. Film plot of in situ diffraction pattern evolution collected at 1 min
intervals during solid-state sintering of a Ni-65 w/o Cu powder mixture heated to 1,080°C for 630 min (sample 3)
Figure 5. 5 min ND patterns collected in situ during the isothermal segment of a
solid-state-sintered Ni-65 w/o Cu powder mixture at 1,080°C (sample 3). Bottom plot directly compares presintered and postsintered diffraction patterns at room temperature
slightly higher temperature, and for times ranging from 180 to 600 min, the maximum peak intensi-ty begins to shift away from the pure-copper posi-tion and the distinct peak at the pure nickel 2θ position disappears. This is consistent with the EDS line scan of Figure 3(b) which shows a meas-urable copper concentration at the core of the nickel particle.
Figure 6 shows diffraction patterns collected immediately prior to melting for specimens heated below 1,085°C at different heating rates (10°C and 40°C/min). In comparison, a diffraction pattern for sample 2 is included, which contained an alu-mina powder barrier preventing any copper and nickel interdiffusion from taking place. Sample 5, which was slowly heated at 10°C/min, appears to
have higher diffraction intensities at intermediate angles between the pure copper and pure nickel peak positions, which would indicate a higher degree of interdiffusion and alloying. However, the difference between the 10°C and 40°C/min data is minor. This can be attributed to the limited sensi-tivity of this technique, and to the low degree of interdiffusion that has occurred during these short heating regimes.
Melting and Dissolution
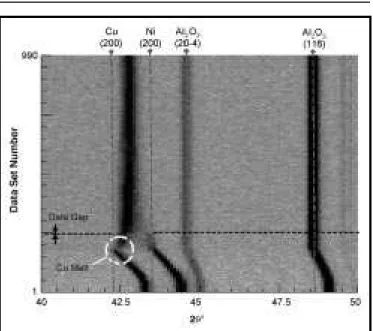
Figure 7 shows the evolution of diffraction pat-terns during TLP sintering of sample 5. This spec-imen was heated to 1,128°C at 40°C/min to form a copper-rich liquid phase, held for 900 min, and cooled. This plot illustrates different sintering and interdiffusion behavior in contrast to the solid-state-sintered specimen, Figure 4. In this case, a clear melting event is observed by the removal of copper peaks, evidenced by a break in the copper (200) curve at 1,085°C (circled). The nickel peaks persist since a portion of the mixture remains solid/crystalline at the sintering temperature (i.e., the nickel particles). Immediately after melting, a slightly shifted (higher 2θ) copper-rich diffraction peak appears to grow in intensity as the pure-nickel intensity decreases over time. Concur-rently, diffraction intensities gradually increase at intermediate 2θ angles due to interdiffusion, or solute uptake, by the solid-nickel particles.
Due to reactor flux variations, 63 min of data could not be collected during the isothermal seg-ment as well as the cool-down segseg-ment. Nonetheless, the interdiffusion process (i.e., solute uptake by solid-nickel particles) appears to be much more rapid during liquid-phase sintering vs. the solid-state sintering. This is clear when comparing the film plots of specimens 2 and 5 (Figures 4 and 7). The presence of the liquid phase during sintering at 1,128°C generates a much more uniform distribution of solute over the wetted nickel particles, which will accelerate the solute-uptake process.
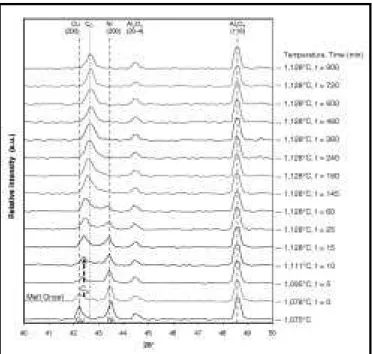
In order to further analyze ND pattern evolution during TLPS, it is necessary to examine time–tem-perature resolved data for sample 5, Figure 8. At 1,075°C, distinct copper and nickel peaks are present during what is referred to as the “premelt” condition during heat-up. At the average sample temperature of 1,078°C, the onset of copper melt-ing is first detected and this is designated as the start of the liquid-phase regime (post-melt time = 0
Figure 6. Comparison of peak profiles for diffraction patterns collected
immediately prior to melting in samples heated at different heating rates
Figure 7. Film plot of in situ diffraction pattern evolution collected at 1 min
intervals during TLP sintering of a Ni-65 w/o Cu powder mixture heated to 1,128°C for 900 min (sample 5)
min). At this point, copper regions at the top of the crucible (the hottest furnace region) have begun to melt and this causes an abrupt decrease in the pure-copper peak intensity. It should be noted that the copper peak in the pattern at t = 0 exhibits a clear shoulder at intermediate angles. This diffrac-tion signal originates from sintered neck alloy regions of the specimen having copper-rich compo-sitions less than or equal to the phase diagram solidus composition. Therefore, they will not melt at 1,085°C since they constitute stable solid solu-tions. In the 1,095°C, t = 5 min pattern, only this shifted residual shoulder peak remains, which will be referred to as the solidus peak (or CS).
Isothermal Solidification
After the melting event in Figure 8, the
copper-rich CS (200) peak appears to grow rapidly in intensity while the pure-nickel peak intensity decreases slowly (time segments 5 min through 60 min). This indicates that a copper-rich solid solu-tion is rapidly forming within the two-phase liq-uid–solid specimen during the isother mal segment. This supports nonisothermal DSC and metallographic results, where rapid liquid removal rates at short times via isothermal solidification would leave behind a copper-rich layer (composi-tion near CS) that surrounds the still solute-defi-cient nickel particles.4As the heavy dashed line in Figure 8 indicates, the 2θ peak location for the maximum intensity of the copper -rich peak remains fixed at the CS location up to the 60 min diffraction pattern. This is due to the continued presence of liquid phase which dictates, through interface equilibrium considerations, that the solid adjacent to the liquid–solid interface remain at CS. Once all the liquid has isothermally solidified, this restriction on the interfacial solid composition is removed. Beginning with the 145 min diffraction pattern, the 2θ peak location for the maximum intensity of the copper peak begins to shift to high-er 2θ until it reaches a position that corresponds to the bulk composition of the mixture, CO. This indicates that complete isothermal solidification occurred near 145 min, which is consistent with a previous analysis using DSC.4Over the same time frame, solute diffusion deeper into the nickel parti-cles eventually causes the nickel peaks to be com-pletely removed after 145 min. After 900 min at 1,128°C, a sharp single peak is formed, indicating that a homogeneous composition has been estab-lished, which is in good agreement with the bulk mixture composition (CO= 65 w/o copper).
As Table II indicates, multiple TLPS experiments were conducted at different isothermal processing temperatures to investigate the effects on liquid formation, dissolution, and the general ND profile
Figure 8. ND patterns collected at 5 min intervals during the isothermal
solidifica-tion stage of a Ni-65 w/o Cu powder mixture sintered at 1,128°C (sample 5)
TABLE II. NEUTRON DIFFRACTION EXPERIMENTS
Sample Powder CO Atmosphere Rh TP Hold Time at
No. Mass (g) (w/o Cu) (°C/min) (°C) TP(min) Experiment
1 2.522 100.0 N2 40 1,112 30 Pure-copper melt characterization
2 2.140 64.0 N2 N/A 1,096–1,196 60 Non-interacting, slow heating
3 2.515 65.2 N2 40 1,080 630 Solid-state sintering 4 2.523 65.0 N2 40 1,091 1,040 TLPS 5 2.529 65.3 N2 10 1,128 900 TLPS 6 2.495 65.0 N3 40 1,162 10 TLPS 7 2.502 65.0 N2 40 1,178 720 TLPS 8 2.490 64.8 N2 40 1,194 30 TLPS
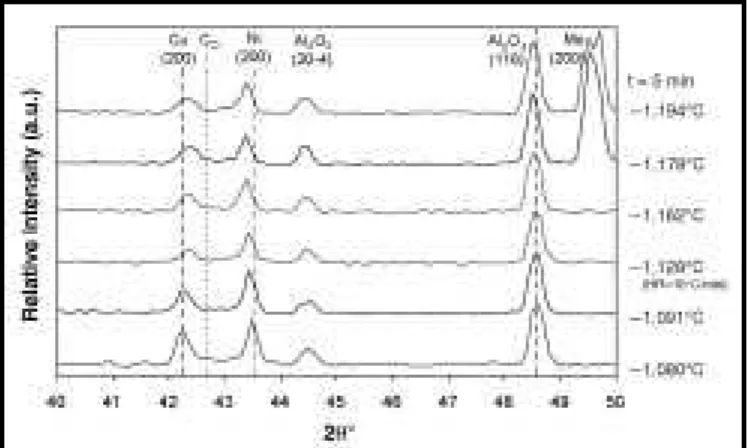
evolution behavior. Figure 9 shows diffraction pat-terns collected immediately after the onset of melt-ing (5 min) for six samples heated to different peak temperatures. A diffraction pattern for specimen 3 is also shown, which was solid-state sintered at 1,080°C and is included for relative comparisons with the other LPS specimens. Note: the diffraction patterns for the 1,194°C and 1,178°C specimens contain molybdenum (200) peaks originating from the molybdenum sample canisters used for these particular higher -temperature experiments. Vertical dashed lines have been included to identi-fy the pure-nickel and -copper peak positions at 1,085°C, where copper melting occurs and the pure-copper lattice becomes unstable. These lines are useful in interpreting small peak shifts during sintering at different temperatures.
In Figure 9, the nickel and Al2O3peaks shift to lower angles at higher temperatures due to ther-mal expansion. Conversely, the residual copper-rich CS peaks (post-melt) show a distinctively different trend since they are shifted to higher 2θ angles. This is due to superimposed composition-al shifting effects and the fact the pure copper is no longer stable at these temperatures. As the sintering temperature increases, the copper–nick-el phase-diagram solidus indicates that the solu-bility of copper in nickel (CS) decreases with increasing temperature (becoming more nickel rich). For the diffraction pattern at 1,091°C, the unmelted, residual interdiffusion regions can have very high copper contents close to pure cop-per. Accordingly, Figure 9 shows that the post-melt CS peak at 1,091°C is shifted minimally relative to the pure copper peak at 1,080°C. Higher temperatures show increased
composition-al shifting due to decreasing CS (or increasing nickel solubility). However, after only 5 min there are only minor differences in the patterns for each sample and a considerable fraction of the nickel-particle core remains unalloyed.
Figure 10 shows diffraction patterns collected 15 min after melting and temperature stabiliza-tion. At this point the residual CS peaks have already grown significantly. At higher tempera-tures, the CSpeaks are smaller (due to increased melt-back of solid-state alloyed regions) and the nickel peaks are also smaller due to nickel disso-lution. This is most clear when comparing the total diffraction profile areas with the fully solid 1,080°C case (areas above the horizontal dashed lines). This is indicative of the decreasing total vol-ume fraction of solid-solution material within the liquid–solid mixtures due to dissolution (increased liquid formation) at higher TP. It is also clear that there is a reduction of the intermediate alloy range ∆θ between the copper-rich and nickel peaks since
CS is becoming increasingly nickel-rich (shifted to higher 2θ angles) and smaller compositional gradi-ents are possible within the solid particles.
The isothermal solidification mechanism in TLPS can be more clearly elucidated by plotting the 2θ position of the rapidly growing copper-rich solid-solution peaks at the various processing temperatures. Figure 11 shows the nickel and (CS) peak positions measured at half maximum for all specimens shortly after the melting event. The shifting peak positions of each sample are plotted according to their respective peak processing tem-perature (TP) on the ordinate axis. It should be noted that at short times (0 to 10 min) many of the samples were still equilibrating to their peak
Figure 9. ND patterns collected 5 min after the melting event for Ni-65 w/o Cu
powder mixtures isothermally held at different process temperatures
Figure 10. ND patterns collected 15 min after the melting event for Ni-65 w/o Cu
isothermal processing temperature. The presenta-tion format in Figure 11 is somewhat similar to a film plot, but these data summarize the melting behavior of all specimens as they are heated to their respective TP from 1,080°C to 1,194°C. The peak positions at t = 5 min and 10 min have been connected for the different specimens to trace the peak positions at similar times when sintering at different TP. The nickel peaks after 5 min and 10 min shift to lower 2θ angles due to thermal sion at higher temperature. The degree of expan-sion is in agreement with calculations based on the known temperature-dependent expansion of the nickel lattice (dark dashed line in Figure 11).18
The copper-rich peaks at 5 min and 10 min are also plotted shortly after the melting event. At these times, the copper peaks show a distinctly different behavior relative to the nickel peaks. Rather than shifting to lower angles due to ther-mal expansion, the residual peaks shift to higher angles at increasing TP due to compositional effects. A theoretical curve for the expected expansion of pure copper (if it were stable) is also included. This theoretical curve is calculated by extrapolating copper-expansion data18 and illus-trates the divergent behavior of the copper peaks upon melting (thermal shifting vs. compositional shifting effects). As the typical film plot in Figure 7 shows, as well as Figure 9, all specimens exhib-ited this characteristic copper melting behavior above 1,085°C, namely, melting of unstable pure copper regions leaving behind copper-rich solid-solution regions responsible for the CS peaks, which grow rapidly immediately after melting.
Based on the known temperature-dependent thermal-expansion coefficients of the copper and nickel lattices,18 equation 3 can be used to esti-mate the composition of the solid-solution alloy regions responsible for generating the CS peaks. These data are plotted vs. sintering temperature and superimposed on the copper–nickel phase diagram in Figure 12.19 The in situ results show good agreement with the solidus line of the phase diagram. Discrepancies are likely due to tempera-ture gradients within the samples as they equili-brate to their respective TP. However, this datum affirms, in situ, that the isothermal solidification mechanism responsible for liquid removal during copper–nickel TLPS occurs via the epitaxial growth of a copper-rich solid solution (at CS) sur-rounding the solid base-metal particles, and limit-ed long-range diffusion into the nickel core.
Homogenization
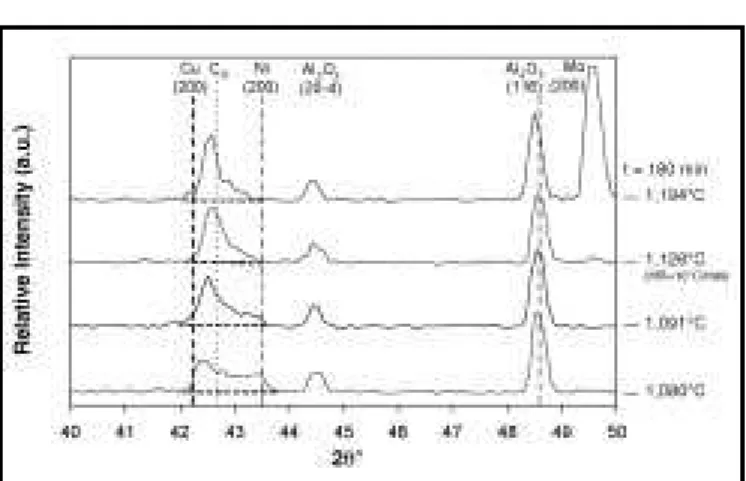
Figure 13 shows diffraction patterns for sam-ples that were held at different TP for a much
Figure 11. Cu, Ni, and CSpeak positions at t = 5 min (after melt onset) and 10 min for samples 3–8 (i.e., 1,080°C–1,094°C)
Figure 12. Calculated CSdiffraction peak compositions in comparison with the copper–nickel phase-diagram solidus line19
Figure 13. ND patterns collected 180 min after the melting event in Ni-65 w/o Cu
longer duration (180 min), where DSC results4 indicate that the liquid phase should be fully solidified. The solid-state-sintered specimen at 1,080°C still exhibits a bimodal ND profile, indi-cating a much less homogenous composition. In comparison, the profiles of the specimens TLP sintered above 1,085°C clearly show that the presence of a liquid phase has accelerated the evolution of a more refined single peak and there-fore a more homogeneous specimen composition. The liquid phase effectively increases the net rate of interdiffusion and solute uptake into and sur-rounding the nickel solid-solution particles.
However, Figure 13 indicates that, even after 180 min, the TLPS samples are not completely homogeneous since the peaks at each hold tem-perature are still somewhat broad and asymmet-ric. Also, the peak maxima positions are to the left (lower 2θ angles) of the expected positions for homogeneous alloys at CO. Compositional inho-mogeneity is also evidenced by the nickel-rich “tail” at the right of each diffraction profile, which decreases with increasing TP. This is consistent with DSC results4where samples held at 1,140°C for similar times (i.e., 150 min) still exhibited a broad melting event and therefore a broad compo-sitional range. Diffraction patterns collected at longer times (as in Figure 8) show that complete homogenization occurs with further sintering at each TP.
CONCLUSIONS
This study has shown that ND is capable of identifying the melting event during sintering of copper and nickel powder mixtures as well as the ongoing interdiffusion process taking place during TLPS at elevated temperatures. By monitoring the evolution of copper–nickel solid-solution diffrac-tion peak profiles in situ, this technique has shown that isothermal solidification of the liquid phase occurs primarily by the epitaxial growth of a copper-rich “layer” surrounding the nickel-rich base-metal particles. This is evidenced by the rapid growth of residual “CS” diffraction peaks immediately after the melting event, whose 2θ position is coincident with that predicted by the phase-diagram solidus. With increasing sintering times, homogenization of the powder mixtures eventually causes a sharp, single-peak profile to be generated. This characteristic profile evolution is significantly accelerated when a liquid phase is formed (i.e., TLPS vs. solid-state sintering).
ACKNOWLEDGMENTS
This work was supported by the Canadian Neutron Beam Centre (CNBC) and the National Sciences and Engineering Research Council of Canada (NSERC). The authors would also like to thank Erik Szakaly for contributions regarding metallographic work.
REFERENCES
1. R.M. German, Sintering Theory and Practice, 1996, Wiley-Interscience Publications, New York, NY.
2. S.F. Corbin and D.J. McIsaac, “Differential Scanning Calorimetry of the Stages of Transient Liquid Phase Sintering”, Mater. Sci. Eng. A, 2003, vol. A346, no. 1–2, pp. 132–140.
3. S.F. Corbin and P. Lucier, “Thermal Analysis of Isothermal Solidification Kinetics During Transient Liquid-Phase Sintering”, Metall. Mater. Trans. A, 2001, vol. 32A, no. 4, pp. 971–976.
4. D.M Turriff and S.F. Corbin, “Quantitative Thermal Analysis of T ransient Liquid-Phase-Sintered Cu-Ni Powders”, Metall. Mater. Trans. A, 2008, vol. 39, no. 1, pp. 28–38.
5. F.J. Puckert, W.A. Kaysser and G. Petzow, “Transient Liquid Phase Sintering of Ni-Cu”, Z. Metallkde, 1983, vol. 74, no. 11, pp. 737–743.
6. R.M. German and J.W. Dunlap, “Processing of Iron-Titanium Powder Mixtures by Transient Liquid Phase Sintering”, Metall. Trans. A, 1986, vol. 17A, no. 2, pp. 205–213.
7. W.H. Baek and R.M. German, “Transient Liquid Phase Sintering in the Fe-Fe2Ti System”, Int. J. Powder Metall., 1986, vol. 22, no. 4, pp. 235–244.
8. R.N. Lumley and G.B. Schaffer, “The Effect of Solubility and Particle Size on Liquid Phase Sintering”, Scripta Mater.,1996, vol. 35, no. 5, pp. 589–595.
9. B. Fisher and P.S. Rudman, “X-ray Diffraction Study of Interdiffusion of Cu-Ni Powder Compacts”, J. Applied Physics,1961, vol. 32, no. 8, pp. 1,604–1,612.
10. R. Delhez, E.J. Mittemeijer and E.A. van den Bergen, “ X-ray Diffraction Line Profile Analysis of Diffusional Homogenization in Powder Blends“, J. Mater. Sci., 1978, vol. 13, no. 8, pp. 1,671–1,679.
11. M. Potter, H. Fritzsche, D.H. Ryan and L.M.D. Cranswick, “Low-Background Single-Crystal Silicon Sample Holders for Neutron Powder Diffraction”, J. of Appl. Crystallogr., 2007, vol. 40, no. 3, pp. 489–495.
12. L.M.D. Cranswick, R. Donaberger, I.P. Swainson and Z. Tun, “Convenient Off-Line Error Quantification and Characterization of Concentricity of Two Circles of Rotation for Diffractometer Alignment”, J. of Appl. Crystallogr.,2008, vol. 41, no. 2, pp. 373–376.
13. I. Bull, P. Lightfoot, L.A. Villaescusa, L.M. Bull, R.K.B. Gover, J.S.O. Evans and R.E. Morris, “An X-ray Dif fraction and MAS NMR Study of the Ther mal Expansion Properties of Calcined Siliceous Ferrierite”, J. Am. Chem. Soc.,2003, vol. 125, pp. 4,342–4,349. 14. D.M. Turriff, “Process Kinetics of Transient Liquid Phase
Sintering in a Binary-Isomorphous Alloy System”, 2007, PhD Thesis, University of Waterloo, Waterloo, ON, Canada. 15. D.M. Turriff and S.F. Corbin, “Modelling the Influences of
Solid-State Interdiffusion and Dissolution on Transient Liquid Phase Sintering Kinetics in a Binary Isomorphous System”, Metall. Mater. Trans. A, 2006, vol. 37A, no. 5, pp. 1,645–1,655.
16. C.S. Barrett, Structure of Metals, Second Edition, 1952, McGraw-Hill, New York, NY.
17. B. Hinrichsen, R.E. Dinnebier and M. Jansen, “Powder3D: An Easy to Use Program for Data Reduction and Graphical Presentation of Large Numbers of Powder
Diffraction Patterns”, Z. Kristallogr. Suppl., 2006, vol. 23, pp. 231–236,
18. Y.S. Touloukian, R.K. Kirby and P.E. T aylor, Thermophysical Properties of Matter—TPRC Data Series, Vol. 12, Thermal Expansion Metallic Elements and Alloys, 1979, IFI/Plenum Press, New York, NY.
19. T.B. Massalski, editor, “Ni-Cu Binary Alloy Phase Diagram”, Binary Alloy Phase Diagrams, 1986, vol. 1, American Society for Metals, Metals Park, OH.ijpm