Publisher’s version / Version de l'éditeur:
Canadian Metallurgical Quarterly, 47, 2, pp. 163-172, 2008-01-04
READ THESE TERMS AND CONDITIONS CAREFULLY BEFORE USING THIS WEBSITE. https://nrc-publications.canada.ca/eng/copyright
Vous avez des questions? Nous pouvons vous aider. Pour communiquer directement avec un auteur, consultez la première page de la revue dans laquelle son article a été publié afin de trouver ses coordonnées. Si vous n’arrivez pas à les repérer, communiquez avec nous à [email protected].
Questions? Contact the NRC Publications Archive team at
[email protected]. If you wish to email the authors directly, please see the first page of the publication for their contact information.
NRC Publications Archive
Archives des publications du CNRC
This publication could be one of several versions: author’s original, accepted manuscript or the publisher’s version. / La version de cette publication peut être l’une des suivantes : la version prépublication de l’auteur, la version acceptée du manuscrit ou la version de l’éditeur.
Access and use of this website and the material on it are subject to the Terms and Conditions set forth at
Determination of the thixocasting temperatures of AZ91D and other Mg
alloys using a quenching method
Giguère, N.; Amira, S.; Tremblay, R.; Loong, C. A.; Dubé, D.
https://publications-cnrc.canada.ca/fra/droits
L’accès à ce site Web et l’utilisation de son contenu sont assujettis aux conditions présentées dans le site LISEZ CES CONDITIONS ATTENTIVEMENT AVANT D’UTILISER CE SITE WEB.
NRC Publications Record / Notice d'Archives des publications de CNRC:
https://nrc-publications.canada.ca/eng/view/object/?id=f2fef231-0451-4e59-b12c-8cec7f5c53c6 https://publications-cnrc.canada.ca/fra/voir/objet/?id=f2fef231-0451-4e59-b12c-8cec7f5c53c6DETERMINATION OF THE THIXOCASTING TEMPERATURES
OF AZ91D AND OTHER Mg ALLOYS USING A
QUENCHING METHOD
N. GIGUÈRE1, S. AMIRA1, R. TREMBLAY1, C.A. LOONG2and D. DUBÉ1
1Department of Mining, Metallurgical and Materials Engineering, Université Laval,
Quebec City, Quebec, Canada G1K 7P4
2Aluminium Technology Centre, Industrial Materials Institute, National Research Council Canada,
Boucherville, Quebec, Canada J4B 6Y4
(Received in revised form March, 2008)
Abstract — The thixocasting injection temperature is a crucial processing parameter, frequently unavailable in the literature, especially for newly developed alloys. In this work, a simple and rapid method derived from the quenching method was developed to obtain an acceptable thixocasting injection temperature range for various magnesium alloys: AZ91D, AJ62x, AXJ530, MRI153 and ZAEX10440. Small specimens of each alloy were heated to appropriate temperatures within the semisolid range and quenched. Their microstructure was observed optically and the proportion of phase was measured using quantitative image analysis. The microsegregation was characterized and two different heating cycles prior to quenching were studied. The apparent volume fraction of the primarysolidwas determined as a function of quenching temperature between liquidus and solidus. These results were found useful to obtain a practical injection temperature range for each alloy and to obtain good quality thixocast parts. Résumé — La température d’injection pour la thixocoulée est un paramètre crucial de procédé qui n’est pas toujours disponible dans la littérature et ce, surtout dans le cas de nouveaux alliages développés en laboratoire. Dans cet article, une méthode simple et rapide, dérivée de la méthode de trempe, est proposée pour estimer un intervalle de température d’injection d’alliages de magnésium tels que AZ91D, AJ62x, AXJ530, MRI153 et ZAEX10440. Des spécimens de chaque alliage ont été chauffés à différentes températures dans l’intervalle semisolide et trempés. Leur microstructure a été observée en microscopie optique et analysée quantitativement par analyse d’image afin de mesurer la proportion de la phase solide primaire. La microségrégation a également été mesurée dans les phases après trempe et deux cycles thermiques différents ont été comparés. La fraction volumique apparente de la phase solide primaire a été déterminée en fonction de la température de trempe entre le liquidus et le solidus. À partir de ces résultats, un intervalle de température a été estimé pour chaque alliage afin d’obtenir par thixocoulée des pièces d’excellente qualité.
INTRODUCTION
Semisolid injection moulding methods are regarded as emerging fabrication processes for magnesium based components requiring excellent surface finish, dimensional accuracy and low porosity [1,2]. Among them, the thixocasting process that uses semisolid billets is particularly attractive since reduced quantities of material are necessary for experimentation of new alloys, testing their rheological and mechanical properties as well as their corrosion performance.
Various methods have been developed for the preparation of billets: extrusion [3], mechanical
stirring [1,4], electromagnetic stirring (EMS) [5], rapid slug cooling technology (RSCT) [6] and direct thermal method [7]. The specific rheological behaviour of semisolid billets depends on their microstructure [8] and also on the thermochemical properties of the alloy [8,9]: latent heat of melting, heat capacity, solidifi-cation range and liquid fraction sensitivity (dfL/dT).
The reheating cycle of billets, die temperature, ram speed and applied pressure are thixocast parameters that contribute to the overall quality of thixocast components [5]. The preheating temperature of billets is probably the most important parameter since it strongly influences the fraction of primary
N. GIGUÈRE, S. AMIRA, R. TREMBLAY, C.A. LOONG and D. DUBÉ
solid phase at injection temperature, the optimum solid ranging usually between 40-60 vol% [8-11]. Consequently, the knowledge of solidification curves of alloys, i.e., the relation between fraction of primary phase and temperature is necessary.
Theoretical solidification curves can be obtained by using two limiting models: 1) the lever rule which assumes complete thermodynamic equilibrium and 2) the Scheil relation which presupposes local equilibrium at the interface, complete diffusion in the liquid phase and no diffusion within the solidified phase. These two models have been used by many authors [2,12-17,] for comparison purposes but they are often difficult to use with the newly developed alloys for which thermophysical properties are unknown.
Ghosh et al. [2] have used differential scanning calorimetry (DSC) to determine experimentally the solidification curve of AZ91D magnesium alloy. However, a significant volatilization of zinc and magnesium at high temperature and contamination as well as oxidation problems associated with the low scanning rates prevented reliable measurements. Recently, Mirkovic et al. [13] have used DSC with sealed Ta-crucible to obtain the solid fraction of AZ91D alloy as a function of temperature assuming a simple linear dependence of heat evolution with solid fraction. They also proposed an in situ heat transfer model to further improve differential thermal analysis (DTA) and reduce smearing problems associated with thermal methods [18]. Results from DSC and DTA methods cannot discriminate between the liquid phase remaining entrapped within primary grains and the liquid phase formed between grains which directly influence rheological behaviour.
A more direct method which involves quenching of specimens from the semisolid condition and evaluation of the fraction of phases by quantitative image analysis has been used by many authors [12,13,18-25]. This so-called quenching method is relatively rapid and does not require expensive equipment. Moreover, no assumption about any thermophysical property of the alloys is required. However overestimation of the solid fraction caused by
a substantial solid deposition on to the primary phase during quenching was reported frequently [12,13,18-25]. It was observed that high cooling rates (160 K/s) during quenching of small aluminum specimens can prevent this phenomenon efficiently [21]. Lower cooling rates (80 K/s) were also found acceptable for specimens containing a lower fraction of solid [21]. Mirkovic et al. [12,13,18] have used this quenching method with specimens of AZ91 alloys [12]. They also reported overestimation problems and indicated that the use of liquid nitrogen as quenching medium could not provide a very effective cooling medium, likely due to the formation of a gas blanket at the surface of the specimens during quenching [26].
In the present work, small semisolid specimens of magnesium alloys preheated at different temperatures were rapidly quenched to preserve as much as possible the primary phase formed initially. The microstructure of quenched specimens was characterized as a function of quenching temperature and microsegregation in the primary phase was measured. The volume fraction of the primary phase was determined as a function of quenching temperature producing calibration curves. Using these curves, the injection temperature of different magnesium alloys was estimated. These predicted temperatures were comparable to best injection temperatures used during the thixocasting experiments.
EXPERIMENTAL PROCEDURES
Composition and Properties of Alloys
The experimental method has been developed with the AZ91D magnesium alloy. Then it has been applied to four newly developed magnesium alloys (AJ62x, AXJ530, MRI153 and ZAEX10440) in order to determine the influence of temperature on the apparent fraction of the primary phase and estimate a practical injection temperature. The chemical composition of these alloys is given in Table I whereas their solidus and liquidus are given in Table II. The solidus-liquidus range was varying between 83 to 125 °C for Mg-Al based alloys, increasing regularly with the
concen-164
Table I –Chemical composition of magnesium alloys
Composition (wt%) Alloy Al Zn Sr Mn RE Ca Ce Mg AZ91D 9.0 0.71 - 0.25 - - - Bal. AJ62x 6.0 0.01 2.6 0.43 - - - Bal. AXJ530 4.9 - 0.16 0.3 - 3.0 - Bal. MRI153 8.3 1.0 0.01-0.2 0.16 0.05-1.0 0.84 0.11 Bal. ZAEX10440 3.6 10.3 - 0.1 3.8 0.21 1.81 Bal.
tration of aluminium and more than 262 °C for the Mg-Zn based alloy.
Specimens Preparation
Billets of 7.5 cm in diameter and 15.0 cm in length were prepared from ingots of magnesium alloys melted in a stainless steel crucible and protected using a CO2 -0.5% SF6 gas mixture with a positive pressure. The melt was held in the temperature range between 720 and 735 °C. Billets were gravity cast in a permanent mould preheated at about 350 °C and mounted on a massive copper heat sink [27]. Specimens of about 7.0 g were cut out from these billets and used to determine the influence of preheating temperature on the apparent volume fraction of the primary phase after quenching. These specimens were inserted into cylindrical steel crucibles having 2.0 cm in diameter, 2.5 cm in length and 2.0 mm of wall thickness.
Heating Cycles and Quenching Experiments
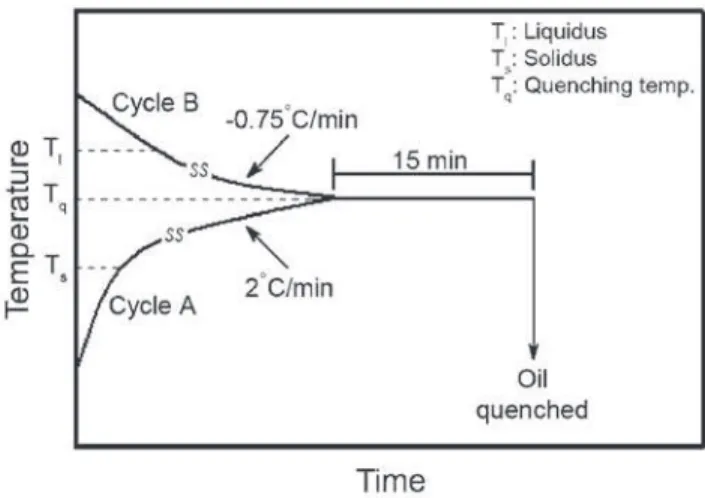
The cylindrical crucibles (filled with the 7.0 g specimens) were placed inside a larger stainless steel chamber electrically heated under a CO2-0.5% SF6 protective gas (less than 0.1 litre per minute) assuring a positive pressure during melting. They were heated to the liquidus-solidus temperature range using one of two different heating cycles shown in Figure 1 and then quenched. A fine thermocouple was used to measure the temperature of each specimen within the crucibles. Using Cycle A, specimens were progres-sively heated to the quenching temperature (Tq) and then oil quenched. Using Cycle B, specimens were heated to 25 °C above their respective liquidus, cooled down to the quenching temperature (Tq) and then oil quenched. The quenching temperature (Tq) was maintained for 15 minutes for both cycles, a time sufficient to obtain a homogeneous temperature within the semisolid specimens.
Quenching was performed using canola oil which was chosen over conventional mineral oil and water for its excellent heat extraction capacity [29] and safety with respect with molten magnesium preventing
explosion of semisolid specimens [20]. For AZ91 specimens, the time between quenching temperature and solidus was less than 1.5 seconds as measured using a fine thermocouple inserted inside the specimens giving a cooling rate of about 80-90 K.s-1.
This cooling rate was confirmed by measuring the secondary dendrites arm spacings (SDAS) of the fine dendrites formed upon quenching between the primary α-Mg grains where the average aluminum concen-tration is about 15 wt%. The following relation proposed by [30] was used.
SDAS (µm) = 3.4 tf0.46 (1)
where tf is measured in seconds. Average SDAS of 4.5
µm were measured within the rapidly quenched liquid regions. A local solidification time tf of 1.8 seconds is
then calculated yielding a cooling rate of about 75 K.s-1
and a liquidus-solidus range of 130 °C being considered for the residual liquid. The uncertainty on quenching temperature was typically ±1 °C.
Determination of Volume Fraction of Primary Phase and Microsegregation
In quenched specimens, the apparent volume fraction of the primary phase was determined from the microstructure of quenched specimens using optical microscopy. The specimens were mechanically polished down to 0.1 µm and then etched with the reagent developed by Maltais et al. [31]. The microstructure of each specimen was examined at 25X magnification and the volume fraction of primary grains was measured over six different fields using quantitative image analysis. In micrographs, the bright
Table II – Liquidus and solidus of alloys [27,28]
Alloy Solidus (°C) Liquidus (°C)
AZ91D 470 595
AJ62x 517 612
AXJ530 524 607
MRI153 505 602
ZAEX10440 324 586
Fig. 1. Schematic curves showing the heating Cycles A and B used prior to quenching magnesium alloy specimens (The given cooling and heating rates are average values within the liquidus-solidus range).
N. GIGUÈRE, S. AMIRA, R. TREMBLAY, C.A. LOONG and D. DUBÉ
regions having a relatively large radius of curvature correspond essentially to the primary α-Mg phase. The dark regions containing α-Mg fine dendrites and secondary phases were formed upon quenching and originate from the solidification of the residual liquid phase.
After Cycle A, a liquid phase was entrapped within the primary grains. This liquid was neglected since it was not connected to the residual liquid surrounding the grains and consequently it was not available to improve flowing properties. In the present work, the volume of this entrapped liquid phase was estimated to about 2-3 vol%.
Microsegregation in quenched specimens was compared using elemental line scans across the primary phase and the rapidly solidified liquid phase. Semiquantitative concentration profiles of aluminum and zinc were obtained with an electron probe microanalyser (EPMA). Detection limits under analytical conditions were typically 0.1 wt% for zinc and 0.03 wt% for aluminum.
Thixocasting Tests with Billets
Billets of the five different magnesium alloys (AZ91D, AJ62x, AXJ530, MRI153 and ZAEX10440) were thixocast using a Buhler die-casting machine. They were first preheated for 8 minutes with a high frequency induction heating system [27]. They were then introduced into the injection sleeve and injected in an experimental box-like mould. Different injection temperatures were tested until the quality of the injected box was optimized [27].
RESULTS AND DISCUSSION
Microstructure of AZ91D Billet
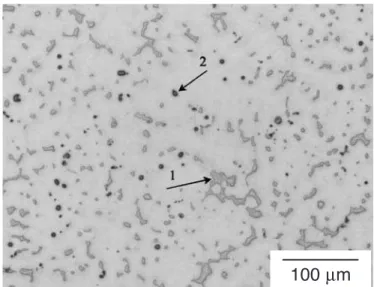
The microstructure of the gravity cast AZ91D billets is shown in Figure 2. Massive Mg17Al12secondary phase
particles indicated by 1) were distributed in the α-Mg matrix and some Al-Mn particles indicated by 2) were observed. The grain size of specimens used for the heating and quenching experiments was about 215 µm.
Microstructure of Quenched Specimens
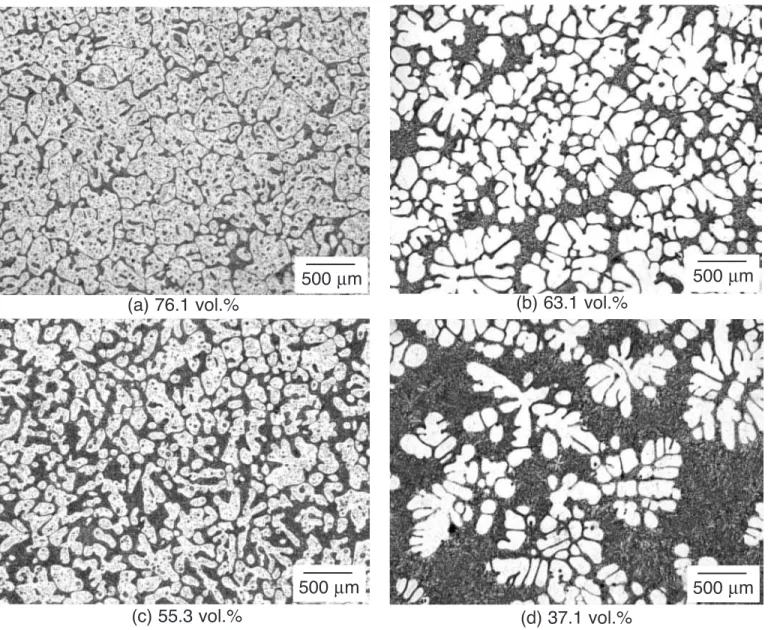
Optical micrographs of AZ91D specimens quenched from different semisolid temperatures are presented in Figure 3. The volume fraction of primary grains determined from image analysis is also given. Dark areas which are composed of fine eutectic constituents correspond to regions that were in the molten state at the moment of quenching. Bright and coarse areas show grains of the primary α-Mg grains. The microstructure of specimens quenched upon Cycle A
(Figures 3a and 3c) shows islands of β-phase entrapped within the primary α-Mg grains. These entrapped islands were formed above eutectic temperature. Local remelting occurred within the primary α-Mg grains in areas containing the highest concentration of aluminum and zinc. During quenching, these locally remelted areas have crystallized producing α-Mg phase and residual β-particles. The microstructure of specimens quenched upon Cycle B (Figures 3b and 3d) do not show such entrapped liquid.
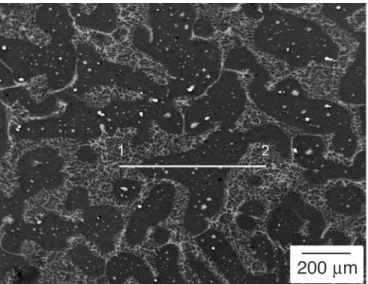
Rapid epitaxial solidification onto the primary α-Mg grains was expected due to the limited cooling rate during quenching [12,13,18-26]. This solid deposition is visible in Figure 4 for specimens preheated using Cycle A where a thin but continuous layer of α-phase encloses particles of β-phase formed within α-Mg grain upon quenching. In specimens preheated using Cycle B, the dense α-Mg grains prevent any visual contrast that could reveal a rapid growth onto the primary solid phase.
Microsegregation in Quenched AZ91D Specimens
Evaluation of the microsegregation in quenched AZ91D specimens was performed using elemental line scans across the grains of primary α-Mg phase. The position of the line scans and the corresponding semiquantitative aluminum and zinc concentration profiles are shown in Figures 5 to 8.
The comparison of curves in Figures 6 and 8 shows that concentration profiles of Al and Zn are lower and more uniform across primary α-Mg grains formed during Cycle B. However, the concentration of Al and Zn is higher between primary grains of specimens treated using Cycle B. These concentration
166
Fig. 2. Microstructure of unetched AZ91D billets showing 1) massive Mg17Al12particles and 2) fine Al-Mn particles dispersed within α-Mg matrix.
profiles are explained by the systematic rejection of solutes which occurred during the crystallization of α-Mg grains leading to solute rejection at the interface and diffusion into the surrounding liquid phase. The composition profile shows a homogeneous elemental distribution in primary grains where the average concentration of aluminum is about 3.5 wt% and zinc 0.2 wt%.
Grains formed during Cycle A experienced ripening after partial remelting of specimens. Many solute-rich liquid islands remained trapped within the primary α-grains. Solute diffusion occurred at the interface between the solid and liquid phases during heating Cycle A but somewhat less solute diffusion occurred since these specimens remained for a long period at a relatively lower temperature. Moreover,
solute dispersion within the liquid phase was difficult due to the limited connectivity between liquid regions. The solute distribution within primary grains is consequently more heterogeneous due to the presence of many isolated particles of β-phase. In specimens quenched after Cycle A, the average concentration of aluminum in primary α-Mg grains is about 3.9 wt% and that of zinc is about 0.2 wt%.
Volume Fraction of Primary Phase in Quenched AZ91D Specimens
The volume of primary α-Mg grains measured in the polished cross-section of AZ91D specimens as a function of quenching temperature following Cycles A and B is presented in Figure 9. For comparison
Fig. 3. Microstructures of AZ91D specimens quenched from the semisolid state: at 570 °C for specimens a) and b) following Cycles A and B, respectively and at 585 °C for specimens c) and d) following Cycles A and B respectively.
500 µm
500 µm
500 µm
500 µm
(a) 76.1 vol.%
(b) 63.1 vol.%
N. GIGUÈRE, S. AMIRA, R. TREMBLAY, C.A. LOONG and D. DUBÉ
purposes, the theoretical temperature dependence of solid fraction in AZ91D as a function temperature is reproduced from Reference [2].
For a given quenching temperature, the volume fraction of primary α-Mg in specimens quenched after Cycle A is systematically superior to that formed after Cycle B. The volume of entrapped liquid, estimated at 2-3 vol% can not explain the observed difference. Moreover, since the temperature was monitored with a fine thermocouple embedded in semisolid specimens during heating cycles and quenching, a temperature lag effect is ruled out. So, the discrepancy between the two
curves is explained as follows. Semisolid specimens obtained upon Cycle A were maintained for a long period at a relatively lower temperature prior to quenching compared to semisolid specimens obtained after Cycle B, which have formed upon cooling and at a relatively high temperature. Therefore, a less
168
Fig. 4. Backscattered electron micrograph showing the distribution of the secondary phase formed within a grain of primary α-Mg phase during Cycle A in the AZ91D specimen.
Fig. 5. Backscattered electron micrograph showing the position of the line scan across a primary α-Mg grain formed during Cycle A in the AZ91D spec-imen.
Fig. 6. Concentration profiles of aluminum and zinc across the primary α-Mg grain of the specimen shown in Figure 5 (see line scan 1→ 2).
Fig. 7. Backscattered electron micrograph showing the position of the line scan across a primary α-Mg grain formed during Cycle B in the AZ91D spec-imen.
30 µm
200 µm
extensive diffusion and a reduced redistribution of solute occurred in the solid phase during the heating portion of Cycle A and most of the solutes (Al and Zn) within primary α-Mg grains could not reach the rest of the liquid phase producing less solute in the liquid phase compared to specimens treated using Cycle B. In addition, during heating Cycle A, the gradual dissolution of the solid phase has produced a solvent build-up at the melting interface. This solvent accumu-lation (or solute depletion) increased locally the liquidus temperature slowing down the dissolution process until a more homogeneous dispersion was established in the interdendritic liquid phase. The greater volume of liquid observed in the specimens quenched after Cycle B is also in accordance with the lower aluminum concentration found within primary α-Mg grains of specimens quenched after Cycle B. The results obtained with Cycle B are in agreement with those of Carnahan et al. [32], although the latter show a wider dispersion.
For specimens treated using Cycles A and B, the volume proportions of primary α-Mg grains measured with quantitative image analysis are larger than those obtained theoretically from the solidification curve (Figure 9). This greater volume of apparent solid is ascribed to a rapid growth of the solid on to the primary α-phase during quenching [12,13,18-26]. Despite the rapid cooling from semisolid state, some crystallization on to primary α-Mg phase occurred.
Practical Thixocasting Temperature for Billets
Shehata et al. [5] found experimentally that a temperature range of 575-580 °C is the most suitable for thixocasting AZ91D alloy. This temperature range corresponds to a fraction of the primary phase of approximately of 45-53 vol% according to calculations based on the Mg-Al phase diagram but to less than 30-40 vol% according to theoretical curves from Reference [2] (Figure 9). However, since the short preheating period prior to thixocasting provides far from equilibrium conditions for the liquid and solid phases, the actual proportion of the primary solid at thixocasting temperature is probably different from these estimates.
A more practical and empirical approach was considered based on the assumption that semisolid specimens containing comparable proportion of primary phase at quenching temperature also show a similar quantity of apparent primary phase after quenching. During quenching, a comparable growth of solid on to the primary solid is assumed to occur for the different magnesium alloys, assuming that similar heating and quenching conditions are maintained [23,24].
In the case of AZ91D specimens, a practical thixocasting temperature of 580 °C was found appropriate for AZ91D billets [2]. In the AZ91D specimens oil quenched from this temperature following Cycle B, there is about 50 vol% of apparent primary phase. So, it is assumed that the quenching temperature producing this fraction of the primary phase in other magnesium alloys would also indicate their corresponding appropriate thixocasting temperature.
It was found by experience that the close relation between the two calibration curves (based on Cycle A and Cycle B) allows using one or the other of the calibration curves and providing similar indications
Fig. 8. Concentration profiles of aluminum and zinc across the primary α-Mg grain of the specimen shown in Figure 7 (see line scan 1→ 2).
Fig. 9. Apparent volume fraction of the primary α-Mg in AZ91D specimens treated using Cycles A and B.
N. GIGUÈRE, S. AMIRA, R. TREMBLAY, C.A. LOONG and D. DUBÉ
about the best injection temperature. However, although Cycle A is apparently better at simulating the practical reheating cycle of billets prior to thixocasting, curves showing the apparent fraction of solid after Cycle A were not used to determine the thixocasting temperature of the other alloys since it was found more difficult to evaluate the volume fraction of the primary solid due to the relatively intricate distribution of entrapped liquid phases in specimens quenched after Cycle A.
Practical Injection Temperature of Other Magnesium Alloys
The above-described procedure for AZ91D alloy has been used to determine the volume fraction of the primary phase after quenching in newly developed AJ62x, AXJ530, MRI 153 and ZAEX10440 magnesium alloys for which no reliable thixocasting injection temperature was found in literature. Small specimens of these alloys were heated in the semisolid state using Cycle B and quenched. All specimens were polished and the apparent fraction of the primary solid phase was determined by quantitative image analysis as a function of quenching temperature.
Results presented in Table III indicate the quenching temperature for which 40 and 60 vol% apparent fractions of the primary phase were obtained following Cycle B. The practical injection temperature of successfully thixocast billets is also given for each alloy. It was found that the best injection temperature was close to about 50 vol% of apparent primary solid in specimens quenched after Cycle B [27].
CONCLUSIONS
A simple and rapid method has been developed to obtain the thixocasting injection temperature of different magnesium alloys. The apparent fraction of the primary α-Mg phase in quenched specimens was obtained as a function of the quenching temperature between the solidus and liquidus for each alloy. Two
different heating cycles before quenching have been studied and calibration curves of the apparent solid fraction were obtained for the AZ91D magnesium alloy as a function of the quenching temperature and compared to literature.
Considering magnesium alloys have a comparable semisolid temperature range, it was found that a quenching temperature producing about 50 vol% of apparent primary phase in specimens quenched from the mushy state, indicate the practical injection temperature for thixocasting.
ACKNOWLEDGEMENTS
The authors are grateful to the Natural Sciences and Engineering Research Council (NSERC) of Canada for financial support during the project. Special thanks to Mr. P. Labelle (Noranda, Qué., Canada), Mr. M. Vézina (Norsk Hydro, Québec, Canada) and Dr. B. Powell (General Motors Co., MI, U.S.A.) for magnesium ingots, Dr. N. Hort (GKSS Research Center, Geesthacht, Germany) for DTA measurements and Mrs. M. Larouche, Mr. A. Ferland and Mr. M. Choquette for professional assistance.
REFERENCES
1. Z. Koren, H. Rosenson, E.M. Gutman, Y.B. Unigovski and A. Eliezer, J. Light Metals, 2002, vol. 2, pp. 81-87.
2. D. Ghosh, R. Fan and C. Van Schilt, in Recent Developments in
Light Metals, Proc. of CIM Conference, 1994, eds. M. Gilbert,
P. Tremblay and E. Ozberk, pp. 377-386.
3. S. Kleiner, O. Beffort and P.J. Uggowitzer, Scripta Materialia, 2004, 51, pp. 405-410.
4. D. Brabazon, D.J. Browne and A.J. Carr, Mater. Sci. and Eng.
A, 2002, vol. 326, pp. 370-381.
5. M.T. Shehata, V. Kao, E. Essadiqi, C.A. Loong and C.-Q. Zheng, SAE Transactions: Journal of Materials & Manufacturing, 2003, 111, pp. 53-58.
6. J. Aguilar, M. Fehlbier, A. Ludwig, A. Bührig-Polaczek and P.R. Sahm, Mater. Sci. and Eng. A, 2004, vol. 375-377, pp. 651-655.
7. D.J. Browne, M.J. Hussey, A.J. Carr and D. Brabazon, Inter.
Jour. of Cast Metals Research, 2003, vol. 16, pp. 418-426.
8. A.M. Camacho, H.V. Atkinson, P. Kapranos and B.B. Argent,
Acta Materialia, 2003, vol. 51, pp. 2319-2330.
170
Table III – Quenching temperature of specimens containing 40 and 60 vol% apparent solid primary phase following Cycle B and practical injection temperature for different magnesium alloys
Alloy 40 vol% apparent solid 60 vol% apparent Practical injection fraction temp. solid fraction temp. temp.
(°C) (°C) (°C) AZ91D 585 573 580 AJ62x 603 588 595 AXJ530 597 587 592 MRI153 588 580 585 ZAEX10440 578 563 573
9. H. Kaufmann and P.J. Uggowitzer, in Magnesium Alloys and their
Applications, 2000, ed. K.U. Kainer, Wiley-VCH, pp. 533-539.
10. S.E. LeBeau, M.W. Wakulas, R.F. Decker, P. Labelle, A.R. Moore and J.W. Jones, SAE 2004 World Congress, Technical Paper 2004-01-0137, 2004, pp. 49-58.
11. S. Kleiner, O. Beffort, A. Wahlen and P.J. Uggowitzer, J. Light
Metals, 2002, vol. 2, pp. 277-280.
12. D. Mirkovic, J. Gröbner and R. Schmid-Fetzer, in Magnesium
Alloys and their Applications, 2000, ed. K.U. Kainer,
Wiley-VCH, pp. 783-788.
13. D. Mirkovic, J. Gröbner and R. Schmid-Fetzer, in Magnesium
Alloys and their Applications, 2003, ed. K.U. Kainer,
Wiley-VCH, pp. 842-847.
14. W. Fragner, H. Kaufmann, H. Helmberger and R. Potzinger, in
Magnesium Alloys and their Applications, 2003, ed. K.U.
Kainer, Wiley-VCH, pp. 688-693.
15. Q. Han, E.A. Kenik, S.R. Agnew and S. Viswanathan, in
Magnesium Technology 2001, 2001, ed. J. Hryn, TMS, p. 81-86.
16. P. Bakke, C.D. Fuerst and H. Westengen, in Magnesium
Technology 2000, 2000, eds. H.I. Kaplan, J. Hryn and B. Clow,
TMS, p. 201-210.
17. J.F. Grandfield and A.K. Dahle, in Magnesium Technology
2000, 2000, eds. H.I. Kaplan, J. Hryn and B. Clow, TMS, pp.
219-228.
18. D. Mirkovic and R. Schmid-Fetzer, Z. Metallkunde, 2006, vol. 97, pp. 119-129.
19. S.-W. Chen, Y.-Y. Chuang, Y.A. Chang and M.G. Chu, Metall.
Trans. A, 1991, vol. 22A, pp. 2837-2848.
20. S.-W. Chen and C.-C. Huang, Acta Metallurgica, 1996, vol. 44, pp. 1955-1965.
21. O. Pompe and M. Rettenmayr, J. Crystal Growth, 1998, vol. 192, pp. 300-306.
22. J.C. Gebelin, M. Suery and D. Favier, Mater. Sci. and Eng. A, 1999, vol. 272, pp. 134-141.
23. E. Tzimas and A. Zavaliangos, Mater. Sci. and Eng. A, 2000, vol. 289, pp. 228-240.
24. E. Tzimas and A. Zavaliangos, J. Mater. Sci., 2000, vol. 35, pp. 5319-5329.
25. D. Ruvalcaba, D. Eskin and L. Katgerman, Mater. Sci. Forum, 2006, vol. 519-520, pp. 1707-1712.
26. S.H. Avner, in Introduction to Physical Metallurgy, 1974, 2nd
edition, McGraw-Hill, p.288.
27. N. Giguère, “Étude comparée des propriétés mécaniques d’alliages de magnésium moulés par injection à partir de l’état liquide et semisolide”, Master’s Thesis, 2005, Laval University, Quebec, Canada, 134 pp.
28. S. Amira, “Influence of Microstructure on Corrosion Behaviour and Mechanical Properties of Some Creep Resistant Magnesium Alloys”, PhD. Thesis, 2007, Laval University, Quebec, Canada, p. 355.
29. W. Ordinanz, Introduction à la trempe, 1966, Dunod, Paris, France, p. 356.
30. C.L. Bancroft. C.H. Caceres, C.J. Davidson and J.R. Griffiths,
Magnesium Alloys and Their Applications, 1998, eds. B.L.
Mordike and K.U. Kainer, Wiley-VCH, pp. 345-349.
31. A. Maltais, D. Dubé, M. Fiset, G. Laroche and S. Turgeon,
Mater. Characterization, 2004, vol. 52, pp. 103-119.
32. R. Carnahan, R.M. Hathaway, R. Kilbert, L. Pasternak and P. Rohatgi, Light Metals Processing and Applications, 1993, eds. C. Bickert, M. Bouchard, G. Davies, E. Ghali and E. Jiran,