Publisher’s version / Version de l'éditeur:
Acta Geotechnica, 1, December 3, pp. 149-156, 2006-12-01
READ THESE TERMS AND CONDITIONS CAREFULLY BEFORE USING THIS WEBSITE.
https://nrc-publications.canada.ca/eng/copyright
Vous avez des questions? Nous pouvons vous aider. Pour communiquer directement avec un auteur, consultez la
première page de la revue dans laquelle son article a été publié afin de trouver ses coordonnées. Si vous n’arrivez pas à les repérer, communiquez avec nous à [email protected].
Questions? Contact the NRC Publications Archive team at
[email protected]. If you wish to email the authors directly, please see the first page of the publication for their contact information.
NRC Publications Archive
Archives des publications du CNRC
This publication could be one of several versions: author’s original, accepted manuscript or the publisher’s version. / La version de cette publication peut être l’une des suivantes : la version prépublication de l’auteur, la version acceptée du manuscrit ou la version de l’éditeur.
For the publisher’s version, please access the DOI link below./ Pour consulter la version de l’éditeur, utilisez le lien DOI ci-dessous.
https://doi.org/10.1007/s11440-006-0008-6
Access and use of this website and the material on it are subject to the Terms and Conditions set forth at
Evaluation of slurry settling rate using fuzzy rule-based modeling
Azam, S.; Sadiq, R.
https://publications-cnrc.canada.ca/fra/droits
L’accès à ce site Web et l’utilisation de son contenu sont assujettis aux conditions présentées dans le site LISEZ CES CONDITIONS ATTENTIVEMENT AVANT D’UTILISER CE SITE WEB.
NRC Publications Record / Notice d'Archives des publications de CNRC:
https://nrc-publications.canada.ca/eng/view/object/?id=ee4544cb-1c55-4a93-a08e-75b1512a10a5 https://publications-cnrc.canada.ca/fra/voir/objet/?id=ee4544cb-1c55-4a93-a08e-75b1512a10a5
http://irc.nrc-cnrc.gc.ca
E v a l u a t i o n o f s l u r r y s e t t l i n g r a t e u s i n g f u z z y
r u l e - b a s e d m o d e l i n g
N R C C - 4 9 4 5 9
A z a m , S . ; S a d i q , R .
A version of this document is published in / Une version de ce document se trouve dans: Acta Geotechnica, v. 1, no. 3, Dec. 2006, pp. 149-156
Evaluation of slurry settling rate using fuzzy rule-based modeling
By
Shahid Azam1, * and Rehan Sadiq2
1. Department of Mining Engineering, University of British Columbia, Vancouver, Canada 2. Institute for Research in Construction, National Research Council of Canada, Ottawa, Canada
Abstract
The pressure acid leach process is the most widely used method of metal extraction from laterite ores. The self-weight settling rate of the ore slurries governs the throughput of the process and is improved by adding synthetic polymers. The charge density, molecular weight, and dosage of the polymers are the key factors influencing the settling rate of the slurries. This interdisciplinary paper uses the geotechnical understanding of hindered sedimentation for a mining engineering application. A conceptual fuzzy rule-based model was developed to evaluate the initial hydraulic conductivity of polymer-modified laterite ore slurries. Identification of control parameters and selection of the model architecture (fuzzy rule-base) were based on expert judgement. The developed model was trained and validated using bench-scale settling test data. The model reasonably predicts the initial hydraulic conductivity of polymer-added laterite ore slurry with a coefficient of determination of 0.75. Rank correlation coefficient based sensitivity analyses indicated that charge density was the most significant polymer parameter followed by molecular weight and then by dosage. Charge density accounted for more than 97% of variability in the initial hydraulic conductivity estimates for both anionic and cationic polymers.
* Corresponding Author.
1. Introduction
The pressure acid leach process is the most widely used method for extracting nickel and cobalt from laterite ores due to its high recovery, low environmental risk, and economic viability [1]. This mining process requires that the ore slurries settle at a rapid rate under self-weight. Synthetic polymers are added to the feed for improved slurry settling rates thereby increasing system efficiency in terms of process throughput [2]. Given a consistent composition of colloids (size distribution, mineralogy, and surface charges) and water (pH, ions concentration, and electrical conductivity), the settling rate of laterite ore slurries is governed by polymer parameters: charge density (C); molecular weight (M); and dosage (D). The collide-water-polymer interactions are highly complicated and result in an insufficient mechanistic understanding of the settling process [3].
Polymer performance is usually assessed using bench-scale settling tests. Due to expensive and time-consuming procedures, the test programs are mostly unsystematic and incomprehensive thereby generating limited amount of useful data [4]. This precludes the application of data intensive techniques such as neural networks or multiple regressions for performance prediction [5]. Vaguely known polymer parameters add further complexity to this non-linear problem. For example, the actual values of C and M are seldom known as manufacturers only provide their ranges [6]. Although D is known within experimental error, the adsorbed polymer amount is always uncertain and the resulting discrepancy is not quantifiable [2]. Therefore, there was an exigent need to develop a conceptual model with the following features: (a) independent of test results; (b) based on the opinion of experts with reasonable process understanding; (c) captures the vagueness and uncertainty in polymer parameters; and (d) sufficiently robust to predict the intricate colloid-water-polymer interactions. These requirements could be addressed by adopting a fuzzy rule-based modeling approach that translates qualitative information into numerical interpretation using linguistic reasoning.
Based on the geotechnical understanding of hindered sedimentation, this interdisciplinary paper presents a conceptual fuzzy rule-based model to evaluate the settling rate of a typical laterite ore slurry modified with synthetic polymers. Expert opinion from the mining and the chemical industry was used to develop the model by establishing fuzzy if-then rules. Thereafter, the model was trained and validated using data from bench-scale settling tests. Finally, sensitivity analyses were performed to delineate the relative significance of polymer parameters on the settling rate of laterite ore slurries.
2. Geotechnical Phenomenology
Figure 1 gives the results of bench-scale settling test in the form of solid-liquid interface height versus time for a typical laterite ore slurry [7]. The initial rapid decrease in interface height, known as hindered sedimentation, refers to the settling of a spatial network of soil particles without measurable effective stresses [8]. The swift slurry settling gradually decreased with time as the material acquired a soil-like character. This stage of slurry settling is known as self-weight consolidation and commences when the solid grains are in contact thereby transmitting effective stresses [9]. The slurry exhibited a smooth transition between the two distinct settling regimes. The slope of the initial straight-line portion of the settling curve that represents hindered sedimentation was used to determine the initial hydraulic conductivity (ki) as follows [10]:
w s i w s i γ _γ ) e ( γ V k = 1+ (1)
The ki of laterite ore slurry without polymers measured 0.124 cm/sec. This corresponds to a median settling rate for such heavy materials and must be improved using polymers [7].
0 300 600 900 1200 1500 1800 Elapsed Time (sec)
2 3 4 5 6 7 8 9 10 Int er face H eig h t ( c m) H ind er ed S ed im en ta tio n Self-Weight Consolidation Settling velocity, Vs from This Chart:
_________ 8.5 cm Cylinder, Vs = 0.0142 cm/sec
__ __ __9.5 cm Cylinder, Vs = 0.0140 cm/sec
Average, Vs = 0.0141 cm/sec
Geotechnical Index Properties:
Unit weight of soils solids, γs = 3.15 g/cm3
Unit weight of water, γw = 1.00 g/cm3
Specific gravity, Gs = γs / γw = 3.15
Initial water content, wi = 567%
Initial void ratio, ei = wi Gs = 17.85
Initial Hydraulic Conductivity, ki = 0.124 cm/sec
3. Theoretical Background
Fuzzy numbers describe imprecise information by correlating an uncertain quantity (x) with a membership function (µ(x)) defined over [0,1] interval. The relationships are represented by if-then rules of the form “If antecedent proposition if-then consequent proposition”. In a linguistic model, the rule (Ri) can be written as follows [11]:
Ri: If x is Ai then y is Bi; i = 1, 2…K (2)
Input (x) and output (y) are linguistic variables whereas Ai and Bi are linguistic constants. The truth-value (real number) of the propositions depends on similarity between variables and constants. Collectively, the rules and the constants form the knowledge base of the model. To restrict the simultaneous occurrence of x and y, the fuzzy conjunction (Ai ∧ Bi) is computed by a minimum operator (t-norm) on the Cartesian X-Y product space for all possible (x, y) as follows:
Ri = Ai× Bi, that is, µRi (x, y) = µAi (x) ∧ µBi (y) (3)
The fuzzy relation R represents the entire model and is given by the disjunction (union or maximum, that is, s-norm) of the K individual relations of the Ri rule as follows:
R = , that is,µ ( , ) max
[
µ ( ) µ ( ) (4)1 1 y x y x R Ai Bi K i R K i i ∧ = ≤ ≤ = U
]
]
For an input fuzzy value x = A′, an output value B′ is given by the following composition:
[
µ ( ) µ ( , ) max ) ( µ ' y A' x R x y X B = ∧ (5)After substituting µR (x, y) from Eq. (4) and rearranging, the above expression is as follows:
[
]
(
maxµ ( ) µ ( ) µ ( ))
max ) ( µ ' 1 ' y A x Ai y Bi y X K i B = ∧ ∧ ≤ ≤ (6)Denoting β max
[
µA'(x) µAi(y) is the degree of fulfillment of the iX
i = ∧
]
]
th
rule antecedent, the resulting output fuzzy set of the linguistic model is of the following form:
[
β µ ( ) max ) ( µ 1 ' y i Bi y K i B = ∧ ≤ ≤ (7)The fuzzy set defuzzification using the quality ordered weights (wl) yields a crisp output (Yimod). Denoting l as the number of output granules, µB’l (y) as the output membership for each granule (Eq. 7), and Bol as the respective crisp values, defuzzification is done as follows [12]:
l m l l O l B i y B w Y = ∑ × × =1 ' ) ( µ mod (8) The model is fine-tuned on test data to determine wl. This training is done by linear optimization of mean absolute error (MAE) that is defined by an objective function, min[abs(Yiobs–Yimod)/n], where Yiobs is observed value, Yimod is modeled value (Eq. 8), and n is number of observations.
4. Initial Hydraulic Conductivity Modeling
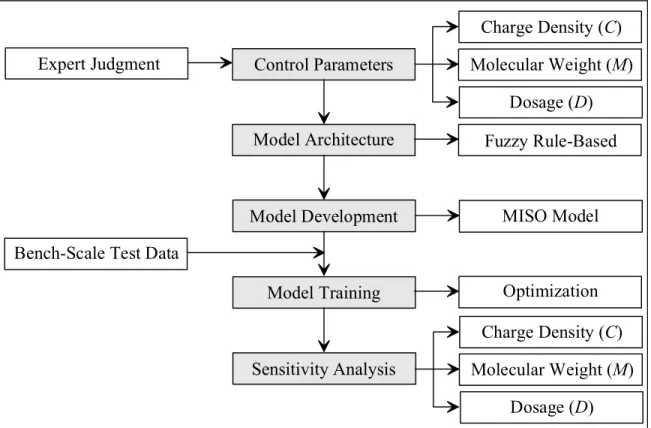
Figure 2 gives a conceptual framework for ki modeling of polymer-modified laterite ore slurries. The identification of input parameters (C, M, and D) and the selection of model architecture (fuzzy rule-base) were based on extensive consultations with the mining and the chemical industries. A multiple inputs-single output (MISO) model was developed for ki prediction. The model was trained on the bench-scale settling test data by linear optimization. Rank correlation coefficient-based sensitivity analyses were performed to identify the percent contribution of input parameters in ki variability.
Expert Judgment
Bench-Scale Test Data
Fuzzy Rule-Based MISO Model Optimization Charge Density (C) Molecular Weight (M) Dosage (D) Charge Density (C) Molecular Weight (M) Dosage (D) Control Parameters Model Architecture Model Development Model Training Sensitivity Analysis
Figure 2: Conceptual framework for ki modeling
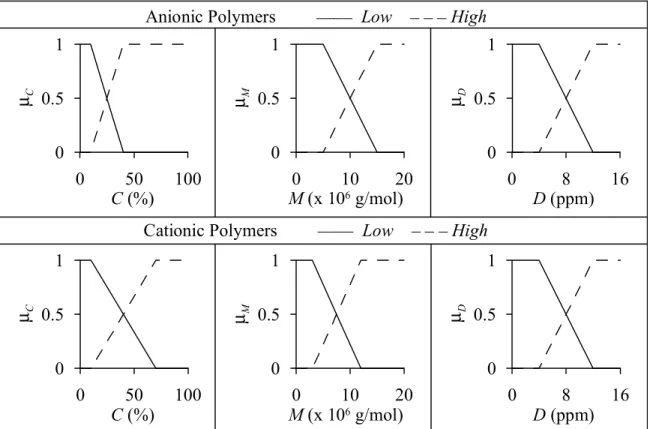
Figure 3 gives the model inputs (C, M, and D) defined as linguistic constants (triangular fuzzy numbers, TFN). These control parameters used two granules (Ai) of low and high for both anionic and cationic polymers. The variation in C and M among the two polymer types indicates the variability during their commercial-scale production [6]. These uncertainties led to a higher level of uncertainty in the amount of adsorbed polymer at a given D. The granule definitions captured the ki uncertainty associated with different combinations of the investigated input parameters.
0 50 100 C (%) 0 0.5 1 µC 0 50 100 C (%) 0 0.5 1 µC 0 10 20 M (x 106 g/mol) 0 0.5 1 µM 0 10 20 M (x 106 g/mol) 0 0.5 1 µM 0 8 16 D (ppm) 0 0.5 1 µD 0 8 16 D (ppm) 0 0.5 1 µD
Anionic Polymers ____ Low _ _ _ High
Cationic Polymers ____ Low _ _ _ High
Figure 3: Model inputs in the form of linguistic constants
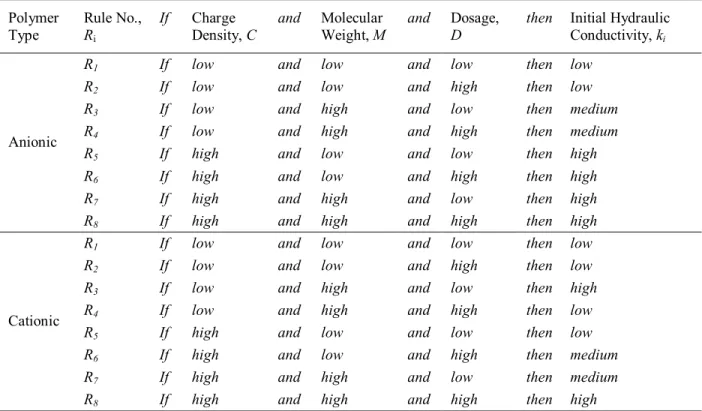
Table 1 summarizes the rule-base for the conceptual model. The rules were of the following general form (extension of Eq. 2 for MISO models):
Ri: If x1 is A1i and x2 is A2i and…and xp is Api then y is Bi i = 1, 2...K (9)
The ranges of linguistic constants were assigned based on the anticipated data uncertainty. Rule 1 interprets that if charge density, molecular weight, and dosage are low, then initial hydraulic conductivity is low. This output is the same for Rule 2 despite the use of a high D; C and M remain unaltered. The variation among rules for anionic and cationic polymers was due to their variable interactions with the slurry [3].
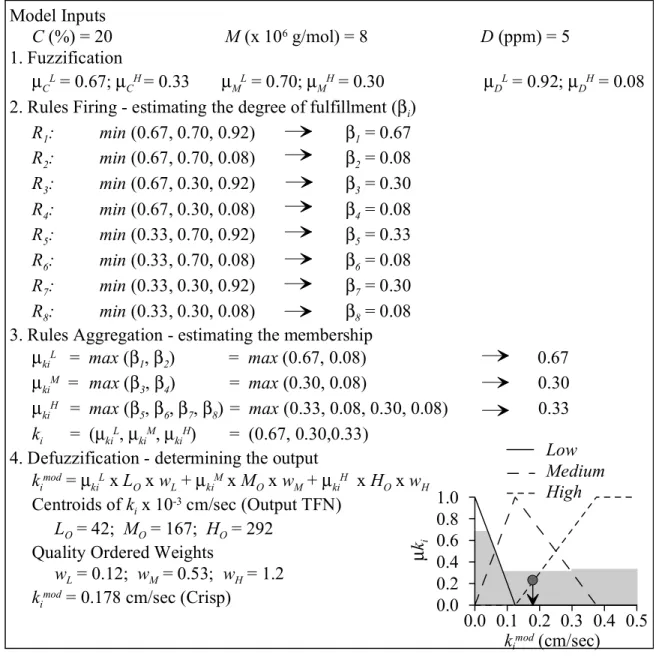
Figure 4 outlines the ki model for anionic polymers with assumed C, M, and D. The various steps including fuzzification, estimating degree of fulfillment, rules aggregation, and defuzzification are described to make an inference from the model. In this example, model inputs: C = 20, M = 8, and D = 5 were fuzzified on their respective scales (Figure 3). All rules were fired and their degrees of fulfillment (βi) were obtained. By aggregating the rules using Eq. 6, memberships (µki) for low, medium, and high output fuzzy numbers were estimated to be 0.67, 0.30, and 0.33, respectively; the memberships represented the heights of the output granules. A crisp output (kimod) of 0.178 cm/sec was obtained by defuzzification (Eq. 8).
Table 1: Rule-base for the model Polymer Type Rule No., Ri If Charge Density, C and Molecular Weight, M and Dosage, D
then Initial Hydraulic Conductivity, ki
R1 If low and low and low then low
R2 If low and low and high then low
R3 If low and high and low then medium
R4 If low and high and high then medium
R5 If high and low and low then high
R6 If high and low and high then high
R7 If high and high and low then high
Anionic
R8 If high and high and high then high
R1 If low and low and low then low
R2 If low and low and high then low
R3 If low and high and low then high
R4 If low and high and high then low
R5 If high and low and low then low
R6 If high and low and high then medium
R7 If high and high and low then medium
Cationic
R8 If high and high and high then high
The model was trained on the data comprising of 16 bench-scale settling tests for anionic polymers; test results are given later in this paper. While the data was limited for robust training, it was sufficient to develop a conceptual model that incorporated both subjective (expert judgment) and objective (test data) information and that can be improved with additional data. The training was conducted by solving the objective function, that is, by minimizing MAE. This allowed the determination of the quality ordered weights (wl). The constraints on wl were heuristically defined as 0.1 ≤ wL ≤ 0.4, 0.5 ≤ wM ≤ 1, and 1.5 ≤ wH ≤ 2. Using the optimized quality ordered weights of wL = 0.12, wM = 0.53, and wH = 1.2 for defuzzification, the trained model utilized both expert judgment and bench-scale settling test data.
Sensitivity analyses were used to understand the relative significance of input parameters on the model output and to quantify the change in output due to input variability. To estimate the contribution of each input parameter to the output variance, rank correlation coefficients were determined. These coefficients estimated the degree of association between two random variables and linearly correlated model inputs and output. From the ranges defined in Table 1, the input parameters (C, M, and D) were randomly generated assuming uniform distributions. The random values of the input parameters were fuzzified and subsequently inferenced using the rule-based algorithm explained earlier. Likewise, the crisp model outputs were ranked.
0.0 0.2 0.4 0.6 0.8 1.0 µ ki 0.0 0.1 0.2 0.3 0.4 0.5 kimod (cm/sec) Model Inputs C (%) = 20 M (x 106 g/mol) = 8 D (ppm) = 5 1. Fuzzification µCL = 0.67; µCH = 0.33 µML = 0.70; µMH = 0.30 µDL = 0.92; µDH = 0.08
2. Rules Firing - estimating the degree of fulfillment (βi)
R1: min (0.67, 0.70, 0.92) β1 = 0.67 R2: min (0.67, 0.70, 0.08) β2 = 0.08 R3: min (0.67, 0.30, 0.92) β3 = 0.30 R4: min (0.67, 0.30, 0.08) β4 = 0.08 R5: min (0.33, 0.70, 0.92) β5 = 0.33 R6: min (0.33, 0.70, 0.08) β6 = 0.08 R7: min (0.33, 0.30, 0.92) β7 = 0.30 R8: min (0.33, 0.30, 0.08) β8 = 0.08 3. Rules Aggregation - estimating the membership
µkiL = max (β1, β2) = max (0.67, 0.08) 0.67 µkiM = max (β 3, β4) = max (0.30, 0.08) 0.30 µkiH = max (β 5, β6, β7, β8) = max (0.33, 0.08, 0.30, 0.08) 0.33 ki = (µ kiL, µkiM, µkiH) = (0.67, 0.30,0.33)
4. Defuzzification - determining the output kimod = µ
kiL x LO x wL + µkiM x MO x wM + µkiH x HO x wH
Centroids of ki x 10-3 cm/sec (Output TFN)
LO = 42; MO = 167; HO = 292 Quality Ordered Weights
wL = 0.12; wM = 0.53; wH = 1.2 kimod = 0.178 cm/sec (Crisp)
Low Medium High
Figure 4: Model outline for anionic polymers
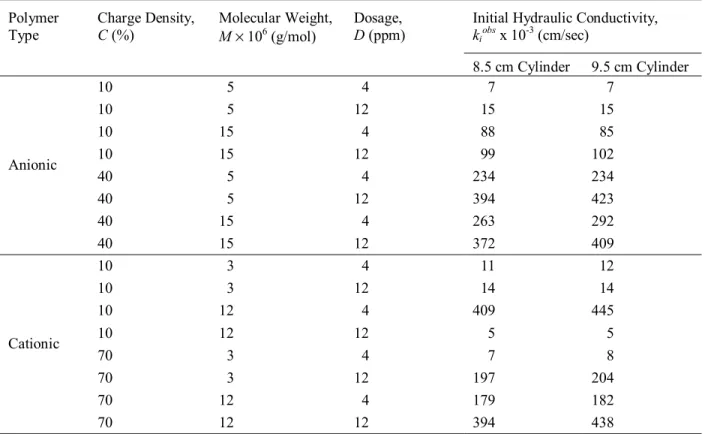
4. Data Collection
Table 2 gives the average values of polymer parameters and bench-scale settling test data. Based on 24 factorial design, C, M, and D were tested at two levels for the acrylamide-based anionic and cationic polymers, provided by Ciba Specialty Chemicals Inc., Canada. The low and high polymer dosages corresponded to 4 mg/L (53 g/ton) and 12 mg/L (159 g/ton), respectively, based on dry mass of polymer and solids in the slurry. Two sets of test data were obtained for improved accuracy. A fresh concentrated stock solution was prepared for each test by dissolving the polymers in distilled water. To preclude the effect of polymer aging, this solution was instantly diluted to a test solution and immediately used.
Table 2: Average values of polymer parameters and bench-scale settling test data
Initial Hydraulic Conductivity,
kiobs x 10-3 (cm/sec) Polymer Type Charge Density, C (%) Molecular Weight, M × 106 (g/mol) Dosage, D (ppm) 8.5 cm Cylinder 9.5 cm Cylinder 10 5 4 7 7 10 5 12 15 15 10 15 4 88 85 10 15 12 99 102 40 5 4 234 234 40 5 12 394 423 40 15 4 263 292 Anionic 40 15 12 372 409 10 3 4 11 12 10 3 12 14 14 10 12 4 409 445 10 12 12 5 5 70 3 4 7 8 70 3 12 197 204 70 12 4 179 182 Cationic 70 12 12 394 438
The stock solution was prepared by weighing 0.5 g of dry powdered polymer in a clean dry 250 mL beaker. Then, 1 mL of methanol (for anionic polymers) or acetone (for cationic polymers) was added as the powder was swirled for an even distribution. Next, 99 mL of distilled water was added and a magnetic stirrer rod was immersed in the beaker. The beaker containing the above ingredients was put on a stirring machine for 1 hour at a moderate speed of 12 rpm. Finally, the stock solution was diluted to 0.05% test solution for dosing by adding 10 mL of the former to 90 mL of distilled water. Thus, 1 mL of the test solution contained 0.5 mg of dry polymer. When divided by the total volume of the slurry (L), this gave the amount of 1 mL of test solution in the slurry in mg/L. To get the polymer dosage volume (in mL), the desired amount in mg/L of slurry was divided by the amount of dry polymer in 1 mL of the test solution.
Test samples were prepared by mixing the required dosage from the test solution with the known volume of the slurry at 15% initial solids concentration (by weight). The desired polymer volume was introduced to the slurry by a graduated plastic syringe. To minimize floc breakage, ingredients were mixed using a steel plunger that was rotated at a rate of 12 rpm for 5 minutes. The slurry was poured into the graduated cylinder up to a known height (8.5 cm and 9.5 cm) and was allowed to settle under gravity. The solid-liquid interface movement was captured at equal
time intervals using a camcorder with macro lenses for up to 7 times image magnification. The camcorder was connected to a computer that stored the captured frames in a digital format. After test completion, the enlarged digital frame files were carefully viewed and the observed data were recorded as interface height versus time; ki was determined as explained in Figure 1.
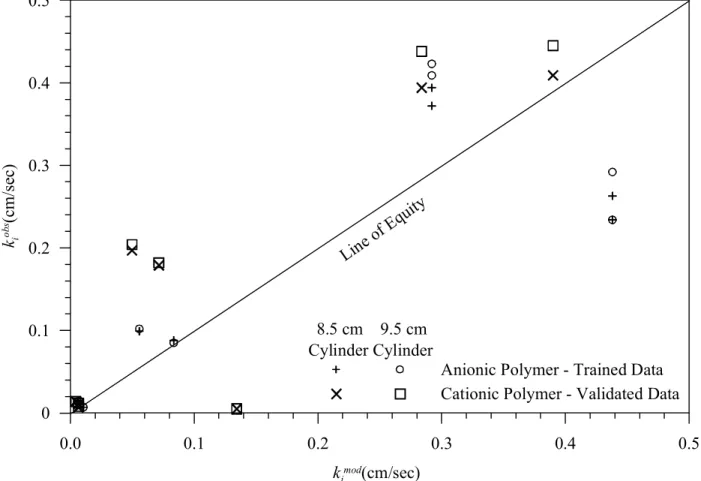
5. Results and Discussion
Figure 5 gives the results of model training and validation by plotting the observed test data as a function of the predicted model data. The coefficient of determination (R2) estimated 0.75 for the available data. The discrepancy in the predicted and the observed ki values is primarily attributed to the limited amount of test data used for model training. The scatter can be decreased with increasing the number of training data. Further, the difference between the two tests (using 8.5 cm cylinder and 9.5 cm cylinder) on the same materials was more pronounced at high ki (Table 2). This is attributed to the limited number of available data points in the initial straight-line part of the settling curves for the fast moving slurries. The associated observational error can be minimized by using automated digital sensors during testing.
0.0 0.1 0.2 0.3 0.4 0 ki mod(cm/sec) .5 0 0.1 0.2 0.3 0.4 0.5 ki ob s(cm/s ec) Line of E quity
Anionic Polymer - Trained Data Cationic Polymer - Validated Data 8.5 cm 9.5 cm
Cylinder Cylinder
The main source of repeatable experimental error was polymer addition and mixing with the slurry that was undergoing self-weight settling. The resulting turbidity and eddies offered difficulty in deciphering the solid-liquid interface movement. In the absence of a distinct interface, observational bias marginally contributed in overestimating the settling rate. Figure 5 illustrates that most of the observed data plotted on or above the line of equity. The bias associated with such systematic errors can be minimized by adding the polymers with the slurry stream prior to settling [4].
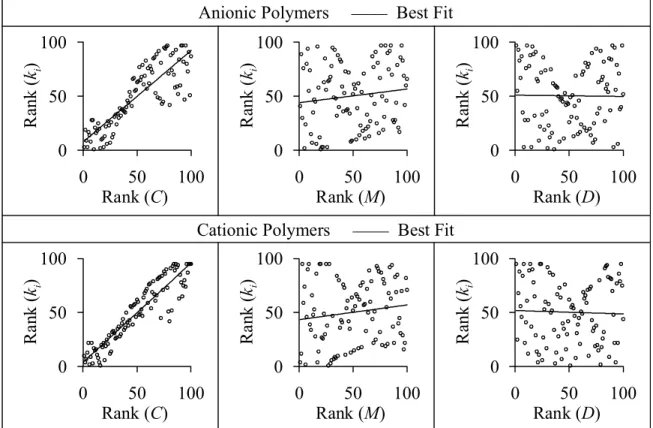
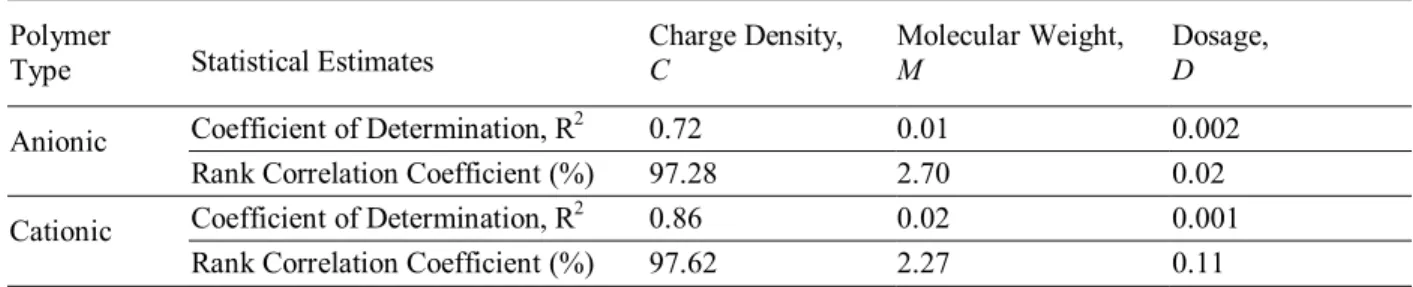
Figure 6 gives the ranks of C, M, and D plotted against the ki ranks thereby determining the rank correlation coefficients. The output variability was used to determine the percent contribution of each input parameter using the method described in [5]. Table 3 summarizes the statistics for sensitivity analyses based on the model. The scatter in the generated data was lowest for C followed by M and then by D. The highly significant input parameters showed trends, which account for variability in the output. For both anionic and cationic polymers, C was the most significant factor accounting for more than 97% of variability in the output estimates. Followed by M and then by D, this predominance of polymer charge density on the settling rate of laterite ore slurry was expected.
0 50 100 Rank (C) 0 50 100 R ank ( ki ) 0 50 100 Rank (M) 0 50 100 R ank ( ki ) 0 50 100 Rank (D) 0 50 100 R ank ( ki ) 0 50 100 Rank (C) 0 50 100 Ra n k ( ki ) 0 50 100 Rank (M) 0 50 100 Ra n k ( ki ) 0 50 100 Rank (D) 0 50 100 R ank ( ki )
Anionic Polymers ____ Best Fit
Cationic Polymers ____ Best Fit
Table 3: Summary statistics of sensitivity analyses
Polymer
Type Statistical Estimates
Charge Density, C Molecular Weight, M Dosage, D Coefficient of Determination, R2 0.72 0.01 0.002 Anionic
Rank Correlation Coefficient (%) 97.28 2.70 0.02
Coefficient of Determination, R2 0.86 0.02 0.001
Cationic
Rank Correlation Coefficient (%) 97.62 2.27 0.11
The solids of the slurry were primarily iron oxides (goethite, hematite, and maghemite) and clay minerals (kaolinite and chlorite) whereas the water was at a pH = 7.0 having very low electrolyte concentration [7]. This composition allowed both anionic and cationic polymers to interact with the slurry. The negatively charged anionic polymers were attracted to the positively charged iron oxide surfaces whereas the positively charged cationic polymers were attracted to the negatively charged clay surfaces [1]. In both cases, the slurry was usually flocculated and the flocs settled at relatively higher velocities under self-weight thereby increasing ki of the material. The type of flocculation depended on bond strength and floc size [13].
The charge density of a polymer refers to the number of unsatisfied charges on the polymer chain. Synthetic polymers with high C resulted in a stronger overall bond between the polymer and the colloid because the polymer could get attached to a single colloid at many points along its length [14]. Likewise, a single high C polymer was able to get bonded to a number of laterite particles thereby increasing the floc size. The same high C was responsible for holding the large size flocs intact. Conversely, strong bonds and large floc sizes were not formed when low C polymers were added to the ore slurry. Therefore, polymer charge was the most significant parameter in improving ki of laterite ore slurries.
The molecular weight pertains to the total chain length of a polymer made up of an assemblage of a large number of the basic building block called a monomer [6]. The actual dimensions of ionic polymers in a slurry of known composition increase with charge density as high intra-molecular charge repulsions of the polymer chain tend to unfold the solvated coils [13]. The contribution of polymer molecular weight depends on charge density and is considered to be embedded in the later. Therefore, a good correlation of ki was not obtained for polymer molecular weight.
Flocculation of laterite ore slurries depends on the type of adsorbed conformation of the polymer chains. At low dosages, each polymer chain is grafted onto a colloid by one segment
leading to a mushroom conformation. Conversely, the chains overlap and stretch out perpendicular to the colloid at high dosages thereby adopting the brush conformation. An optimum dosage is one at which the polymer chain is flat enough to be bonded to a colloid at more than one points but still precludes chain interference. The polymer chain at the optimum dosage assumes a pancake conformation. These conformations depend on the charge density and the molecular weight of the polymer used [14]. In this study, the term polymer dosage (D) was used to quantify the amount of polymer added to the slurry because the actual amount of polymer adsorbed onto the colloidal surfaces could not be determined. The bench-scale settling tests were conducted using the limiting values of the range of dosages (4 ppm and 12 ppm) but an optimum dosage for each combination of C and M was not determined.
Good correlations for M and D were not obtained because of the limited bench-scale settling test data. The relative significance of M and D on the settling rate of laterite ore slurry was considered to be part of C. The fuzzy rule-based technique adopted in this study, conceptually modeled the well-known parts of the process through expert judgment whereas the remaining less-known parts were predicted using sensitivity analyses. The model can be improved by conducting a large number of tests at constant values of C and by varying M and D over practical ranges. A comprehensive model should also include the composition of the solid and the liquid phases of the slurries as input parameters. Further, the fuzzy rule-based model developed in the current study can be modified for other material types.
6. Summary and Conclusions
The self-weight settling rate of laterite ore slurries is improved by adding synthetic polymers. The charge density, molecular weight, and dosage of the polymers are the key factors influencing the settling rate of soil slurries. This interdisciplinary paper used the geotechnical understanding of hindered sedimentation for a mining engineering application. A conceptual fuzzy rule-based model was developed to evaluate the initial hydraulic conductivity of polymer-modified laterite ore slurries. Based on expert judgement, the model correlated well with bench-scale settling test data and the predicted ki of polymer-added laterite ore slurry gave an R2 = 0.75. Rank correlation coefficient-based sensitivity analyses indicated that charge density was the most significant polymer parameter followed by molecular weight and then by dosage. Charge density accounted for more than 97% of variability in the ki estimates for both anionic and cationic polymers. The predictions and the associated ranks of the conceptual model can be improved by increasing the number of test data for model training.
Acknowledgements
The authors are grateful to Dynatec Corporation and Ciba Specialty Chemicals for providing expert judgement and materials. Thanks to the University of British Columbia and the National Research Council of Canada for providing computing facilities.
References
[1]. Georgio D. Papangelakis, VG. Sulfuric acid pressure leaching of a limonitic laterite: chemistry and kinetics. Hydrometallurgy. 1998. 49:23-46.
[2]. Azam S. Thickening of mine waste slurries. Geotechnical News. 2004. 22(4):40-43.
[3]. Azam S. Solid-Liquid Separation of Laterite Slurries. PhD Dissertation. University of Alberta, Edmonton, Alberta, Canada. 2003.
[4]. Xu Y, Hamza H. Thickening and disposal of oil sand tailings. Mining Engineering. 2003. 55(11):33-39.
[5]. Yager RR, Filev DP. Essentials of Fuzzy Modeling and Control. John Wiley & Sons Inc., New York, USA. 1994.
[6]. Masahiro O, Masataka T. Quality control of polymer production processes. Journal of Process Control. 2000. 10(2):135-148.
[7]. Azam S, Chalaturnyk R, Scott JD. Geotechnical characterization and sedimentation behavior of laterite slurries. Geotechnical Testing Journal. 2005. 28(6):523-533.
[8]. McRoberts EC, Nixon JF. A theory of soil sedimentation. Canadian Geotechnical Journal. 1976. 13:294-310.
[9]. Terzaghi K, Peck RB, Mesri G. Soil Mechanics in Engineering Practice. 3rd edn. John Wiley & Sons Inc. New York. USA. 1996.
[10]. Pane V, Schiffman RL. The permeability of clay suspensions. Geotechnique. 1997. 47(2):273-288.
[11]. Zadeh LA. Fuzzy logic – computing with words. IEEE Transactions – Fuzzy Systems. 1996. 4(2):103-111.
[12]. Mamdani EH. Application of fuzzy logic to approximate reasoning using linguistic synthesis. IEEE Transactions on Computers. 1977. C-26(12):1182-1191.
[13]. Hogg R. Polymer adsorption and flocculation. In: Proceedings, 38th Annual Conference of Metallurgists of CIM: Polymers in Mineral Processing.1999. 3-18.
[14]. Farinato RS, Huang SY, Hawkins P. Polyelectrolyte assisted dewatering. Colloid-Polymer Interaction-From Theory to Practice. 1999. John Wiley & Sons Inc. New York, USA.
![Figure 1 gives the results of bench-scale settling test in the form of solid-liquid interface height versus time for a typical laterite ore slurry [7]](https://thumb-eu.123doks.com/thumbv2/123doknet/14176186.475384/5.918.109.811.581.1064/figure-results-settling-liquid-interface-height-typical-laterite.webp)