BENDING MODE ACCELERATION INFLUENCE ON PILOT CONTROL OF FLEXIBLE
BOOSTER DYNAMICS
by
PHILIP S. KILPATRICK
A.B., Carleton College (1964)
S.B., Massachusetts Institute of Technology (1964)
SUBMITTED IN PARTIAL FULFILLMENT OF THE REQUIREMENTS FOR THE DEGREE OF MASTER OF SCIENCE
at the
MASSACHUSETTS INSTITUTE OF TECHNOLOGY September 1965
Signature of Author
Depaitment rof Aeronautics and ronautics tember 1965
Certified by
Accepted by
ProfesoLaurence' R.LfingTIesis Supervisor
I
I
BENDING MODE ACCELERATION INFLUENCE ON PILOT CONTROL OF FLEXIBLE
BOOSTER DYNAMICS by
Philip S. Kilpatrick
Submitted to the Department of Aeronautics and Astronautics, Massachusetts Institute of Technology, on September 30, 1965, in partial fulfillment of the requirements for the degree of Master of Science.
ABSTRACT
This investigation is concerned with the general problem of man's ability to directly control a large flexible launch vehicle. Specifically, the effect of a flexible body mode on pilot control of simulated single axis Saturn V rigid body dynamics is studied. First bending mode amplitude and natural frequency, and the type of simulation, fixed
or moving base, are the variables considered most intensively. Brief studies of variations in the RMS level of the disturbance signal and comparisons of two proposed control stick filters and vehicle augmentation schemes are included.
The effects of the flexible mode on the pilot and his closed loop performance are analyzed by ratios of attitude error to disturbance signal and control stick output to attitude error, and by computed pilot transfer functions.
Results show that pilot ' s sability to generate le.ad. -com-pensation and to control the attitude error decreased as
the bending mode amplitude increased. Significant deteriora-tion occurred at the lowest bending mode amplitude, 1/3
the value at the proposed location of the Saturn V attitude gyro, under study. The pilot's gain and ability to control the attitude error decreased during the moving base experi-ments. This result is attributed to dynamics and
non-linearities associated with the simulator, a less sensitive moving base display, and possibly vestibular uncertainty.
and insensitivity concerning small deflections from the vertical. With increasing bending mode amplitude, pilot performance deteriorates at approximately the same rate for both w = 5 and 7 rad/sec. However, for a given amplitude,n ge 5 rad/sec bending mode generates only one-half the acceleration of the 7 rad/sec bending mode.
Thesis Supervisor: Laurence R. Young
ACKNOWLEDGEMENTS
The author wishes to thank Professor L. R. Young, his thesis advisor, for stimulating initial interest in the problem and for offering guidance throughout the research. Professor J. L. Meiry's instructions concerning operation of the Man-Vehicle Control Laboratory's NE-.2 Motion
Simulator and assistance with digital computer aspects of the data analysis are gratefully acknowledged.
Mr. Ernest Silagyi prepared the computer program to trans-form data from analog to digital trans-form.. This work was
completed on the Electrical Engineering Department's TX-O Computer.
The M.I.T. Computation Center granted time on its IBM 7094 Computer for work done as Problems M4345 and M4347.
The author also expresses his thanks to Miss Toni Mello for typing the thesis.
TABLE OF CONTENTS
Page No.
Introduction
Simulation and Equipment Procedure Discussion of '.Results Conclusions
1
6 12 16 30 Appendix A Appendix BDerivation and Simplification of Simulation Equations
Pilot Describing Fundtion Measure-ment Tecilnique Bibliography Fig. Fig. 2 Fig. 3 Fig. 4 Fig.
33
42
45
General block diagram for the
man-booster control problem. 46
Block diagram for the man-booster control problem showing components used in this investigation. 47 Analog computer patching program
for fixed base experiments. 48 Analog computer patching program
for moving base experiments. 49 Analog computer patching program
for a modified version of the
augmented dynamics and stick 50 filter recommended by Jex and Teper. 5
Chapter
Chapter
Chapter
Chapter
Chapter
IV
II
III
Iv
V
Fig. 6
Fig. Fig.
7 8
Analog computer patching program used to shape the spectrum of the disturbance* signal.
NE-2 motion simulator.
Fixed and moving base control stick characteristics.
Block diagram showing control systems signals recorded on strip chart and tape recorders. Subject position and equipment
location for fixed base experiments,. Subject position, control stick,
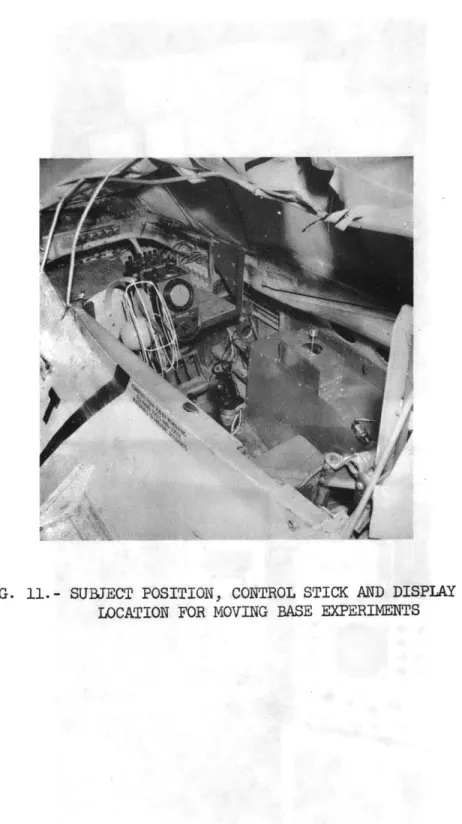
and display location for moving base experiments.
Analog computer patching program for integral square error calculations. Strip chart recordings of attitude error
Strip chart recordings of pilot respohse'
Transfer function data for fixed base s-!ssion, w nbd = 5 rad/sec.
Transfer function data for fixed base session, wnbd = 7 rad/sec.
Transfer function data for moving base session, wnbd = 7 rad/sec..
Transfer function data for moving base session, wnbd = 5 rad/sec.
Plot of amplitude ratio data from Table Plot of amplitude ratio data from Table Plot of amplitude ratio data from Table Plot of amplitude ratio data from Table Plot of phase data from Table 1.
Fig. 9 Fig. 10 Fig. 11 Fig. 12 Fig. 13 Fig. 14 Table 1 Table 2 Table 3 Table 4 51 52 53 54 55 56 57 58 59 60 61 62 63 64 65 66 67 68 Fig. Fig. Fig. Fig. Fig. 15 16 17 18 19
1.
2. 3.. 4, /Page No. Fig. 20 Plot of phase data from Table 2 69 Fig. 21 Plot of phase data from Table 3 70 Fig. 22 Plot of phase data from Table 4 71 Table 5 Summary of fitted describing
functions 72
Table 6 Attitude error and pilot response power spectrum for fixed base
session,
w
nbd = 5 rad/sec. 73 Table 7 Attitude error and pilot responsepower spectrum for fixed base
session,
w
nbd = 7 rad/sec 74 Table 8 Attitude error and pilot responsepower spectrum for moving base
session,
w
nbd = 7 rad/sec 75 Table 9 Attitude error and pilot responsepower spectrum for moving base
session, w nbd = 5 rad/sec 76 Fig. 23 Plot of control stick power from
Table 6 77
Fig. 24 Plot of control stick power from
Table 7 78
Fig. 25 Plot of the RMS ratio
versus bending mode amplitude for fixed base plus simulated dynamics
experiments. 79
Fig. 26 Individual tracking run
scores versus bending mode ampli-tude for each subject under fixed
base,w
nbd
=7 rad/sec conditions 80 Table 10 Analysis of variance results forFig. 26 81
Fig. 27 Plot of results versus bending mode amplitude for each
Page No.
Fig. 28 Plot of averaged /Ve-V/
results versus bending mode amplitude for each type of
simulation at wnbd = 5 rad/sec 83 Fig. 29 Comparison of/f
results for wbd - 5 and 7 rad/sec
during fixed base conditions 84 Fig. 30 Comparison
of/Ej-results for wng = 5 and 7 rad/sec during moving base conditions 85 Fig. 31 Comparison of
V7/-results for wnd~ = 5 and 7 rad/sec during fixed base plus simulator
dynamics conditions 86
Fig. 32 Plot of /Vs1/ results versus bending mode amplitude for
condi-tions of low RMS disturbance signal 87 Fig. 33 Plot of /'/'results versus
bending mode amplitude for
condi-tion of low RMS disturbance signal 88 Fig. 34 Comparison of /i2-/X2 results
for the two disturbance signals with
Wnbd
= 7 rad/sec 89Fig. 35 Comparison of v'D//-%
results for the two disturbance
signals with w nbd = 5 rad/sec 90 Fig. 36 Effective dynamics as seen by pilot
for simplified versions of two pro-posed vehicle augmentation and
control stick filter schemes 91 Table 11 Summary of results comparing the
two proposed vehicle augmentation
and control stick filter schemes 92
Fig. Al Root locus 1 93
Root locus 2
LIST OF SYMBOLS
Partial derivatives of the force on the missile with respect to a, a, 0,
respectively.
Partial derivatives of the moment on the
missile with respect to a and a respectively. Pitch angle of attack.
Engine gimbal angle,
Total pitch attitude angle with respect to nominal trajectory
Part of 0tot due to the rigid body mode-Part of, 0tot due to the flexible bpdy mode,
V
Wnrb LA = 3w z nbd Ki 1 K21 K3 1 K KrlNominal vehicle velocity.
Natural frequency of the rigid body mode, Natural frequency of the bending mode. Location of the zeroes associated with
the first bending mode
Constants associated with the bending mode.
Constant proportional to the amplitude of the bending mode
Root locus gain tot
$rb $bd
qi p. p ISE d (t)
e (t)
s (t)
o (t)0
Mn
I
nom.the first bending mode.
ith zero in transfer function. ith pole in transfer function.
LaPlace operator.
Integral squared error.
aisturbance signal into the control loop. Displayed attitude error.
Operator's response.
Output of simulated missile dynamics. RMS ratio of the attitude error to
disturbance signal for one tracking run. The same ratio averaged over several tracking runs.
RMS ratio of the pilot response to attitude error for one tracking run. The same ratio averaged over several tracking runs.
The amplitude of the bending mode at the proposed location of the Saturn V attitude gyro.
INTRODUCTION
Several relatively recent studies have been conducted to determine the feasibility of using a pilot to control
the attitude and trajectory of large flexible boosters during the launch into orbit. Along with other problems, these
investigations considered the ability of the pilot to effec-tively control the unstable rigid body mode without exciting the relatively low frequency and highly sensitive
bend-ing mode beyond structural or attitude limitations. Hardy, et al, simulated the rigid and flexible body dynamics of the Saturn V booster and report that the visual and vestibular cues from flexible motions did not create serious problems.1 However, they obtained these resnlts using a second order low pass filter to attenuate the high frequency components of the control stick output.
In a theoretical study, Teper and Jex agree that it would be possible for the pilot to directly control the missile, but recommend, among other things, replacing the second order stick filter with a single integration. 7
In either case, stick filters reduce the bending mode effect at the cost of additional phase lag in series with an already difficult set of missile dynamics.
sively the effect of a superimposed bending mode on the pilot's ability to control the single axis attitude of a missile with unstable rigid body dynamics. Hopefully, in spite of the restrictions to a particular set of rigid body dynamics, the results will be applicable to other missiles and large air-craft with significant flexible mddes.
The importance of the bending mode depends on many
control system parameters and pilot characteristics. However, the relative natural frequencies of the two modes, the
amplitude of the bending mode, and the type of simulation, fixed or moving base, were considered the most important, and attention was directed primarily at these factors.
In general, the interaction between two modes in a feedback control system increases as the separation between the natural frequencies decreases. In this situation, there will be a direct relation between the degree of excitation of the bending mode and the frequency content of the control
stick signal. In turn, this frequency content will be deter-mined partly by the difficulty of the rigid body control task
assigned to the pilot.
The simulated system dynamics included the dominant inverted pendulum rigid body mode of the Saturn V at peak dynamic pressure W
nrb
b = .15, and the first bending mode. Bending mode frequencies of nd = 49 (rad/sec)2 and 25 (rad/sec)2 were studied. The first bending mode natural frequency of the Saturn V at maximum dynamic pressure equals2
to the pilot control frequencies chosen for the second frequency.
For a given natural frequency, the flexible mode accelera-tion sensed by the pilot is proporaccelera-tional to the mode amplitude. An amplitude approximately equal to that sensed at the proposed attitude gyro station for the Saturn V was taken as a nominal value. Three other amplitudes, (0, .33 nom., and 2.0 nom.), were studied in the fixed base experiments. A wider
range, (0 to 4.0 nom), were used for the moving base work. The decrease in effective pilot control fixed the upper limit on the amplitude, and the onset of significant bending mode effects determined the lower.
The pilot senses the existence of the bending mode by visual and vestibular cues. In order to assess the relative importance of these two inputs, the experiments were performed both fixed and moving base using a single axis of rotation.
Fig. 1 contains a block diagram showing the position of the pilot, booster, displays, disturbance signal, and possible compensations in the signal axis control loop. Fig. 2 shows the components used for this investigation.
For the purposes of this study, display and stick filters were not used except for a brief comparison of two suggested stick filters. The control stick filter was eliminated to find the deterioration of uncompensated pilot performance
with increasing bending mode amplitude. From comparisons of the resulting increases in attitude error and structural loadings with attitude specifications and structural limitations, bending
mode amplitudes requiring the additional complexities of control stick filters may be determined.
Rigid body rate compensation was added after preliminary experiments indicated the combination of uncompensated dynamics, noise signal, and bending mode created a very difficult control problem, No bending mode rate information was included in the rate signal.
Perfect filtering of the flexible portion of the rate signal was assumed in order to study only direct control stick
excitation of the bending mode.
A random noise disturbance signal summed with the simulated dynamics output produced the moving base drive signal to the simulator and the fixed base error signal.
The random noise signal replaced the wind spike distrubance of Ref. 1 to allow pilot transfer function computations. The noise signal entered as an attitude angle and not an accelera-tion into the dynamics, once again, to restrict direct
bending mode excitation to the control stick output.
The RMS value of the disturbance signal was chosen so that typical RMS attitude errors ranged from one to three degrees. These errors could be controlled with the maximum control torque of 4.40/sec 2 . This value was inadvertantly made 15% higher than that recommended in Ref. 1.
The disturbance consisted of a white Guassian signal shaped by two first order filters with break frequencies
at 1 rad/sec. Two factors determined the frequency content of the signal. First, the noise signal had to contain sufficient
high frequency power to permit computation of a transfer function valid to .8 cps. Secondly, the signal could not vary so rapidly that the subject was unable to control the rigid body portion of the error signal.
Bending mode influence on pilot performance was measured by error to disturbance and pilot control stick
output to error signal ratios, and by pilot transfer functions. The experimental part of the thesis consisted of both
fixed and moving base studies of variations in bending mode amplitude and natural frequency, and extended fixed base
studies including simulator dynamics, disturbance signals
with lower RMS values, and stick filters.CHAPTER II
SIMULATION AND EQUIPMENT
This chapter describes the simulated missile dynamics, and the equipment needed to instrument the control loop of Fig. 2.
The equations of motion and parameter values describing the pitch axis dynamics of the Saturn V booster at maximum dynamic pressure were taken from Ref. 1. The linearized rigid body equations for small perturbations from the nominal trajectory are:
x = - F a - F rb - F 6 (2.1)
rb = M a -M (2.2)
a= rb + 57.3 x (2.3)
In Appendix 1, these equations are reduced to the following relation between $rb and :
(p + M F 57.3 + F 57.3
M V
rb = M 5 M F (2.4)
(P3 + 57.3 F P12 - M p + 57.3
(p+V
a Ma
+
V
After replacing the parameters with their values at maximum dynamic pressure and factoring:
$rb (p + .0197)
- ( 4.1.15
This expression is simplified in Appendix 1 to: rb 7.67(.15)
(p - .15) (2.6)
Finally, when the rigid body rate compensation recommended in Ref. 1 is added, results in Appendix 1 show:
$ 7.67(.15)
(p + 1.00)(p - .15) (2.7)
The elastic body mode may be represented by: 2
K1-bd K3-1K2 1 (p + K' )
2 2
a (p + 2E WnbdP + w nbd) (2.8) From Appendix 1, after certain assumptions and parameter value substitutions, the equation becomes:
$bd K(p2 + 212) f2 2
for nbd
= 7 rad/sec (p + .01(7)p + 7 ) (2.9) 2 2 $bd K(p + 15) - = 2 2for wnbd
= 5 rad/sec(p
+ .01(5)p + 5 (2.10)The total expression for tot/a in terms of K, a number proportional to the bending mode amplitude, and wnbd, the natural frequency, becomes:
t -l.15 (p +. OlwnbdP+ nbd)+K (p 2+(3wnbd)2p-.15)(p+1.00)
the numerator of (2.11) for the two values of wnbd rad/sec) and four values of K (.0022,
The results are listed below: Wnbd (5 and 7 .0066, .0132, .0264). = 7 rad/sec, K = .0022 tot K = .0066 4 tot = (nom.) P t1 K = .0132 $ tot K = .0264 Wnbd K = .0022 -tot
r3
K = .0066-7-
tot: K = .0132 --- ~ $tot .0022(p + 19) (p - 18.6) (p2 + 102) (p - .15) (p + 1.00) (p2 + .01(7)p + 72) .0066 (p + 7.1) (p - 6.5) (p2 + (15.9)2) (p - .15) (p +1.00) (p2 + .01(7)p + 72 2 2 .0 132(p'+ 4.5)(p - 3.8) p (18.6) ) -.15)
(p
+ 1.00) (p2 +.
01(7)p
+7,)
.0264 (p + 3.2) (p - 2.4) (p2 + (19.5)2) (p - .15) (p + 1.00) (p 2 + .01(7)p + 7 2) rad/sec .0022(p + 22.7) (p - 22.7) (p2 + (5.8)2) (p - .15) (p + 1.00) (p2 + .01(5)p + 52) .0066 (p + 9.4) (p - 8.8) (p2 + (8.8)2) (p - .15)(p + 1 .0 0 )(p L + (.01)5 p + 52) .0132 (p J- 5) (p - 4.3) (p 2 + (11.5) 2) (p - .15) (p + 1.00) (P2 + (.01)5 p + 52) .0264 (p + 3.3) (p - 2.6) (p2 + (13.2)2) ' -. -' - - 2 2 K = .0264(
2.12) (2.13) (2.14) (2.15) (2.16) (2.17) (2.18) (2.19) kp - - -L-')) kP -t- I. 00) (p + - (.01) 5 p + - 5Figs. 3 and 4 show the analog computer program for the simulation of these missile dynamics. An EAI TR-48 analog computer was used for the fixed base investigations and Philbrick amplifiers for the moving base experiments.
For the case of the experiments concerning the stick filter proposed in Ref. 2, the dynamics associated with rigid body change. Teper and Jex recommend, in addition to the single integration stick filter, feeding
back position as well as rate information.
Appendix 1 shows that with these modifications and certain simplifications the effective rigid body dynamics become:
crb
- 85(4)2 - (2.20)
p + 2(.56)2 p + 2
With this change in rigid body dynamics the relation between tot and 6 becomes:
2 2 2 2 2 2
tot -3.4(p +.01(7)p+7 )+.0066(p +2(.56)2p+22) (p +21 (p'+2(.56)2p+2 2)(p2+(.01)7p+7 )2.21)
The root locus technique is applied to factor the numerator and the results appear below for K = .0066 and wnbd = 7 rad/sec.
4tot .0066
(p
11)
(p w 15.5) (p + (10.5)S (p + 2(.56)2p + 2
)
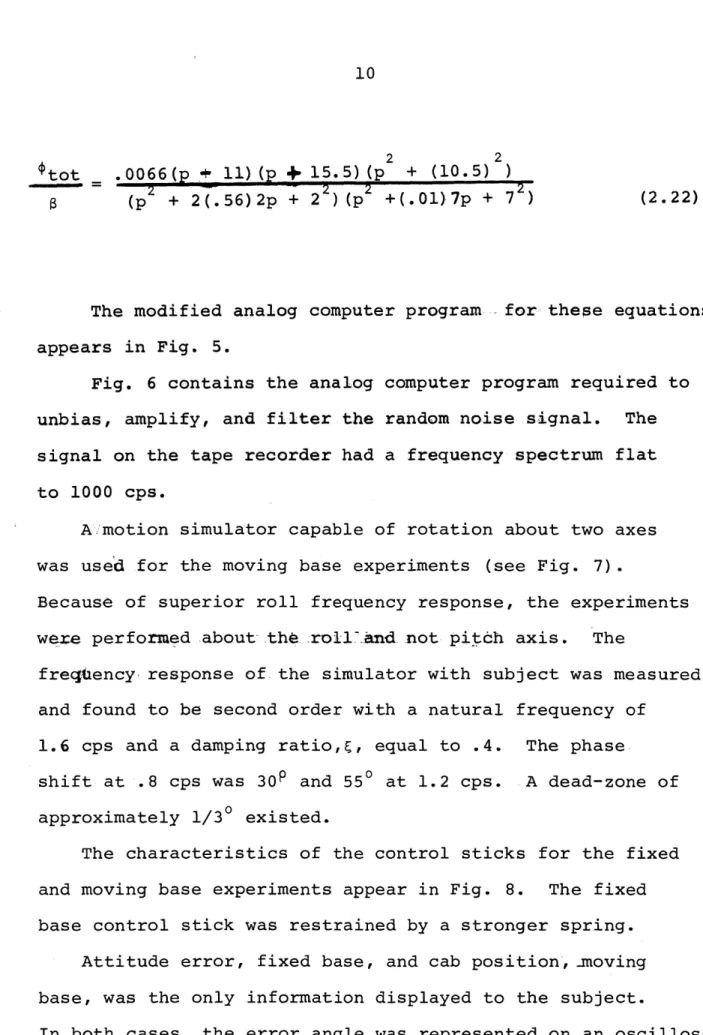
(p' +(.01)7p + 7 ) (2.22)The modified analog computer program for these equations appears in Fig. 5.
Fig. 6 contains the analog computer program required to unbias, amplify, and filter the random noise signal. The signal on the tape recorder had a frequency spectrum flat to 1000 cps.
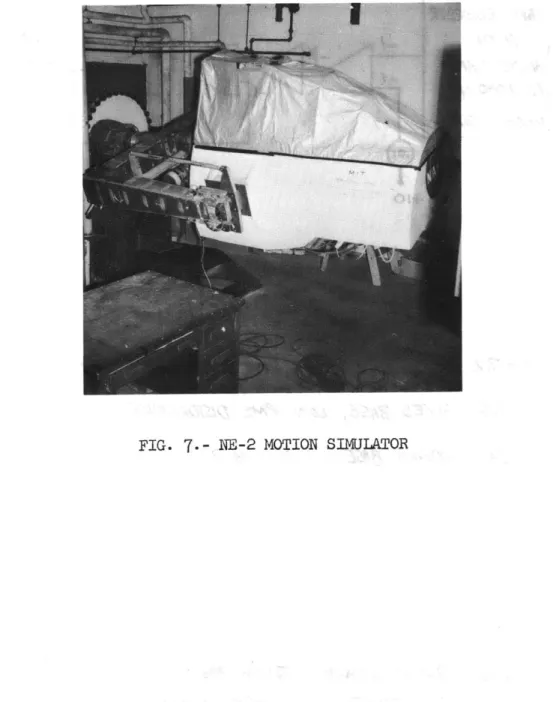
A motion simulator capable of rotation about two axes was used for the moving base experiments (see Fig. 7).
Because of superior roll frequency response, the experiments wexe performed about the roll and not pitch axis. The
freqctency, response of the simulator with subject was measured and found to be second order with a natural frequency of
1.6 cps and a damping ratio,, equal to .4. The phase
shift at .8 cps was 30P and 550 at 1.2 cps. A dead-zone of approximately 1/30 existed.
The characteristics of the control sticks for the fixed and moving base experiments appear in Fig. 8. The fixed base control stick was restrained by a stronger spring.
Attitude error, fixed base, and cab position, moving base, was the only information displayed to the subject.
by the horizontal distance from the center of the screen to a generated vertical line. The scope sensitivity was 1 cm/deg for fixed base work and .6 cm/deg for moving base experiments.
Four signals, distrubance, attitude error, stick output, and simulated missile dynamics output were recorded on strip chart recorders and a four channel F-M tape recorder,
(see Fig. 9).
Figs. 10 and 11 show the subjects' position, display, and control stick for the fixed and moving base investiga-tions respectively.
CHAPTER III
PROCEDURE
Three students served as subjects in the experiments. The subjects were screened by testing their ability
to control unstable dynamics in a compensatory tracking task and to balance on one foot without visual uses.
After selection, the subjects practiced controlling the Saturn V dynamics until no. further improvement in performance could be detected.
Typically, sessions lasted two hours and included twenty to twenty-five tracking runs of 90 or 120 seconds separated by three minute rest' periods.
During a session, only the bending mode amplitude changed. Usually, the session was divided into six runs at each of four
amplitudes. The bending mode amplitude increased as the session progressed.
Before each session, the subjects were informed of the bending mode natural frequency. In addition, they were told
of changes in bending mode amplitude.
The subjects were instructed to use the control stick as necessary to minimize the displayed error until the distraction of bending mode oscillations forced a reduction of control
efforts. The subjects learned fairly quickly by trial and error how much control to use at each bending mode amplitude.
A
The chart below shows the content and sequence of the sessions and the participating subject.
St40LATION
Sue
-
BENJCT4- MoME
WAT'JUE
L.RDUOk
3MgrA9L-S
3e.1
sesie
4
AK)J
AAP
.wIEc
RMAE
#8/64=~ Z-1 4jAj=-7
#7 w,,,=
5
*9,
WAAEIX
IED 8OfA
SE
Ka
_'_
=
K=Om4(NM)
K=OToK= 0 -ro 2
(OM)
43OWnO=S73
45 =
)
~
L
-Se=7
#9,
A6--Z
IOJ1~~A=5
9 =C0 T 7Oro
K-- ) TO ToamZ)K=Ob2(Ov)
K=-OT>ZLbM)Es
O
)
ILA
=b&
I
*L "130A '=IAJ~~f
K--or Q o
T.()) K=
V A) ao)
MOVN46-
BASE V . *O'o2Mb4
4i)
K I,4OM
KOiL:)O
COWD171ONS
IIAJnAV1
IJ
-----
1
K'A
TO2(NJOM
KQ ro46i_
FlyD
A~r
kll,4
OhW=7i
5 #2Oj4 5'
s5MULATO
WOPI.
MOVW6
rl:E
f
4=0
oM
To40
To
4)
o
p
o 4
-STICK I0
1O
5L.A
AIXCD BA SET
F#11)
BAW~
%Wgpl #2
4-4=7
#2Zaw5 K44
A0=5
COV~rTIOI45
K=O
re
L(4om)
=0
ro 200
)
KC6
TzZ
(OM
e z-OTo
(00
Fl-E
~SME
*LS
26)
K- MdOA
K:= WoM
---VCLE ADMWEWhing
I
STfCK
RLTER
IL
TCAr(V
0 rA-Kk
OF 4tDNEr' AL. u% 20
-1
rez
_ _ _ __(E~
T
E=
?STKJZ
PT
WAOM
fi
K: 0o"
LemOnt
FO1D
ahsE
#29
13CWO1W~r MODE
---AMPL1UVPC CJ3
10
TUACN1NOI-. INs__
arc
C
p
part of the difference Detween fixed and moving base results should be attributed to the combination of simulator dynamics, decreased display sensitivity, and lightly restrained control stick.
The interaction between disturbance signal amplitude and performance deterioration with increasing bending mode ampli-tude was studied in Series D.
Series E and F reflect curiosity about the effect of essentially changing the dynamics the pilot must control
from fourth to either fifth or sixth order by the addition of a stick filter.
To confirm that deterioration in performance with increasing bending mode amplitude did not occur because of the order of presentation or knowledge of amplitude, a subject, without this information, was tested in Series G.
Fatigue was checked as a possible factor by testing the subjects' ability to control the rigid body mode alone at various times during the two hour sessions.
Integral square error values of the noise, error, and stick outputsijna1s were calculated by amplifying, squaring, attenuating and integrating these signals for each run. Fig. 12 contains the analog computer patching program that performed these operations.
These scores, pilot transfer functions, and strip chart recordings provided the means to analyze the effect of
The error to disturbance ratio,
measured the pilot's ability to control the attitude of the simulated missile.
The control output to error ratio,
and pilot transfer functions show more directly the results of changing conditions on the pilot.
This second ratio represents an average gain for the pilot for the run, but ignores the well-known dynamics associated with the human operator.
The pilot transfer functions were computed by a spectral analysis method described in Appendix 2.
The approximate levels of accelerations due to bending mode oscillations were determined by anaiysis of the individual strip chart recordings. These recordings also show clearly changes in pilot control actions as a function of bending more amplitude.
CHAPTER IV
DISCUSSION OF RESULTS
The effect of variations in bending mode parameters and simulation conditions will be discussed from two standpoints:
1. Changes in pilot control characteristics.
2. Changes in closed loop attitude error performance.
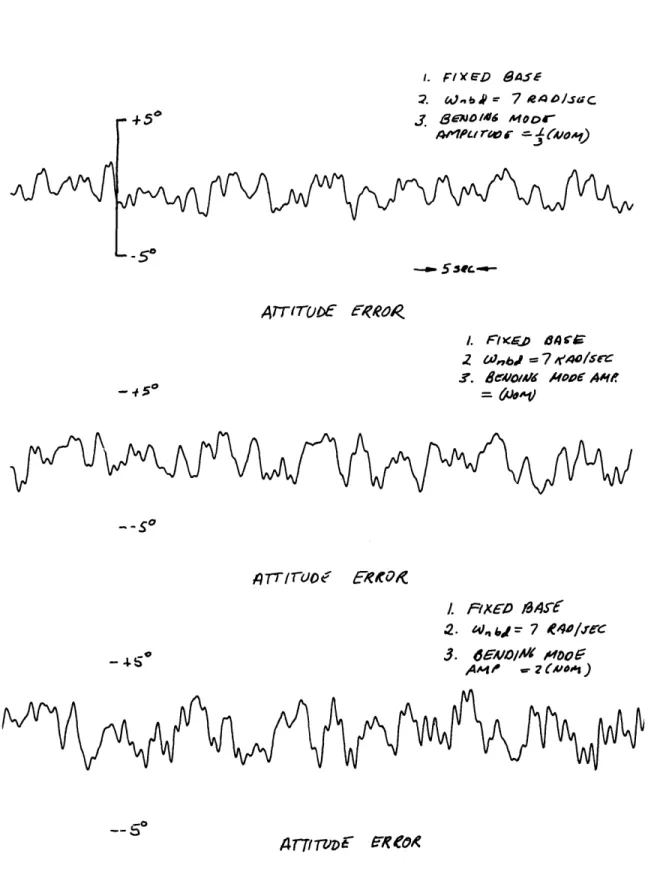
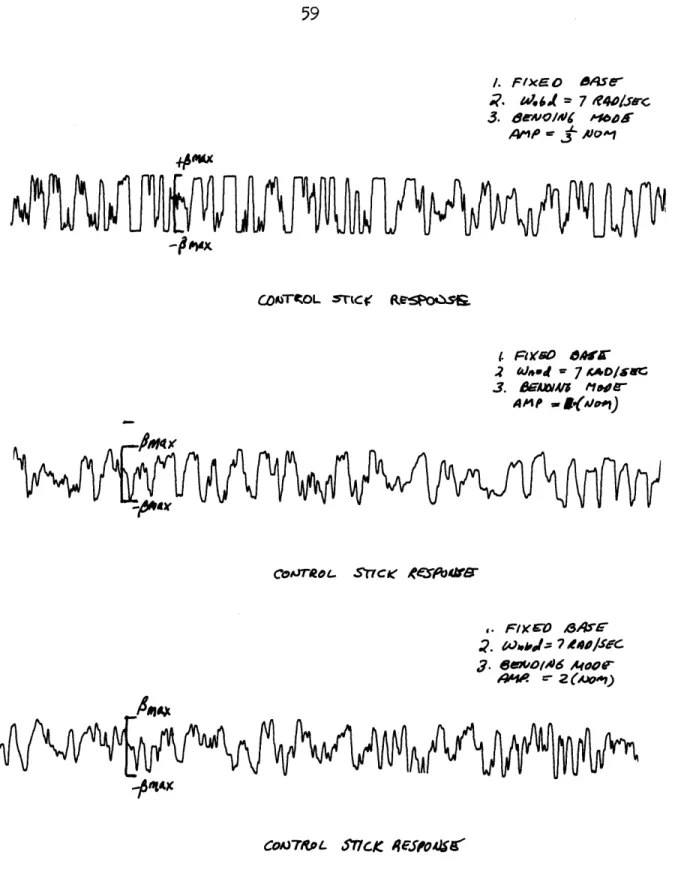
Strip chart recordings of the displayed attitude
error and control stick movement are presented in Figs. 13 and 14. These are taken from a fixed base session with Wnbd = 7 rad/sec. These recordings show qualitatively the reduction of effective pilot control and the increase in attitude error as the bending mode amplitude increases.
With the bending mode removed entirely, the pilot used all available control power and behaved very non-linearily. In this case, only the amount of control power as set by the Saturn V recommendations of Ref. 1
restricted the pilot, and the control stick output contained a significant amount of high frequency power. A revision in pilot control strategy became necessary with non-zero bending mode amplitudes. If the subject failed to restrain
his control action, intolerable bending mode oscillations developed at even the lowest amplitude (1/3 nom.) under study. In the process of attempting to alleviate this problem, the subject began to lose effective control of the rigid body portion of the attitude error.
To analyze these effects more quantitatively, several criteria were employed. Pilot describing functions were measured for four sessions by a power spectral technique
5,6
explained in detail in Appendix B and associated references.' Power spectral estimates of the attitude error and control stick signals are available from the describing function computation. In addition, RMS ratios of the control stick to the attitude error signal, , and theattitude error to disturbance signal, V -were measured for the individual tracking runs.
The describing function was calculated by the following formula:
13 (W)
where:
D1 3(w).=the cross power spectral estimate between the disturbance signal and the control stick signal
012(w)= the cross power spectral estimate between the disturbance signal and the displayed error
The degree to which the describing function accounted for the pilot's behavior was measured by the correlation coefficient:
.(4.2)
where:
fiw = the power spectrum of the disturbance signal (~)> = the power spectrum of the control stick signal The value of 1 should be near unity if the describing
function accounts for most of the operator's characteristics. The describing function data is presented in Tables 1 through 4 and plotted in Figures 15 through 22. The
amplitude data and fitted amplitude ratios appear in the first four figures. The phase data are shown in the last
four. Pertinent information about the associated experi-mental condition is listed in the Tables.
It should be noted that the correlation coefficients are not close to unity above 3 rad/sec for the fixed base experiments and 2 rad/sec for the moving base work.
The recorded disturbance signal contained occasional spikes from an extraneous source. These spikes showed up as an uncorrelated wide-band signal superimposed on the spectrum of the disturbance. On the average, the wide-band spectrum amplitude reached 1/10 of the disturbance signal
power spectrum at 2.7 rad/sec fixed base, and at 1.8 rad/sec moving base.
Above these frequencies, the reliability of the data drops sharply because only a fraction of the disturbance signal is uncontaminated. However, the form of the
amplitude and phase data remains reasonable to 3.6 rad/sec. With these factors in mind, the describing function results are retained up to this frequency.
The describing functions are summarized in Table 5. The important results are:
1. The level of pilot gain decreases as the bending mode amplitude increases.
2. The phase lead generated by the pilot decreases with increasing bending mode amplitude.
3. The subjects' gain was significantly lower during the moving base tests than in the fixed base
experiments.
The lowering of subject gain reflects his attempts to minimize bending mode excitations.
The decrease in phase lead as the bending mode amplitude increases seems to be best accounted for by a larger dead-time delay in the pilot describing function. There is some shifting of the pole-zero cqrbination, but this is not a major factor.
The distinct reduction of subject moving base gain
compared with fixed base results was unexpected. Simulation and scaling factors were carefully checked for errors that might explain the effect.
The power spectral estimates of the error signal presented in Tables 6 through 9 show that the reduced moving base gain occurs because of increased error rather than lower control stick power.
A series of fixed base-experiments including
the second order dynamics and dead-zone associated with the motion simulator plus the moving base, control stick and display will be discussed in more detail later.
However, these experiments did not indicate that the increased increased error could be attributed entirely to these
factors. It should be pointed out, though, that not all the motion simulator non-linearities, such as stiction
and backlash, were considered. The effect of these factors cannot be discounted because typical simulator movements were within the range of + 50.
Apart from this, the increased errors may be attributed to subject uncertainty about the location of the vertical during the moving base simulation. The subject's vestibular system may provide orientation informa-tion that is in error by a degree or two. Furthermore,
the scale on the moving base display was less sensitive and the grid was not as well defined as the fixed base display.
In spite of the reduced gain, the subject was able to generate the same amount if not more phase lead. For these reasons, the best explanation seems to involve neglected simulation non-linearities, a less sensitive
display, and perhaps vestibular confusion and insensitivity concerning very small angular deflections about the vertical.
Tables 6 through 9 include the power spectral estimates of the error and control stick for the four sessions where describing functions were computed.
The control stick power from Tables 7 and 8 has been plotted in Figures 23 and 24. These power spectral
estimates show:
1. In general pilot control-power at the primary rigid body control frequencies of .45 to 1.8 rad/sec
decreases with increasing bending mode amplitudes. There are exceptions to this statement, however, considering the increases in rigid body error power at these frequencies, effective pilot control has certainly decreased. The same general effect appears on the amplitude plots for the
describing function. In this case there is no considera-' tion of linear correlation.
2. In certain cases, there has been an attempt to track the higher frequency bending mode error as indicated by secondary peaks a little below the bending mode natural
frequency.
3. Control stick power drops drastically with increas-ing bendincreas-ing mode amplitude at and above the natural frequency.
4. The subjects were remarkably adaptive in their attempts to avoid bending mode excitation by elimination
of the high frequency components from their control stick action.
The reduced gain versus increased bending mode amplitude is shown by a slightly different criterion in Fig. 25-. The RMS ratio of control stick signal to error signal,
is plotted versus bending mode amplitude for the set of fixed base experiments including simulator dynamics. This ratio represents a pseudo-gain for the subject that
ignores dynamics and linear correlation. Once again, pilot gain is inversely related to bending mode amplitude. The decreasing gain consists of both in increasing RMS error
and decreasing RMS control power.
The ratio of the RMS value of the error to disturbance signal,
V7
measures the effect of variations in pilot control strategy on closed loop performance.Before discussing the main body of results, several tests for spurious variables will be described. Three subjects were used for the fixed base experiments with the bending mode natural frequency, w nbd = 7 rad/sec.
In order to check. intersubject differences an analysis of variance was performed on the results of this series of experiments. Intersession and intersubject variances were compared for each of the four amplitudes. Fig. 26 presents the individual tracking run scores for the two sessions under study for each of the subjects. Table 10 shows the results of the analysis of variance.
The intersubject interaction was significant at the .05 level for only one .mplitude 2x(nom.). On this bais inter-subject interactions were ignored.
In order to test the importance of subject knowledge of the bending mode amplitude and the fixed order of
bend-ing mode amplitude variations, ten trackbend-ing runs were taken at an amplitude, 1.33 nom., unknown to the subject. The experimental conditions were: fixed base simulation, and wn = 7 rad/sec. The average, score was .84 compared with an expected .70 based on results that will appear in Fig. 27. If such a limited amount of data is
significant at all, it would indicate that subject performance at a given amplitude would not improve if the amplitude was varied randomly with no information being given to the
subject.
On several occasions, scores for the condition of no superimposed bending mode were taken towards the end of a session. No increase in these scores over the ones, at the start of the session was noted indicating no fatigue effects.
ThevJ -T ratio is plotted against the four
Wnbd = 7 rad/sec bending mode amplitudes for the three types of simulation, fixed base, moving base, and fixed base plus simulator dynamics in Fig. 27. The scores
plotted for each amplitude and type of simulation represents the average of all the individual tracking runs for the
Both moving and fixed base experiments were performed in an attempt to find the relative importance of vestibular and visual cues. The fixed base experindents with the second order dynamics and dead-zone of the motion sumulator plus moving base display and control stick were conducted to find the significance of these factors.
The results show that:
1. The ratio increases significantly with increasing bending mode amplitude.
2. The attitude error is much larger for moving base experiments compared with the fixed base.
3. This difference cannot be completely accounted for by any conditions tested in the fixed base plus
simulated dynamics series.
4. The attitude error increases less rapidly for the moving base and fixed base plus simulated dynamics than for the fixed base experiments.
The first result reflects decreased subject gain and phase lead generation.
The second has been discussed earlier in the chapter. Since the rate of attitude error increase is similar for the moving base and fixed base plus simulator dynamics, the difference between the fixed and moving base rates
Unfortunately, the dead-zone associated with the motion simulator suppresses bending mode oscillations, and makes fixed and moving base comparisons difficult.
This emphasizes the fact that moving and fixed base differences can be the result of vestibular effects or simulator characteristics. Furthermore, the simulator dynamics and non-linearities must be located at a-very bad place, between the actual position and the displayed posi-tion, in this control loop. For this reason, the fixed base results are probably more realistic and reliable.
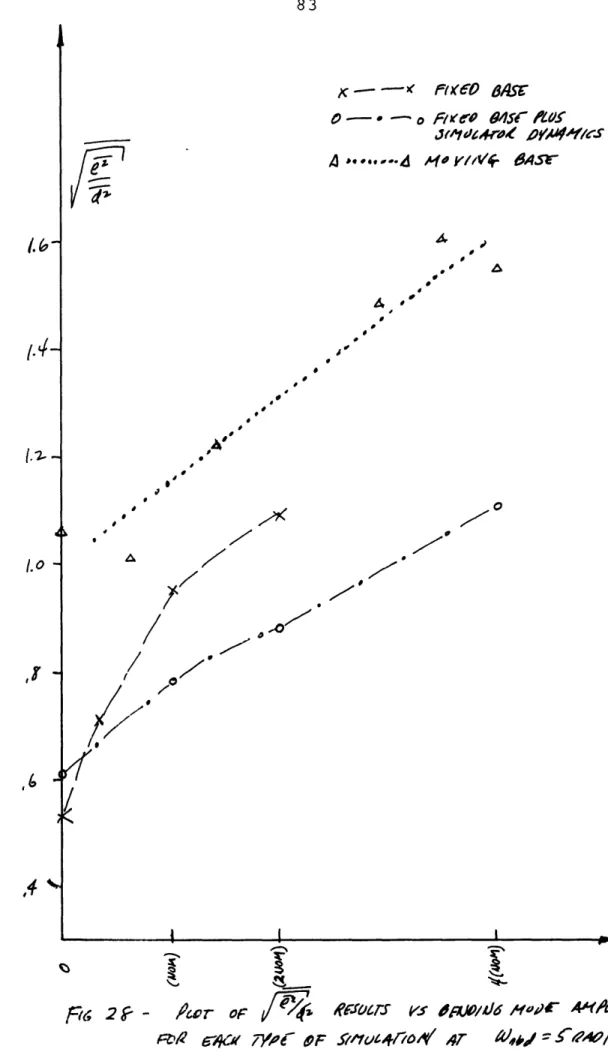
The same results are plotted in Fig. 28 for the bend-ing mode of natural frequency w n = 5 rad/sec. The general trends are very similar. The ratio has been plotted versus amplitude and not effective acceleration. For the
same bending mode amplitude, the effective acceleration for wnbd 5 rad/sec is only 1/2 of the -acceleration for the case of
w
nbd = 7 rad/sec.Comparisons of the i/l ratio for w nbd = 5 and 7 rad/sec are plotted for each type of simulation in Figures 29 through 31 versus amplitude and not effective
acceleration. The ratio increased more rapidly for w n = 5 during fixed base simulation and for w = 7 during fixed base plus simulator dynamics. On the other hand, there was little difference during the moving base simulation. The only certain conclusion is that one-half the acceleration at w nbd = 5 rad/sec compared with
W nbd = 7 rad/sec caused approximately the same performance deterioration.
The results from the fixed base experiments using a disturbance signal with one-half the RMS value of the previous experiments appear in Figures 32 through 35. The averaged scores for the two sessions at both w nbd = 5 and 7 rad/sec are presented in Fig. 32.
Consistent with the earlier fixed base results, the attitude error for a given amplitude is greater for w nbd = 5 rad/sec.
Fig. 33 contains the results for the same
conditions. Note, that at each amplitude, the subject gain is lower for ()nbd = 5 rad/sec curve and the attitude error is greater. This same correlation between gain and error holds at each amplitude for the fixed base plus simulated dynamics experiments except that the gain is lower and attitude error greater for nbd = 7 rad/sec, see Fig. 25, 27, and 28.
With this correlation in mind, the interaction between the RMS value of the disturbance signal and the rate of
increases with respect to bending mode amplitude will be examined. Comparisons of the attitude error performance for the two disturbance signals at each bending mode natural frequency appears in Figs. 34 and 35.
Somewhat surprizingly, for each non-zero bending mode amplitude and both frequencies, the subject's
addition, for the one high RMS fixed base session where the ratio was measured, the subject operates
with a higher gain for the low RMS disturbance signal. This result is not consistent with the previous high gain ratio-low error ratio correlation just discussed.
The final series of experiments studied two vehicle augmentation and control stick filtering schemes. Both approaches have been simplified, and the simulated dynamics
are only first approximations to the actual control systems. For all previous experiments, the augmented missile
dynamics have been similar to those proposed by Hardy,
et al,in"Ref.1. To approximate the entire system recommended there, a second order stick filter was added in series with these dynamics. The effective dynamics as seen by the
subject appear in Fig. 36a.
The simplification of the missile augmentation proposed by Teper and Jex in Ref. 7 has been discussed in Appendix A. The single integration-gain stick filter was placed in
series with this set of simplified dynamics to form the complete system, as shown in Fig. 36b.
The bending mode amplitude was fixed at the nominal value and the natural frequency at 7 rad/sec for all experiments in this series.
Twenty tracking runs divided between two sessions were taken for each system.
Before discussing the results, the choice of one para-meter must be explained. There was some uncertainty
about the correct choice of maximum control troque for the single integration system. Up to the present, the maximum torque has been 1.150/ sec2/S with amaK = 3.870. Preliminary experiments with both systems indicated that the second
order filter removed about 10% of the pilot response signal, and the single integration-attenuation filter output was 1/3 of the pilot's response. For this reason, the maximum control was increased by a factor of three for the latter system.
For these experiments, the ratio was measured for both the control stick output and the stick filter
output signal. As usual, the attitude control was measured
by. the ratio.
The results are summarized in Table 11 and show that:
1. The average ratio for the single integra-tion-stabilized dynamics version was .88, compared with 1.20 for the second order-rate augmented dynamics system
2. Both systems reduced bending mode excitation to an occasional oscillation or two at an amplitude of less than one-half degree.
3. As mentioned earlier, the single integration filter removed a much greater portion of the operator's response than the second order filter.
4. The effective pilot gain, as measured after
the filter, is higher for the case of stable r gid poles and single integration stick filter.
Because of this last reason, the improved performance with the approximation to Jex and Teper's proposal may be due to the arbitrarily increased control torque. However, the complete stabilization of the rigid poles seems like a very reasonable suggestion, and should contribute to
improved performance. On the other-hand, the single integration-attetuation filter, suppreSses a large per-centage of the operator's response.
CHAPTER V
CONCLUSIONS
From observation of the strip chart recordings, attitude error increases and pilot control strategy changes markedly with increasing bending mode amplitude. The operator switches from a relay-like non-linear response to a combination of
lower amplitude of pulsing and at times smooth tracking. Furthermore,,.significant bending mode excitation can develop at the lowest amplitude, 1/3 nom., under study.
The pilot describing functions show that as the bend-ing mode amplitude increases, the pilot gain and phase
lead compensation decrease. The decreased phase lead is best accounted for by greater subject dead-time delay.
The pilot attempts to track the oscillations that occur slightly below the bending mode natural frequency, however pilot response power decreases sharply at and above the natural frequency.
The RMS ratio of attitude error to disturbance signal substantiates quantitatively the increase of attitude error with respect to bending mode amplitude.
The subject performance is much poorer moving base than fixed base for all values of bending mode amplitude. The pilot exerts approximately the same control power in both
Fixed base experiments including second order simulator dynamics and dead-zone plus the moving base display and
control did not account for a major portion of the difference. The best explanation seems to involve a combination
of neglected simulator non-linearities, a poorly marked and less sensitive moving base display grid, and perhaps vestibular confusion and insensitivity to very small deflections.
The rate of increase of the attitude error with respect to bending mode amplitude was less rapid moving base
compared to fixed base. The results were attributed to the simulator dead-zone and not to vestibular effects because the fixed base plus simulator dynamics results show a rate equal to that for moving base experiments. For a given amplitude the bending mode with natural frequency of 5 rad/sec creates one-half the acceleration of the 7 rad/sec mode. Equal amplitudes for the two cause an approximately equal performance deterioration.
Possible spurious effects due to intersubject variance, subject knowledge of bending mode amplitude and order of occurance, and fatigue were checked and not considered important.
For a given natural frequency and non-zero amplitude, the RMS ratios,/ . were typically 10% higher for the case of the low RMS disturbance signal compared with the
high RMS signal. The high RMS value was twice that of the low.
Highly simplified versions of two proposed vehicle augmentation and control stick filter schemes were
studied experimentally. The results favor the one with stable missile rigid poles and single .integration stick filter judged on the basis of attitude error performance. Both eliminated bending mode oscillations.
Because the single integration filtered out much more of the subjects response, the maximum available control power was arbitrarily increased by a factor of three. The attitude error difference may be due to this change.
A relatively low frequency first bending mode decreases pilot lead compensation and closed loop attitude performance in addition to creating structural problems. Significant effects develop at bending mode amplitudes equal to one-third that sensed at the Saturn V attitude station. Stick filters apparently solve the structual problem, but add phase lag in series with typically difficult dynamics. This requires effective stabilization of the vehicle dynamics to alleviate the pilot control problems in the presence of disturbance signals.
APPENDIX A
DERIVATION AND SIMPLIFICATION OF SIMULATION EQUATIONS
The equations of motion, parameters values, and
following- diagram are taken from Ref. 1. The equations of motion are linearized and valid for small perturbations about
the booster's nominal trajectory. The equations are written with respect to a coordinate system moving at the booster velocity along the trajectory.
VEuIcL
C
LNOMIANA
.
To hTt
CTWAWrLA4
F03
NOMIlNAL AMITIt-a
'
The rigid body equations are listed below:
x=- F a - F (A 1.0) rb rb $rb =M a -M (A 2.0) 57.3 ( = $rb +
Vx
(A 3.0)
Y rb =-F a - FSS - .. $rb (A 4.0)57.3
Differentiating and rearranging equation(A 3.0)gives:
V F F -F
~
-F(A
(cx- $rb 57.3 = FrbxDifferentiating and rearranging equation (A 2.0):
9 1 "'
cx = ($rb + M6) (A
Substitution into (A 6.0) results in: 1 0A M *
6
m
rb + Ra- $rb) 57.3 F M rb +rb Rearranging (A 8. 0): v +,, F,. V 57.3 M rb M rb ~ 57.3 rb + F $rb M M =- M 57.3 -F66 FaUsing LaPlace operator notation: m vm M 57.3 p + F9 + F ) rb Ot F V p3 + 012 - 5 3 p + (57.3 M m 57.3 (p + M 57.3 + F 573 57.3 M F (p3 + 57.3 Fa P2 - M p +, .- .) V ax V 6.0) 7.0) (A 8.0) (A 9.0) (A 10.0) (A 10.1)
_ _
following values: Ma = .141/sec M = 1.15/sec V = 486 m/sec 2 F = .36 meters/sec /deg F = .13 meters/sec2/deg F = .30 meters/sec 2/deg
After substitution of these values (A 10.1) becomes:
rb -- =- 1.15 = - 1.15 (p + .02) (p3 + .0153P .- .I4p + .0060) (A 10.2) (p + .02) (p - .34) (p + .40) (p - .04) (A 10.3)
Considering only ( .4) for p =
jw
> .4 rad/sec:1 and . (p + .02) -
L(p
- .04) 00For simulation purposes (A 10.3) was simplified accordingly: rb 1.15
(pr- 34) (p + .40) (A 11.0)
1.15
p - .15 (A 11.1.)
If'rate compensation is added, the feedback polarity must be as shown to decrease the instability:
Then: 1.15 _
.75p(l.15)
p2-. 15 p -. 15 rb After rearrangement: 2 (p + .86p - .15) = - 1.1561-.15
+ . 86p - .15)I
b
rb (p2 1.15 (p + 1.00) (p - .15) (A 14.1)The following equations describe the flexible
body mode:
+ 2
Ewnbd1
0 2
+ W nbdn = Kjj + K21a
Obd = K3 1n
Combining and rearranging:
2 K K3 1K2 1 (P. + ) (p + 2 w nbdP + w nbd) 4 rb (A 12.0)
(A
13.0)
(A
14.0)
De(A
15.0)
(A 16.0)+bd
_ _ = (A 17.0) 4 -1.157 tip. tThe values for these parameters at maximum Kynamic pressure are: K1 = .46/deg-sec K2 1 = .00077/deg K3 1 = 8.6 deg After substitution: .0066(p + (24.4) ) (P2 + .01(7.33)p + = .005 Wnbd =-7.33*rad/sec K(2 +W2) -K(p +wz) (7.33)2) (p2 +.0l p+LO 2) P P
For convenience, wz was made equal to 3w for all values of w under study.
The total attitude error, ktotal' equals the sul of the rigid body and flexible body contributions, therefore:
= o-
1.15
(p+1.00) (p-.15) K(p2+(3wnbd 2 2 (p +.Olnbdptwnbd (A 19.0) - 1.15(p2+ nbd nbd) + K(g +(3wbd) ) (p+1.00) (p-.15) (p+1.00) (p-.15) (p +.Olw p+ b nbd nbd (A 20.0)The root locus technique was used to factor the numerator. A separate root locus plot appears for both bending mode frequencies, (see Fig. Al and A2). The numerator must be written in the following form to apply
the technique: 1 -2 2 l. 15 (p + .OlnbdP + wnbd K (p2 + (3wnbd) )(P - .15) (p + 1.00) = 0 (A 21.0) bd (A 18.0) f3
the root locus gain equals 1.15/K.
Roots have been located for the appropriate values of K on the two plots. The results are listed in Chapter II
in transfer function form. The root locus gains correspond-ing to bendcorrespond-ing amplitudes are listed below:
K K Root Locus .0022 .0066(nom.) .0132 .0264 522.7 174.2 87.1 43.6
The root locus gain is related to the spirule reading accordingly:
K = (pirule: reading) S
1P
1P2P 3P (A 22.0) where S is scale factor equal to the number of radians/secrepresented by 5" on the plot and pi and q are the loca-tions of the poles and zeroes.
For w
J
I(Q(-5 )5, . 25F r= 1P1P2P3P4 1(-.15) (1.00) (15 ) (-15 J) 33.75
1 ' 1pip2 3p4
49
(-.15) (1.00) (2 1 ) (-21 )1 66.15
*
74In this case S = 20, so the spirule readings and the bending mode amplitudes have the following relationship:
IP PP2 p. 3 1 1.15
(spirule reading) = K
I 1q 21 S p-q K
(A 23.0)
K Spirule Reading
.0022 1.77
.0066 .59
.0132 .29
.0264 .15
Jex and Teper augment the dynamics of the Saturn V by feeding back both attitude rate and position. The sum of the control stick filter output and the feedback signal passes through two first order lags with break frequencies at 5 rad/sec. This filtered signal provides the command to the engine gimbal. The complicated closed loop transfer function including two bending modes as taken from Ref. 2 appears below: Sattitude gyro _ stick filter (A 24.0) 4,900(s+.019)(s+4.5)(s-4.6)( 0.0050 00066)
12
21
(s+0.035) (s+.62) (s+6) (s+30) (0.56 0.038 0 018 0 302
7
.2
12
30
0.30
2 2 where ( 30) denotes (p + 2(.30)30 p + 302The dominant rigid body modes are now stable and have a natural frequency of 2 rad/sec and a damping ratio, C * .56.
In order to reduce the complexity of this set of dynamics to a level equal to the previous work, the two dominant rigid body poles were placed in parallel with the simulated first bending mode.
The extreme simplification not only reduces the complexity, but also, the difficulty of the dynamics proposed by Teper and Jex.
However, in spite of this fact, a first approximatidon to a realizable set of stabilized Saturn V rigid body dynamics ha s been selected.
The new set of missile dynamics has the following form:
tot 4k + .0066 (p2 + 212) (A 25.0)
p + 2(.56)2p + 2 (p + 2(.005)7p + 7
The natural frequency of the bending mode was placed at 7 rad/sec and K = .0066 = nom. to correspond closely with the Saturn V design conditions. The value of the
remaining parameter, k, was selected after initial experi-ments with this system. The basis for the choice is
discussed in Chapter IV. With the selected value of k = .85, equation (A 25.0) becomes:
tot 3. 4 (p2+ (.01) 7p+7 ) + .0066 (p +21 )(p +2(.56)2p+22 (b +2(.56) 2p+2 ) (p +(.01)7 p + 7
)
(A 26.0)
After placing the numerator in a form suitable for solution by the root locus technique:
3.4 (p2 2 .0066 (p + (.01)7 p + + 21 ) (p2 72) + 2(.56)2 p +
After solution of the root locus:
$tot .0066 (p-li) (p+15.5) (p +(10.5) 2) 2 +2 6 (p2 +2(.56)2p+2 2)(p2+.0l(7)p+7 .) I - = 0 2 ) (A 27.0) (A 28.0)
APPENDIX B
PILOT DESCRIBING FUNCTION MEASUREMENT TECHNIQUE
The pilot describing functions were computed by the following equation:5
(13 (W)
Y p(s) = 12 (W) (Bl.0)
where:
D13(w) = cross power spectral density of the input disturbance signal and the operator's
response-*12 (W) = cross power spectral density of the input disturbance signal and the displayed error. The operator's response contains a part correlated with the input disturbance signal and an uncorrelated
remnant. The degree of correlation determines how well a describing function accounts for his behavior.
This correlation is measured by the following ratio:
where:
011(w) = input disturbance signal power spectral density
0
3 3(w)
=
operator's response power spectral density.
If p
2
is near unity the describing function is a
close approximation to the operator's behavior.
A program, written by the staff of Health Sciences
Computing Facility, UCLA, and made available to the
Man-Vehicle Control Laboratory by Ames Research Center, NASA,
was used to compute the necessary power spectrums. The
program was modified in the Man-Vehicle Control Laboratory
to compute the describing function by (Bl.0).
6This method computes the power spectral estimates of
an analog signal T seconds long by sampling every
AT
seconds.
A total of M
=
T/AT points are available for
compu-tation. The correlation function
O(T)of the sampled signal
is computed for m lags of AT.
Under these conditions:
1. The sampled data will have no spectral power
above a frequency w
high where:
Whigh
=(B3.)
2. The spectral density will be computed at m
equally spaced frequencies between 0 and whigh. Hence
the frequency resolution will be:
3. The probable error of the computed spectral error will be:
If N independent spectral densities are saveraged, the probable error is reduced to:
For this work the following values were chosen: T = 70 sec
AT = 0.1 sec M = 70 0
M = typically 5 For these values:
hiW 5 cps Whigh -Aw .07 cps M = 700 points E =