https://doi.org/10.4224/17719206
READ THESE TERMS AND CONDITIONS CAREFULLY BEFORE USING THIS WEBSITE.
https://nrc-publications.canada.ca/eng/copyright
Vous avez des questions? Nous pouvons vous aider. Pour communiquer directement avec un auteur, consultez la
première page de la revue dans laquelle son article a été publié afin de trouver ses coordonnées. Si vous n’arrivez pas à les repérer, communiquez avec nous à PublicationsArchive-ArchivesPublications@nrc-cnrc.gc.ca.
Questions? Contact the NRC Publications Archive team at
PublicationsArchive-ArchivesPublications@nrc-cnrc.gc.ca. If you wish to email the authors directly, please see the first page of the publication for their contact information.
NRC Publications Archive
Archives des publications du CNRC
For the publisher’s version, please access the DOI link below./ Pour consulter la version de l’éditeur, utilisez le lien DOI ci-dessous.
Access and use of this website and the material on it are subject to the Terms and Conditions set forth at
Open path LII diagnostic for the determination of PM emissions from flares. Year 2 report to Natural Resources Canada
Devillers, Robin; Thomson, Kevin; Smallwood, Greg; Johnson, Matthew
https://publications-cnrc.canada.ca/fra/droits
L’accès à ce site Web et l’utilisation de son contenu sont assujettis aux conditions présentées dans le site
LISEZ CES CONDITIONS ATTENTIVEMENT AVANT D’UTILISER CE SITE WEB.
NRC Publications Record / Notice d'Archives des publications de CNRC: https://nrc-publications.canada.ca/eng/view/object/?id=39fe840e-f80f-4119-875e-acce786a5c0c https://publications-cnrc.canada.ca/fra/voir/objet/?id=39fe840e-f80f-4119-875e-acce786a5c0c
1
Open Path LII Diagnostic for the Determination of
PM Emissions from Flares
Year 2 Report to Natural Resources Canada
Project Manager: Mr. Michael Layer
National Research Council, ICPET Environmental Sensors Robin Devillers, Ph.D. Research Associate Robin.Devillers @nrc-cnrc.gc.ca (613) 990-2237 Kevin Thomson, Ph.D. Research Officer Kevin.Thomson@nrc-cnrc.gc.ca (613) 991-0868 Greg Smallwood, Ph.D.
Senior Research Officer
Greg.Smallwood@nrc-cnrc.gc.ca (613) 993-1393
Carleton University
Department of Mechanical & Aerospace Engineering
Matthew Johnson, Ph.D., P.Eng
Associate Professor
Matthew.Johnson@Carleton.ca (613) 520-2600 x4039
Abstract
A novel technique for quantifying soot (PM) emissions in flare plumes was investigated. The proposed technique is based on auto-compensating laser induced incandescence (AC-LII) configured for remote measurement of LII emission from a soot plume. The theory of AC-LII was presented and the literature on retro-LII was reviewed. The key features and targets of a new remote AC-LII were then defined and implemented. The system was tested on a plume of known concentration at a moderate distance. The sensitivity of the remote AC-LII system was ample to measure the LII emission from the plume; and the preliminary results overpredicted the plume concentration by 70%. Further work is needed to verify the operating conditions of the burner and the absolute light intensity calibration of the remote AC-LII system in order to improve the measurement accuracy. An additional piece added to the inverted flame will allow the creation of a soot aerosol of variable length well suited for testing of the remote AC-LII system at distance more representative of a field measurement. An analysis of the present sensitivity of the system and an extrapolation of this sensitivity to a field setting indicated that the remote AC-LII system would have a target sensitivity of 0.35 to 5 µg/m3 in a 2 m diameter plume at a distance of 30 m, depending on the size and focal length of the telescope used for the LII emission collection. With a wind speed of 4 m/s, this would translate to a carbon emission rate sensitivity of 5 to 65 µg/s. However, these numbers are estimates only and must be verified with field distance trials. Significant challenges remain in the further development of this novel technology for remote quantification of PM emissions and complete success of this method is by no means certain. Nevertheless, a potentially viable approach for quantifying PM emissions from unconfined sources such as plumes and industrial flares has been identified and demonstrated. It is recommended that the research continue to the next critical phase of demonstration of the diagnostic at distances relevant to an industrial flare plume measurement.
3
Table of Contents
Abstract ... 2
1.
Introduction ... 5
1.1 Particulate matter emission characterization from industrial flare plumes ... 5
1.2 Project description and objectives ... 6
2.
Background ... 7
2.1 PM composition of plumes from flares ... 7
2.2 Soot measurements in plumes ... 8
2.3 Auto-compensating LII ... 9
2.4 Retro-LII in the literature ... 12
2.5 Targets & challenges of the current retro-LII study ... 14
3.
Experimental set-up... 15
3.1 Investigation of the laser characteristics ... 15
3.2 Optical set-up ... 17
3.2.1. Laser aperturing ... 18
3.2.2. Collection optics ... 20
3.2.3. Optics in the demultiplexer box ... 21
3.3 Signal Processing ... 22
3.4 Source of soot: inverted burner from a methane/air diffusion flame ... 22
3.5 Far-field source of known concentration ... 23
4.
Results ... 25
4.1 Sensitivity of the set-up at 1.5 m ... 25
4.1.1. Sensitivity calculation with Mathcad ... 25
4.1.2. Evaluation of η constants ... 26
4.2 Soot concentration measurements ... 27
4.3 Test prototype on a far field source ... 27
5.
Perspectives ... 27
5.2 Laser-beam formation at far distances ... 30
5.3 Absolute calibration for measurement from a far distance ... 31
6.
Summary... 32
7.
Acknowledgements ... 33
5
1.
Introduction
1.1 Particulate matter emission characterization from industrial flare plumes
Airborne particulate matter (PM) is a primary atmospheric pollutant that is linked to serious health effects in humans1-2 and environmental damage3. PM is further implicated as an important component in climate forcing4 with at least one prominent study suggesting this effect may be as great as 55% of the current global warming effect of carbon dioxide5. In Canada, emissions of both PM10 (particulate matter less than 10 μm in size) and PM2.5 (less than 2.5 μm) are classed as criteria air contaminants (CAC) and are tracked in the National Pollutant Release Inventory (NPRI). However, despite the scientific need and legal requirement for characterizing, quantifying, and reporting PM emissions in industry, there are critical gaps in our ability to accurately obtain these data. This is especially true for unconfined sources of PM emissions such as industrial flares.
In the upstream energy industry, gas flares are commonly used to destroy unwanted flammable gas via combustion in an open atmosphere flame. Recent satellite imagery data suggest that global gas flaring associated with petroleum production exceeds 135 billion m3 annually6. Although flares are known to produce PM in the form of carbonaceous soot, direct quantification of these emissions remains elusive because by nature, flares are unconfined and emit directly into the open environment through a flame. Extractive sampling approaches are prohibitively challenging since flare plumes are inhomogeneous and both the relative amounts of species and overall degree of dilution vary within the plume7. Moreover, the plume itself is subject to atmospheric conditions surrounding it such that its position is generally unsteady. Optical measurement methods offer the promise of remote measurement of PM emissions, but to date little progress has been made in accurately measuring particulate emissions from flares.
The present project investigates the application of laser induced incandescence (LII), an optical diagnostic typically used for the measurement of PM in flames, optical engines, or extracted samples, for the determination of PM concentration levels in industrial flares. In typical implementations of LII, incandescent emission from soot particles is collected at close range and typically perpendicular to the axis laser excitation to maximize the sensitivity of the diagnostic. For the remote measurement of PM concentrations in unconfined industrial flares, it is not practical to work with a 90 degree laser excitation and detection system and placement of the emission detection optics at close range to the plume is also not feasible. Therefore an alternative optical arrangement where the laser excitation and emission detection axes are coincident or near coincident, will be considered. To differentiate the present diagnostic from traditional LII, we term it ‘remote LII’. The set-up is based on the auto-compensating LII (AC-LII) approach7 previously developed at the National Research Council (NRC) for close-range measurement of PM.
This document summarizes existing and developmental PM diagnostics intended for the qualification or quantification of PM concentration and emission rates from industrial flares.
The theory of auto-compensating LII is presented and a proof-of-principal implementation of a remote AC-LII is described and demonstrated on a soot plume of known concentration at a distance of 1.5 m. The present remote AC-LII set-up, arranged to fit in a laboratory setting, is useful to demonstrate key aspects of the experimental design and to evaluate sensitivity limits. In the final section of the report, extension of the remote AC-LII to distances relevant to industrial plume measurement is considered in terms of the system sensitivity as a function of plume size and distance, the detection optics, and laser beam shaping. It is shown that remote AC-LII would remain highly sensitive at a distance of 30 m, but that a key remaining challenge would be to deliver the laser beam to this location while maintaining a sufficiently small beam diameter to achieve the necessary laser fluence for LII.
1.2 Project description and objectives
Under the direction of Environment Canada and with additional support from Carleton University, and the National Research Council Institute for Chemical Process and Environmental Technologies (NRC-ICPET), this project was initiated to adapt auto-compensation laser induced incandescence (AC-LII), a highly sensitive refractory particulate matter diagnostic for the remote measurement of PM emissions from industrial flare plumes. As discussed below, there are some existing plume PM characterization methods presently in use which are based on plume opacity; however, these are qualitative in nature. A novel quantitative technique based on plume transmissivity is currently under investigation as part of a different PERD-UPAIRI activity and the present technique offers an alternative to that method which is not dependent on sky or sun conditions. This is the second year of the current project and specific goals and outcomes in the original project proposal include:
• Investigate development of a prototype open-path LII system o assemble prototype system
o test prototype system on near-field sources of known concentration o devise a far-field source of known concentration
o test prototype on far-field source
o refine design, components, analysis methods based on findings of near and far-field tests
• Outcomes
o prototype system
Results of this work are summarized within this report and the stated objectives and outcomes are addressed in the sections that follow. Based on the research, recommendations are made regarding key challenges and areas to focus research in the third year of the project.
7
2.
Background
2.1 PM composition of plumes from flares
Available data suggest that near-field composition of plumes from flares will be principally composed of gas phase species9-13 and low concentrations of flame generated soot aggregates9 Since laser induced incandescence heats refractory particles to elevated temperatures where a distinct incandescent emission is detectable, the diagnostic is insensitive to the gas phase species and to non-refractory particulate8. Depending on the composition of flared gas, some flares could also emit gas phase sulphur dioxide and oxides of nitrogen, which would have the potential to transform in the atmosphere to secondary particulate in the form of sulphate and nitrate aerosols14. However, the mechanisms and time scales of the potential conversion pathways are such that these secondary aerosols should not be a concern for measurements made in a plume immediately downstream of a flame15. Thus, for near-field measurements in flare plumes, LII measurements in the Vis-NIR should be sensitive to the presence of soot only. In this report PM and soot are used interchangeably as they are equivalent at the measurement location.
Flame generated soot consists of nearly spherical, carbonaceous primary particles which can be between 10 and 50 nm diameter, joined together in branch-like, open-structured aggregates. A sample of soot collected from a laboratory ethylene/air flame and imaged using transmission electron microscopy (TEM) is shown in Figure 2-1. Despite their complex geometry, it is now well-established16-19 that the interaction of light with soot aggregates is well described by Rayleigh-Debye-Gans Fractal Aggregate theory (RDG-FA). The theory, as it relates to auto-compensating laser induced incandescence is detailed in Section 2.3.
2.2 Soot measurements in plumes
Opacity measurements
Most regulatory standards for PM in plumes are based on a human-observed visual opacity
standard, as outlined in U.S. Environmental Protection Agency Method 920. Opacity is the degree to which transmitted light is attenuated, expressed on a percentage scale. For EPA Method 9; plume opacity is defined as the proportion of broadband sky-light that is blocked by a plume, as visually estimated by trained human observers. By nature, this technique is unavoidably subjective.
An attempt has been made recently to modernize the EPA Method 9 standard by replacing the human observer with a digital camera in a method referred to as Digital Opacity Compliance System (DOCS)21-23. In the DOCS approach, opacity is determined from digital images by
comparing the pixel intensity from regions containing unobstructed sky, to regions where the sky radiation is transmitted through the plume. Although DOCS provides an automated, more objective implementation of EPA Method 9, it remains a qualitative method, since broadband opacity is not directly relatable to PM emission rate.
Sky-LOSA
Another optical diagnostic is under development for soot concentration measurements in industrial plumes as part of another PERD UPAIRI activity which also involves a collaborative effort between Carleton University and NRC-ICPET. The method is a line-of-sight attenuation
diagnostic that uses sky light as light source. The method is called sky-LOSA15,24-26. The principle is similar to DOCS but the attenuation measurements are monochromatic (single wavelength selected with a narrow-band filter in the visible), allowing quantitative analysis of the transmission values. The interaction of soot with light is described by the Rayleigh-Debye-Gans theory for Fractal Aggregates (RDG-FA): soot concentration can then be quantified from soot morphology and extinction characteristics.
The method has been demonstrated with measurements in the exhaust of an inverted methane/air diffusion flame24,25. Sky-light was introduced in the lab via a mirror. The sky-LOSA method requires interpolation of the sky intensity within the plume region and the interpolation process is a potential source of error. The uncertainty of the method has been investigated in details with the lab-scale experimental set-up. The method claims an extinction sensitivity of 0.5%
(99.5% transmission) and a soot emission rate uncertainty below 40%. The 0.5% extinction
sensitivity would allow detection of soot emission rate as low as 0.5 mg/s for a 2 m-diameter plume with 4 m/s wind speed24.
Other error sources are expected in field measurements. For example transmissivity measurement interference induced by plume-scattering of direct sunlight. A polarization-based
9 approach is currently under investigation where polarization is used to preferentially attenuate the direct scattering and thus reduce this error26.
2.3 Auto-compensating LII
Laser-induced incandescence (LII) measurement is an emergent optical combustion diagnostic which can be used to determine the volume fraction and primary particle size distribution of soot27-33. In this technique, an intense laser pulse is used to heat soot aerosols to, or close to, their vaporization temperature. The incandescence signature from the soot is intense and short-lived as the particles rapidly cool to the ambient temperature principally through conductive cooling and in some cases sublimation. The emission intensity is proportional to the concentration of the soot, but it is also highly dependent on the soot temperature. This temperature dependence can be used to advantage when the decay of the incandescence is measured as a function of time and is used to predict the active surface area or effective primary particle size of the soot aggregates30-33. Conversely, the temperature dependence presents a challenge when trying to infer the particle concentration from the emission intensity, especially if the initial temperature of the soot before heating is unknown.
Two distinct strategies exist to overcome the temperature dependence of the measured emission. The first, often referred to as high-fluence or ‘plateau-regime’ LII28,34-36, involves imparting sufficient energy to the particles to ensure they reach a sublimation temperature of 4000 to 4500 K independent of their initial temperature, thus ensuring a spatially-uniform soot temperature distribution. Under this condition, a near-proportionality of emission intensity and concentration is assumed to exist when comparing soot from different locations in a flame or indeed different sources37,38. Plateau-regime LII requires calibration by comparing LII emission measurements to results from another calibrated technique (e.g. extinction measurements as in
39-42
, or cavity ring-down spectroscopy as in 43-46). These secondary techniques are either applied simultaneously or are used to quantify soot volume fraction in a reference flame that is subsequently used to calibrate the LII measurement.
The second strategy involves measurement of the temperature of the heated soot in real-time by two-color emission pyrometry8,33,47-48. Since the temperature of the soot is explicitly calculated based on measurements, it is not necessary to reach sublimation temperatures, and thus the diagnostic is less intrusive and less sensitive to in-flame laser attenuation8. Measurement of incandescence intensity shortly after the laser pulse is used to determine soot concentration while the temperature decay is used to determine soot morphology. The method is referred to interchangeably as auto-compensating or two-color LII (2C-LII). We use auto-compensating LII (AC-LII) here to avoid confusion with another LII variant by Schoemaecker-Moreau et al. also named 2C-LII49, which involves two laser wavelengths. AC-LII offers the significant advantage that calibration does not require comparison to other soot concentration diagnostics or to flames
of known concentration. The method is also better suited for morphology measurement, since high fluence LII has been demonstrated to significantly alter the interrogated soot50.
The underlying principle of AC-LII is two-color pyrometry. Soot temperature is first determined by the ratio of radiative emission intensity at two wavelengths and soot concentration is determined from comparison of the absolute emission intensity at either measurement wavelength and the theoretical emission intensity per unit volume of soot at the measurement temperature.
The interaction of soot with light is described by the Rayleigh-Debye-Gans theory for Fractal Aggregates (RDG-FA)16-18. The key component of this theory relating to LII is that the emission from soot nanoparticles is volumetric and thus scales linearly with the volume of soot present in the measurement volume. The theoretical emission per unit volume of soot at temperature Tp and at wavelength λ is8:
, 48 (1)
where c is the speed of light, h is Planck’s constant, and k is the Stefan-Boltzmann constant. Recognizing that practical detectors measure an integration of signal over a finite spectral range,
Ii, the signal measured by a photomultiplier tube (PMT) on channel i is then:
⁄ , d (2)
where fv is the volume fraction of soot, wb is the laser sheet thickness, Di is the background intensity reading measured just before the LII laser pulse and Ωi(λ) = τi(λ)Θi(λ), for which τi(λ) is the product of the optical transmissivities of the lens and filters and Θi(λ) is the photocathode responsivity, both of which can be determined from manufacturers’ specifications. This leaves only wavelength-independent terms relating to the detector package including: magnification of the collection optics, M; area of an aperture at the entrance of the demultiplexer box, Ap; area of the camera lens, AL; distance between the lens and the laser sheet, u; intensifier gain, αi; and microchannel plate sensitivity, i, which are hereafter grouped into a single term, ηi. The expression can then be rearranged to determine soot volume fraction as a function of signal intensity and temperature:
, Ω d (3)
The coefficient ηi can be determined from a calibration of the optical system using a radiant standard placed coincident with the measurement location according to:
11
, 4 Ω d , (4)
where Rs(λ) is the spectral radiance of a calibrated source, and Ilamp,i is the measured signal during calibration and Dlamp,i is the background measured with the lamp off. This calibration is performed for each wavelength to generate two calibration terms, ηi.
The ratio of LII signals from the two wavelength ranges corresponding to the two measurement channels provides an expression:
, Ω d , Ω d (5)
where fv and wb cancel in the ratio and temperature is the only unknown. However, determination of Tp is computationally intensive. To simply the calculations and allow explicit solution for Tp, an equivalent filter approximation is used8
The integrals over the filter transmission bandwidth in Eqs. (2) to (5) are functions of the filter transmission, the radiance signal, and the photocathode responsivity, since all these quantities can vary with wavelength. However, in practice, to a good approximation, we may replace these integrals with an equivalent filter with a center wavelength λC, a bandwidth ΔλC, and a response
Ωi(λC) where the bandwidth is defined as:
∆ ΩΩ d (6)
where the integration is over the total filter bandwidth and the center wavelength, λC, is defined such that Ω d Ω d . The integral in Eq. (2) can then be replaced by
, Ω . Similarly expressions can be used for Eqs. (3) and (5) where we replace spectral quantities by the appropriate center line value.
With the equivalent filter approximation, Eq. (5) can be solved for Tp. With Tp, Eq. (3) can then be solved using either the lower or upper wavelength intensity for fv. A key assumption of the equation development is that the laser heats the soot uniformly to a single peak temperature. This is only possible if the laser energy distribution (i.e. the laser fluence) is uniform across the cross-sectional area of the laser beam. The achievement of a ‘top-hat’ laser profile is discussed in Section 3.
All of the above equations are functions of time since the LII emission varies as the particles rapidly cool from near sublimation temperatures (4000-4500 K) down to ambient temperatures. Thus soot volume fraction is determined as a function of time, t, and the values over the first 100-200 nanoseconds are averaged.
A time resolved particle temperature is also determined. The temperature decay can be substituted into a heat transfer model that included the sensible energy of the soot particle, transition regime conduction heat transfer to the combustion gas51 and assumes negligible radiation heat transfer to the surroundings to calculate an effective soot particles diameter, dpeff:
MFP ,
(7)
where Ts and Tg are the soot and local gas temperatures, Ψ is the slope of a plot of ln(Ts –Tg) versus t over the time interval of 50 to 150 ns after the peak LII emission, P is pressure, ka is the thermal conductivity of air, Cs is the heat capacity of soot, ρs is the density of soot, G is the heat transfer factor, and λMFP is the mean free path. The heat transfer factor is calculated as G =
8f/α( +1) where f is the Euchen factor ( f =(9γ −5) / 4), α is the thermal accommodation coefficient of soot in the combustion gas, and is the adiabatic constant evaluated at the local gas temperature. The mean free path is defined as:
MFP
(8)
where R is the universal gas constant, Cv is the heat capacity of air, and W is the molecular weight of air. It should be noted that the effective primary particle diameter does not exactly represent the soot primary particle diameter because it does not account for the shielding effect on heat conduction between aggregated particles and the surrounding gas52. Instead it is a strong function of the primary particle diameter and a weak function of the number of particles per aggregate. Consequently it is not possible to know whether a change in measured dpeff is caused
by a variation of the primary particle size, aggregate size, or both without performing additional measurements (such as multi-angle light scattering experiments).
2.4 Retro-LII in the literature
LII diagnostics for remote monitoring has been developed for soot emission studies in the exhaust of aeroengines. The environmental and health impacts of soot emission from aircraft engines are a concern. Little data are presently available for the mass and morphology of the soot emitted by aeroengines. To fill this knowledge gap, studies have been performed over the past 10 years, including some involving LII experiments. However, the combustion and exhaust conditions in aeroengines are much harsher that in the case of gas turbines or automotive engines. In these environments, LII collection systems cannot be set up close to the exhaust of aeroengines. This limitation triggered the development of remote LII set-up capable of collection LII emission measurements from a distance.
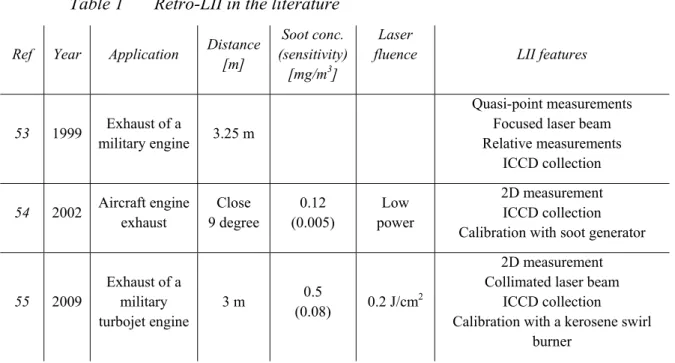
13 The first remote-sensing LII system used in exhaust of an aircraft engine was set-up by Black53. Both laser and LII collection axes were coincident. The laser beam at 1064 nm was focused in the plume with a 3-lens telescope, to achieve a quasi- point measurement; however, the length of the measurement volume would be long because of the long focal length of the telescope used to focus the laser at a distance of 3.25 m. The LII radiation was directed towards the collection optics via a large-dimension dichroic mirror. The set-up was compact and permitted fast alignment and fast laser scan across the engine exhaust. The compact system was set-up 3.25 m
away from the engine exhaust. The LII measurements were used to investigate emission trends without any calibration of the soot volume fraction.
Another compact LII system was designed by Jenkins et al54. The paper does not include details about the distance from the aeroengine exhaust to the ICCD collection camera. But the laser and collection axes are described as separated by a 9-degree angle, making the set-up geometry close to one of a compact remote-sensing set-up. The LII measurements were calibrated with a soot
generator. Soot concentration of 0.12 mg/m3 was measured; the paper claims a sensitivity of 5 µg/m3.
Delhay et al55. measured LII in the exhaust on an aeroengine from a distance of 3 m. The laser beam and the collection axis were combined using a beam splitter. The LII values were calibrated using a turbulent flame generated by a kerosene swirl burner. LII soot concentrations were measured down to 0.25 ppb (0.5 mg/m3). The limit of sensitivity of the system was
estimated to be 40 ppt (0.08 mg/m3).
The characteristics of the 3 published works are summarized in Table 1.
Table 1 Retro-LII in the literature
Ref Year Application Distance [m]
Soot conc. (sensitivity)
[mg/m3]
Laser
fluence LII features
53 1999 Exhaust of a
military engine 3.25 m
Quasi-point measurements Focused laser beam Relative measurements ICCD collection 54 2002 Aircraft engine exhaust Close 9 degree 0.12 (0.005) Low power 2D measurement ICCD collection Calibration with soot generator
55 2009 Exhaust of a military turbojet engine 3 m 0.5 (0.08) 0.2 J/cm 2 2D measurement Collimated laser beam
ICCD collection Calibration with a kerosene swirl
2.5 Targets & challenges of the current retro-LII study
Previously published works on remote-sensing LII demonstrated the principle with measurement distances up to 3 m in aeroengine expriments. Increasing the distance to the measured soot
source and the application of remote-LII measurements to other sources of PM, such as industrial plume sensing is an unexplored direction of research.
Moreover, in previous remote-LII studies, LII signals were collected at a single wavelength with time integration. In the latter two studies, soot concentration in the turbine exhaust was estimated based on the calibration of the systems using sources of known concentration. It is unclear that the calibration was relevant to the aero tests or what uncertainty the calibration introduced.
The two-color, time resolved approach used in AC-LII would be a substantial improvement to the existing remote-sensing LII set-up, offering self-calibrated measurement of soot concentration and effective primary particle diameter. While absolute light intensity calibration for the distances considered in Retro-LII is a challenging task, it seems an easier and more practical approach than using a control soot source in the case of in-field, far-distance soot measurements. Designing an absolute calibration procedure for remote soot sensing in
plume will be an essential aspect of the current project.
In summary, traditional measurement of plume PM emission from industrial flares are based on EPA Test Method 9, which is not a quantitative emission measurement, but rather a qualitative measurement of the visibility of a plume which is not relatable to the PM emission rate. More recent work based on spectrally resolved line-of-sight attenuation of sky-light shows promise, but is developmental and has known challenges such as measurement bias caused by plume scattering of direct solar irradiation. AC-LII is a diagnostic which has been successfully demonstrated in laboratory flames and extracted samples from various PM sources; however, to date has not been applied for a remote PM measurements. Single wavelength time gated retro-LII has been demonstrated for aeroengine exhaust measurement; however the range of the diagnostic was limited to ~3 meters and the diagnostics were dependent on calibration in a source of known concentration to achieve calibrated measurements in the aeroengine exhaust. There is both potential and challenge in developing a remote LII diagnostic which is based on AC-LII for application to industrial flares. The following sections of the report describe an initial set-up design and experimental demonstration of this approach.
15
3.
Experimental set-up
The current project aims at designing a remote-sensing LII set-up capable of applying the AC-LII approach for application to soot measurement in industrial plumes. The objectives for the remote AC-LII setup are:
• Soot heated up with a homogeneous laser beam. • Time-resolved LII collection at two wavelengths.
• Remote-AC-LII emission collection in a configuration that can be scaled to longer
distances.
The present report describes preliminary experiments that demonstrate the remote-AC-LII approach. For this proof-of-concept experiment, and due to space constraints in the laboratory, the source of soot was placed at a relatively close distance of 1.5 m. This distance remains fixed for all the experiments described here. The extension of the diagnostic to longer distances is the subject of Section 5.
Section 3describes various aspects of the experimental set-up. It gives details about the new laser head that was used. It describes the elements of the optical set-up, including the laser-beam formation optics, the collection optics and the collection filters. It also describes briefly the source of soot used for the first remote AC-LII measurements.
3.1 Investigation of the laser characteristics
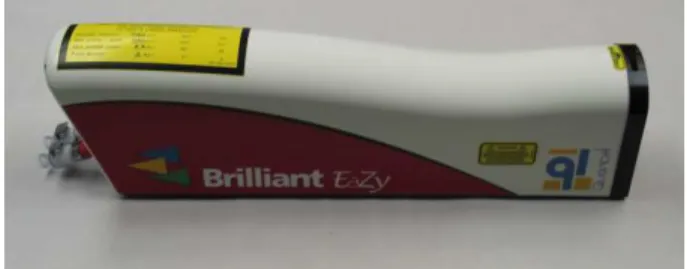
The remote AC-LII project uses a newly received laser head: Brilliant EaZy laser from Quantel (Figure 3-1). The Brilliant EaZy is a Nd:YAG laser providing a 1064 nm radiation, up to
330 mJ/pulse at 10 Hz. The laser set-up also includes a polarization-based energy controller, which allows reduction of the laser-pulse energy without modifying the Q-switch – Flashlamp delay.
Figure 3-1. Laser head of the Brilliant EaZy laser from Quantel
As explained in Section2.3, interpretation of AC-LII emission signals is greatly simplified if the particles are first uniformly heated to the same peak temperature. Uniform heating necessitates
a homogeneous laser-beam fluence profile in the measurement volume. Several strategies exist to create homogeneous laser profiles, but perhaps the simplest involves filtering the edges of the laser profile using an aperture in the laser path and then imaging this aperture plane to the
measurement volume such that any diffraction caused by the aperture is re-imaged and thus minimized. However, the uniformity of the final beam is only as good as the uniformity of the laser radiation which passes through the aperture (i.e., the light which is not filtered). Hence, it is important to know the evolution of the laser beam profile along the beam path so that the aperture can be placed in an appropriate location.
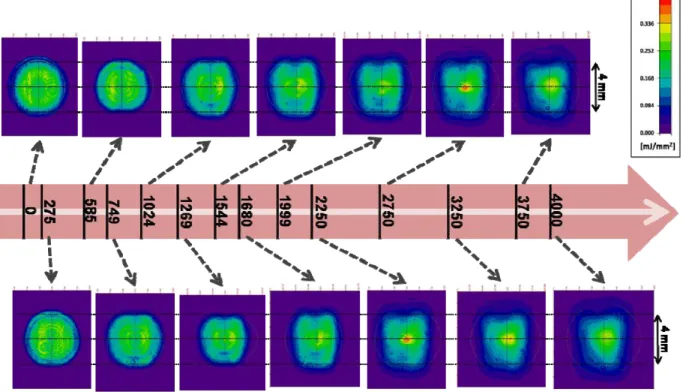
In the present case, the laser beam profile was monitored with a Beamview CCD camera. Profiles were investigated from the laser head exit to a distance of 4 m. It is evident from the laser beam profiles displayed in Error! Reference source not found., that the beam does not follow a typical Gaussian profile. From 0 to 1000 mm away from the laser head, the laser profile shows two clear stripes, symmetric to the center of the beam. After 1000 mm, a hot spot of high laser fluence forms at the center of the beam while at the same time, the overall laser beam diameter increases.
Even though the laser beam has a somewhat irregular fluence distribution, it can be aperture for Even though the laser beam has a somewhat irregular fluence distribution, it can be aperture for LII applications. Approximately 500 mm away from the laser head, the beam profile shows two parallel stripes, with lower fluence at the center. While not entirely homogeneous, the central portion shows a 15% inhomogeneity (Figure 3-3) which is reasonable for AC-LII. At this location, a relatively high laser through-put is possible while achieving a relatively homogeneous (85%) beam. Similar beam characteristics are observed in the range of 500 to 1000 mm away from the laser head, and so this range is used when selecting the optimal position of the aperture.
Figure 3-2. Laser beam profile along the beam path. The distances are in mm. The profiles are displayed with the same fluence color scale.
17
Figure 3-3. Laser fluence profiles at various locations [in mm] along the beam path
The investigation of beam profiles along the laser path has lead to a library of beam profiles at various locations. These profiles can be used to evaluate the beam homogeneity for various aperture sizes, allowing a proper selection of the aperture dimension and geometry. More details of the optical set-up are given in Section 3.2.
3.2 Optical set-up
The optical set-up of the retro-LII experiments includes two aspects: the laser-beam shaping and the collection of the LII signal. Both aspects depend on the distance to the measured source of soot, presently placed 1.5 m away from the optical set-up, as described at the beginning of section 3
Figure 3-4. Optical set-up, including the Brilliant EaZy laser (left-hand side) and the demultiplexer box (right-hand side).
0.00 0.05 0.10 0.15 0.20 0.25 0.30 0.35 0.40 -3 -2 -1 0 1 2 3 L a ser f lu en ce [m J /m m 2 ] Distance [mm] 479 1544 2430
3.2.1. Laser aperturing
The optical set-up is presented in Figure 3-5. It includes an aperture used to select a homogeneous area of the laser beam as well as a lens to image the aperture plane at the location of the soot source. Four mirrors are used on the optical table in order to obtain a laser path that meets the following criteria:
• The distance from the imaging lens to the soot source is set by the targeted lens
magnification.
• The distance from the lens to the laser aperture is set so that the formed imaged is in
focus at the measurement location.
• The distance from the laser head to the laser aperture must be between 500 to 1000 mm so that the center of the beam profile is sufficiently homogeneous (section 3.1)
NOTES
Q: Quantel Brilliant Eazy head M1 M2 M3 M4 A: Beam aperture L: Lens f = 400 mm LASER B
I: Inverted burner nozzle
B: LII emission demultiplexer box X_A 237 2 8 0 1500 2020 2 .9 ° 339 290 190 A L Q I
Figure 3-5. Optical set-up for the retro-LII measurements at 1.5 m
The size of the laser aperture can also be varied with the constraint that a large aperture
reduces the homogeneity of beam imaged at the soot source, while a small aperture reduces
the total laser energy available for soot heating.
We selected a square aperture of 2.5 mm width placed approximately 700 mm away from
the laser head along the beam path. The square shape was chosen to simplify the evaluation of the probe volume. The probe volume is defined by the intersection of the laser beam volume, now defined as a cuboid due to the square aperture, and the light collection volume which is a cylinder due to the optics used for the LII emission measurement. The intersection of a cuboid and a cylinder is easier to evaluate than the intersection of two cylinders, in particular when the intersection angle is small.
We targeted a beam magnification of 4 such that the final beam width and height at the
probe volume would be 10 mm. The lens was installed after the last mirror in order to avoid burning mirror surfaces with a focused beam; hence the distance to the soot source was
19
constrained such that it had to be below 2050 mm. Various focal length values were then compared, as presented in Figure 3-6. It was determined that a 400 mm-focal length lens placed 2000 mm away from the soot source and 500 mm away from the aperture met the criteria that the laser aperture fell in the range of 500 to 1000 mm from the laser head and a 4:1 magnification was achieved in the measurement volume.
Figure 3-6. Distance from magnifying lens to the measurement location as a function of the targeted magnification. Plot for various focal lengths.
The beam profile at the location of the measurement is presented in Figure 3-7. The beam exhibits the desired sharp edges with a length and height of 10 mm. The variation within the square is consistent with the variation observed in the center of the beam at the location of the aperture (Figure 4.4).
Figure 3-7. Laser-beam profile at the location of the soot source. Intensity scale in arbitrary unit. 1600 1700 1800 1900 2000 2100 2200 3.5 4 4.5 5 5.5 Le ns t o c o ll ec ti o n vol um e [m m ] Magnification 350 400 375
3.2.2. Collection optics
Collection lenses and collection aperture
The LII signal is collected with a 300 mm focal length, 75 mm diameter lens which focuses the LII emission signal onto an aperture that defines the collection volume at the measurement location. The emission that passes through the aperture is collimated and then enters the signal demultiplexer box. Inside the box, the signal is split into a blue (445 nm) and a red (753) channel using a series of dichroic mirrors and narrow band interference filters. The light collection aperture was circular with a diameter of 2 mm and the magnification was 1:4
such that the diameter of the light collection aperture image at the soot source was 8 mm. The collection volume is studied in more details in the following paragraph.
Collection volume
Since the intersecting volume of the laser and the plume has a depth which is not insignificant due to the shallow angle between the two axes, depth-of-field issues in the LII emission detection optics must be considered. A collection diameter of 8 mm diameter is only valid at 1.5 m where the image of the aperture is formed by the collecting lens and the collection volume gets wider fore or back of the image plan. The variation of the collection volume over this intersection distance can be a source of uncertainty for the measurement since overlap over the full depth of the measurement is needed in order to fulfill requirements of the auto-compensating approach. Therefore the collection volume was measured in order to verify this condition.
The collection volume was measured by back illuminating the light collection aperture and measuring the light spot at various distances from the collection lens. The aperture was illuminated homogeneously with a 4” diameter integrating sphere and tungsten lamp combination. An image of the light transmitted by the LII-emission collection lens was acquired as a function of distance from the lens with a Beamview camera. The measurements were performed at each of the two wavelength intervals used during LII emission measurements (445 nm and 753 nm); the two monochromatic illuminations were obtained by placing the required collection filter in front of the integrating sphere. Measurement at the two wavelengths was a way to verify the achromaticity of the collecting lens: the collection volume must remain the same for both collection channels in order to measure the same volume of soot.
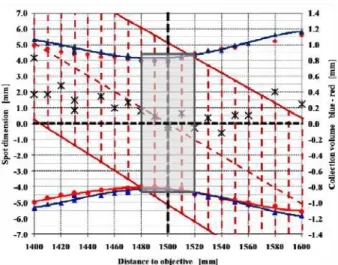
The diameter of the collection volume is plotted for the two channels in Figure 3-8. The plot also shows the position of the beam path, taking into account the 2.9 degree-angle between the two axes. The collection volume for the two channels has the same diameter within 0.1 mm
from 1480 to 1560 mm away from the collection lens. The measured soot flow will have to remain within this range. The laser beam overlaps completely with the collection volume
from 1480 to 1520 mm away from the collection lens. It should then be possible to measure soot concentration flowing from a 40 mm-diameter outlet.
21
Figure 3-8. Diameter of the collection volume as a function of the distance to the objective lens. Red spot: collection volume for 445 nm. Blue triangles: collection volume for 753 nm. Black crosses: 445 nm diameter – 753 nm diameter (secondary axis). The red-dashed area shows the laser path. The grey rectangle indicates the area where the collection volume is fully filled with laser.
3.2.3. Optics in the demultiplexer box
Figure 3-9. Demultiplexer collection box
The demultiplexer is presented in Figure 3-9. The collected LII signal is sent to the two Photomutliplier (PM) boards via dichroic mirrors. The wavelength selection of each channel is done by band pass filters:
• Filter centered at 445.19 nm with 62.04 nm width • Filter centered at 753.37 nm with 47.30 nm width
Both signals are recorded over time. The time-resolved signals are used for the evaluation of the soot peak temperature, soot concentration and primary particle diameter, as explained in description of AC-LII in section 2.3.
3.3 Signal Processing
The output signal of the photomultiplier tubes must be converted into a digital format before the data can be processed. Since the soot cools to ambient temperatures over the period of hundreds of nanoseconds, fast A/D conversion is required. Since the emission intensity is strong function of temperature, the signal intensity drops over several orders of magnitude, and a large dynamic range is also required. Artium Technologies Incorporated, which is the licensee of the patent for the AC-LII method developed at NRC, produces and A/D board optimized for LII signal measurement (10 ns/time division, 12-bit A/D, strong noise suppression) and an associated software, AIMS, which allows real-time signal processing, thus allowing determination of soot volume fraction and effective particle size at the rate of the laser (10 Hz). Use of the Artium A/D board and AIMS software is considered to be the optimal choice for the Remote AC-LII diagnostic, keeping in mind the need for good signal to noise to improve sensitivity and an easy hardware interface suitable for a field ready diagnostic.
In the event that further data examination is desired, the AIMS software allows for the export of the raw LII signals so that post-processing can be done using analysis code developed by the user.
3.4 Source of soot: inverted burner from a methane/air diffusion flame
Measurements were performed on a soot plume generated from an inverted co-flow non-premixed burner developed by Coderre et al.56 following the design described by Stipe et al.57. As shown in Figure 3-10, methane is introduced at the top of the burner via port 1. The oxidizer, co-flow air is introduced into the annular region between the fuel jet and the outer quartz tube (port 2). A secondary dilution air is introduced at the bottom of the quartz tube (port 3) in order to dilute, cool down and mix the exhaust gas. With the inverted design, the upward buoyant force from the hot combustion products maintains a uniform downward flow that stabilizes the flame. A converging nozzle is placed at the exhaust outlet (port 6) to reduce the plume diameter from 50.8 to 12.7 mm. The optical diagnostics on the exhaust plume are applied above the converging nozzle and at this location the combustion products are well-mixed and the flow is uniform.
23
Figure 3-10. Schematic of the inverted co-flow burner.
3.5 Far-field source of known concentration
A necessary component for the demonstration of remote AC-LII at distances relevant to plume measurements is a controlled soot source of known concentration and with dimensions relevant to the plume of a full-scale flare. Creation of a soot plume with a diameter of 1 to 2 meters is simply not practical in a laboratory setting; however, creating a confined aerosol of soot which is 1 to 2 meters in length is a more realizable objective.
The inverted flame selected for the initial characterization of the remote AC-LII at near distances produces a soot aerosol plume 2 inches in diameter with a known concentration. By attaching a ‘T’-piece to the end of the exhaust tube and adding horizontal sections of pipe to the branches of the ‘T’, the soot aerosol will be forced to flow horizontally such that it fills the horizontal length of the pipes before exhausting vertically at the end. By adjusting the length of the horizontal pipe sections, plumes of varying diameters could be simulated. A sketch of the far field source is included inFigure 3-11. Since the laser axis and detection axis become increasingly coincident as the distance from the system to the plume increases, it will be possible for the laser to propagate the length of the tube and for the detection optics to also see along this same length.
Figure 3-11. Set-up for the long distance testing of the prototype remote-AC-LII system. Sketch for concept.
25
4.
Results
4.1 Sensitivity of the set-up at 1.5 m
4.1.1. Sensitivity calculation with Mathcad
The Environmental Sensors Project of NRC/ICPET has implemented various AC-LII setups for in-flame an extractive PM measurements. Most relevant to the present work is the High Sensitivity Auto-Compensating LII (HS-LII) setup which was developed to measure ambient level PM concentration. The HS-LII set-up is able to detect soot concentration down to
0.01 ppt or 20 ng/m3, but the value of 100 ng/m3 was used here as a reference. In developing the remote-AC-LII emission detection optics and receiver, various aspects of the design and efficiencies realized with the HS-LII system were duplicated. It is therefore possible to extrapolate an expected sensitivity of the retro-LII set-up from the sensitivity achieved with the HS-LII system, comparing the properties of the optical components involved in the two set-ups. The sensitivity was calculated with a Mathcad sheet.
The collection efficiency is the key factor that limits the sensitivity of the retro-LII set-up because of the distance to the measured soot source. The optical efficiency of the collection optics is controlled by the f-number of the focusing lens as well as the aperture diameter; where the later parameter defines the diameter of the probe volume. Both parameters are presented for HSLII and retro-LII in Table 2. The relative efficiency of the two set-ups is then evaluated by taking the square of the f-number (amount of collected light) and the square of the radius (size of the measured area). The retro-LII set-up will collect approximately 135 less light than the
HSLII set-up for a comparable measurement depth.
Table 2 Comparison of the optical characteristics of the collection set-up for HS-LII and retro-HS-LII.
Set-up f-number Probe volume diameter [mm] TOTAL HS-LII 3.75 16 remote AC-LII @1.5 m 21.75 8 Sensitivity ratio HS-LII / remote AC-LII 33.6 4 134.6
But the intensity of the LII signal also depends on the depth or thickness of the probe volume since the total signal is proportional to the measurement volume. In the case of the HS-LII set-up, the probe volume is defined by a light-sheet crossing the collection axis and the depth of the probe volume is characterized by an equivalent width of the laser sheet as well as the angle between the collection axis and the laser path. In the case of the retro-LII set-up, the laser-beam
and the collection overlap all along the depth of the soot flow. The depth of the probe volume
is then defined by the width of soot flow, e.g. the width of the plume of the width of the outlet. In the present retro-LII experiments, the exhaust flowed through a half-inch diameter nozzle. This corresponds to 11.86 mm equivalent width by taking into account of the cylindrical shape of the flow. The equivalent width was 8.339 mm in the case of the HS-LII set-up. The
sensitivity of the retro-LII is then increased by 50% compared to HS-LII because of the wider probe volume.
Hence, the present remote AC-LII set-up should be 95 times less sensitive than the HS-LII set-up and the target detection limit is thus 95 g/m3 or 5 ppt.
Soot concentration is expected to be in the range of 110 to 130 mg/m3 in the exhaust of the inverted burner used with methane. Therefore the remote AC-LII set-up should have ample sensitivity for LII emission detection in this configuration.
4.1.2. Evaluation of η constants
Absolute calibration was performed for each of the two wavelength channels by using a 4” calibrated integrating sphere and tungsten lamp system as a light source. The integrating sphere was placed 1.5 m away from the collecting lens. The calibration yielded η constants which are used to relate the measured voltages on the PMTs to radiation emission levels in Watts/m3 ster at the measurement wavelength. The values are compared to η constants measured for the HS-LII set-up. Both sets of constants are presented in Table 3. The retro-LII set-up is estimated to be
300 less light-efficient than the HSLII set-up. This is twice lower than the extrapolated value that was presented in the previous paragraph for the amount of collected light (i.e., 135 less collected light). It is unclear at this time whether the discrepancy comes from differences in the calibration method or simply a difference in the two systems which is not accounted for in the simple extrapolation calculation. This aspect will be investigated further, including a recalibration of the HS-LII system using the same calibrated light source used for the remote AC-LII system.
Table 3 η constants for the HSLII and the retro-LII set-ups (in W.m-3.V-1).
Channel #1 445.19-nm Channel #2 753.37-nm HSLII 7.991 x 10⁵ 1.172 x 10⁷ Retro-LII 2.771 x 10⁸ 3.310 x 10⁹ Retro-LII / HS-LII 347 282
27
4.2 Soot concentration measurements
Soot concentration was measured in the exhaust of the inverted burner for two laser fluencies (86 and 112 mJ/mm2). The values for the peak temperature, soot volume fraction and primary particle diameter are listed in Table 4The table also includes reference values for the inverted burner: peak temperature measured in 2009 using another AC-LII setup at NRC, referred to as Mobile-II, soot volume fraction measured with physical sampling and gravimetric analysis58, and primary particle diameter obtained from TEM analysis58.
The peak temperatures are slightly lower than the values obtained with Mobile II, which could relate to small differences in the absolute intensity calibrations or in the calibration of the laser fluence. The measured soot volume fraction varies with laser fluence which is a known anomaly of the AC-LII method when applied to cold soot sources. Work is ongoing at NRC to resolve this problem. Though extensive comparisons, it has been found that best agreement of AC-LII from cold sources to other measurement methods (such as gravimetric analysis) are achieved when the soot is heated closer to its sublimation temperature. It suggests that, in the present case, the measurement obtained at a laser flence of 112 mJ/mm2 is more representative. Thus, the remote AC-LII presently over-estimates the concentration by about 70%. This finding is somewhat consistent with the observed underprediction of the sensitivity of the diagnostic as observed in Section 4.1.
It is evident that future work must include validation of the alignment and calibration of the remote AC-LII system as well as the HS-LII system, and the burner mass flow controllers and emission rate must be confirmed. Nonetheless, this first proof-of-concept test is highly encouraging with initial measurements in the correct range.
Table 4 Retro-LII measurement in the inverted burner used with methane and air
Laser fluence [mJ/mm2] 86 112
Peak temperature [K] Remote AC-LII 2556 2819
Mobile II 2875 3250
Soot volume fraction [ppb] Remote AC-LII 67.5 111.8
Gravimetric58 64.7
Primary particle diameter [nm] Remote AC-LII 37.4 39.3
TEM58 38.7
4.3 Test prototype on a far field source
The objectives for the second year of the project, as outline in the original project proposal include the testing of the prototype on a far field source. Due to delays in the launch of the project reported in the first year, this objective was not met and will be added to the objectives of the third year of the project.
The present project aims at applying remote AC-LII to soot concentration measurements in industrial plumes. This would require using experimental set-ups away in non-lab conditions, placed 20 to 30 m away from the measured plume. Various modifications will have to be made on the current experimental set-up in order to meet the requirements. This section gives a brief overview of the aspects that need to be investigated before obtaining a field-ready remote AC-LII set-up.
5.1 Sensitivity of the set-up with telescopes
The amount of collected light is one of the main concerns for remote AC-LII measurements when the distance to the soot source increases: the amount of light is inversely proportional to the square power of the distance to the light source. The amount of collected light directly influences the sensitivity of the set-up. The collection efficiency of the set-up must be taken into account in the optical design.
In order to compare various optical solutions, the sensitivity of the system was predicted as a function of the collecting lens characteristics. The optical model was similar to the model used for the sensitivity analysis at 1.5 m, with the HS-LII sensitivity used as a reference (section 4.1). The following assumptions have been made in the sensitivity evaluation:
• The laser beam illumination is homogeneous with a fluence of 2 mJ/mm2
. • The collection volume has a diameter of 11 mm.
This value is reasonable considering the properties of the Brilliant EaZy laser: since the laser can deliver up to 330 mJ/pulse, and so should deliver 2 mJ/mm2 fluence for a beam diameter up to 14.5 mm.
The collection volume is only controlled by the focal length of the collecting lens and the aperture diameter. In practical, adjusting the aperture diameter would not be difficult in order to obtain a 11 mm-diameter collection volume for a given collection lens.
• The equivalence width of the probe volume was set to 2 m.
This corresponds to a laser beam path through the center of a 2 m-diameter plume. This seems a reasonable range for an industrial plume.
• The level of collected LII signal was calculated taking into account the probe volume dimension as well as the clear aperture of the collecting lens.
• The LII signal level was then compared to the signal level for the HS-LII measuring a
0.1 g/m3 soot concentration (5 times the proven detection limit of the HS-LII system. This provides the sensitivity of the remote AC-LII.
• Sensitivity was evaluated for remote AC-LII systems placed from 5 to 30 m away from
29
Commercial telescopes seem an interesting solution as collection optics since they include collection lens with large diameters. Moreover, the price of such systems is must lower than the rates for large lens diameters proposed by usual scientific optic manufacturers. The optical properties of such commercial lenses will have to be checked carefully, especially their achromaticity, but this solution seems worth investigating. Various telescopes have been considered for the sensitivity evaluation, with lens diameter ranging from 102 to 406 mm (4 to 16”). The characteristics of the telescopes are presented in Table 5
Table 5 Characteristics of the commercial telescopes used for the sensitivity evaluation. Indicative price taken from www.telescopes.com
Model Manufacturer Lens aperture [mm] Focal length [mm] f-# price
NexStar 4SE” Celestron 102 1325 13 $499
NexStar 5SE” Celestron 125 1250 10 $699
NexStar 6SE” Celestron 150 1500 10 $799
NexStar 8SE” Celestron 203.2 2032 10 $1199
16” LX200-ACF Meade 406.4 4064 10 $9999
The sensitivity of the various set-ups is plotted as a function of the plume distance in Figure 5-1. In addition to the 5 telescopes, the plot also includes a 3”-diameter lens, the lens dimension that has been used for measurements from a distance of 1.5 m. The sensitivity of the retro-LII set-up with a 3”-diameter lens would be 5.1 g/m3 at 20 m and 11.4 g/m3 at 30 m. With a 6”-diameter telescope, the sensitivity would be 1.1 and 2.5 g/m3 at 20 and 30 m. A 16”-diameter
telescope should allow soot concentration measurements down to 0.15 and 0.35 g/m3 at 20 and 30 m.
Determining of the necessary sensitivity limit is challenging since there are very few references in the literature to quantitative emission measurements from industrial flares. The literature which does exist does not directly report data on mass emission rates of soot and anyways considers very heavily sooting flares which would not be representative of some the more challenging measurement conditions, such as solution gas flares, for which PM emissions are known to be very low. Equally, there are few examples of other diagnostics suitable for remote PM emissions from industrial flares to compare against. A single exception is the sky-LOSA
diagnostic developed by Johnson and coworkers25 which reports a sensitivity limit of about 0.5 mg/s for an industrial flare with a diameter of 2 m and wind speed of 4 m/s.. This target corresponds to a concentration of 25 ug/m3. All of the telescopes shown here should be able to measure soot concentration for such emission rates.
Figure 5-1. Sensitivity of the retro-LII set-up as a function of the distance to the plume. Soot measurement for a plume diameter of 2 m. Analysis for commercial telescopes.
5.2 Laser-beam formation at far distances
Laser beam shaping is another issue for remote AC-LII measurements at far distances. Homogeneous and sufficient soot heating is one required condition for the AC-LII procedure.
Providing a fluence of 2 mJ/mm2 in a homogeneous 11 mm diameter beam is not a challenge in terms of the necessary laser energy, but could be difficult to achieve at a distance of 20 to 30 m from the laser head. Furthermore, the fluence profile should remain constant across the width of the plume. Using a single focusing lens might be a limited approach in order to fulfill this goal. Various options will have to be investigated and it may be necessary to allow the beam to expand to a large diameter at the measurement volume. This would decrease spatial resolution while increasing sensitivity, but would ultimately require more laser energy in order to meet the target laser fluence of 2 mJ/mm2. Designing a flexible beam forming set-up might be crucial for practical applications, where the distance to the measured plume is not controlled and often not known precisely.
The outdoor use of high power laser beams also raises safety issues, especially with the 2 mJ/mm2 targeted fluence. Open-air laser use is not allowed without specific authorizations granted by Transport Canada. The later is in charge of laser outdoor allowances because of possible airplane accidents induced if a laser beam reaches the cockpit. Such laser authorizations
0.01 0.10 1.00 10.00 0 5 10 15 20 25 30 M in im u m s o ot c on ce n tr at io n [u g/ m 3 ]
Distance to the soot source [m]
Celestron NexStar 4SE lens Celestron NexStar 5SE HS-LII
Celestron NexStar 6SE Meade 16" LX200-ACF Celestron NexStar 8SE
31 are common for LIDAR experiments that shot laser beams to the atmosphere. First contacts have been made with Kevin Strawbridge of Environment Canada, who has experience of practical LIDAR application. More details will have to be collected and the exact remote AC-LII procedure will have to be defined carefully before initiating contacts to Transport Canada. But safety issues are a key aspect for the practical application of remote AC-LII in industrial sites. Finally, the remote AC-LII method would provide a measure of the amount of soot present along one line of sight through a plume. In order to achieve a full characterization of the plume emission rate, it would be necessary to scan the LII system across the width of the plume rapidly and also have information about the velocity of the plume perpendicular to the measurement plane.
5.3 Absolute calibration for measurement from a far distance
Another challenge for long distance remote AC-LII is the absolute light intensity calibration procedure. In typical AC-LII measurements, the LII collection system is calibrated with an integrating sphere whose light intensity is known with high accuracy. The integrating sphere is placed at the very location where soot will be measured in order to reproduce the measurement conditions. Applying the same approach seems unlikely if the soot source is found 30 m away from the collection box. Solution to this problem likely involves extrapolation of the calibration values from calibration measurements made from closer distance. A new calibration process will have to be defined and validated based on simple test cases.
6.
Summary
This project was initiated to complete a preliminary investigation of a novel technique for quantifying soot (PM) emissions in flare plumes. The proposed technique is centered on the auto-compensating laser induced incandescence optical diagnostics (AC-LII), but configured for remote measurement of LII emission from a soot plume and named ‘remote AC-LII’.
The theory of AC-LII was presented and the literature on remote-LII was reviewed. The key features and targets of a new remote AC-LII were then defined. An inverted flame which produces a plume of known concentration was used as a sample plume to test the plume at close range. The sensitivity of the remote AC-LII system was ample to measure the LII emission from the plume; and the preliminary results were correct to within a factor of 1.7. Further work is needed to verify the operating conditions of the burner and the absolute light intensity calibration of the remote AC-LII system in order to improve the agreement of the measurement. A small modification of the inverted flame allows the creation of a soot aerosol of variable length which will be well suited for testing of the remote AC-LII system at distance more representative of a field measurement.
An analysis of the present sensitivity of the system and an extrapolation of this sensitivity to a field setting indicated that the remote AC-LII system would have higher sensitivity than the Sky-LOSA diagnostic; however, a key challenge which has not yet been addressed is the delivery of a homogeneous small diameter laser beam at a distance of 30 meters. Another identified challenge is the safe use of a laser in an outdoor setting in compliance with Transportation Canada guidelines.
Therefore significant and difficult challenges remain in the further development of this novel technology for remote quantification of PM emissions and complete success of this method is by no means certain. Nevertheless, based on our research, we believe we have identified a potentially viable approach for quantifying PM emissions from unconfined sources such as plumes and industrial flares. It is recommended that the research continue to the next critical phase of demonstration of the diagnostic at distances relevant to an industrial flare plume measurement.
33
7.
Acknowledgements
This project has been supported by Natural Resources Canada (project manager Mr. Michael Layer), Carleton University, and the National Research Council of Canada Institute for Chemical Process and Environmental Technologies (NRC-ICPET). The authors are indebted to Michael Layer, Natural Resources Canada, whose support was critical to the success of this project, Mr Bob Sawchuk who provided significant technical support and training for the NRC AC-LII systems, and Dr. Pascale Desgroux, Dr. Dave Snelling, and Mr. Brian Crosland for fruitful discussions on the development of a remote system and theoretical development of the governing equations for AC-LII.