HAL Id: hal-01190508
https://hal.archives-ouvertes.fr/hal-01190508
Submitted on 29 May 2020
HAL is a multi-disciplinary open access
archive for the deposit and dissemination of
sci-entific research documents, whether they are
pub-lished or not. The documents may come from
teaching and research institutions in France or
abroad, or from public or private research centers.
L’archive ouverte pluridisciplinaire HAL, est
destinée au dépôt et à la diffusion de documents
scientifiques de niveau recherche, publiés ou non,
émanant des établissements d’enseignement et de
recherche français ou étrangers, des laboratoires
publics ou privés.
Distributed under a Creative Commons Attribution| 4.0 International License
aestivum L.)
Caroline Pont, Florent Murat, Carole Confolent, Sandrine Balzergue, Jerome
Salse
To cite this version:
Caroline Pont, Florent Murat, Carole Confolent, Sandrine Balzergue, Jerome Salse. RNA-seq in grain
unveils fate of neo- and paleopolyploidization events in bread wheat (Triticum aestivum L.). Genome
Biology, BioMed Central, 2011, 12 (12), �10.1186/gb-2011-12-12-r119�. �hal-01190508�
R E S E A R C H
Open Access
RNA-seq in grain unveils fate of neo- and
paleopolyploidization events in bread wheat
(Triticum aestivum L.)
Caroline Pont
1†, Florent Murat
1†, Carole Confolent
1, Sandrine Balzergue
2and Jérôme Salse
1*Abstract
Background: Whole genome duplication is a common evolutionary event in plants. Bread wheat (Triticum aestivum L.) is a good model to investigate the impact of paleo- and neoduplications on the organization and function of modern plant genomes.
Results: We performed an RNA sequencing-based inference of the grain filling gene network in bread wheat and identified a set of 37,695 non-redundant sequence clusters, which is an unprecedented resolution corresponding to an estimated half of the wheat genome unigene repertoire. Using the Brachypodium distachyon genome as a reference for the Triticeae, we classified gene clusters into orthologous, paralogous, and homoeologous
relationships. Based on this wheat gene evolutionary classification, older duplicated copies (dating back 50 to 70 million years) exhibit more than 80% gene loss and expression divergence while recent duplicates (dating back 1.5 to 3 million years) show only 54% gene loss and 36 to 49% expression divergence.
Conclusions: We suggest that structural shuffling due to duplicated gene loss is a rapid process, whereas functional shuffling due to neo- and/or subfunctionalization of duplicates is a longer process, and that both shuffling mechanisms drive functional redundancy erosion. We conclude that, as a result of these mechanisms, half the gene duplicates in plants are structurally and functionally altered within 10 million years of evolution, and the diploidization process is completed after 45 to 50 million years following polyploidization.
Background
More than 40 years ago, based on a few protein sequences from vertebrates, Susumu Ohno proposed polyploidization as a major source of new biological pathways created from duplicated gene copies [1]. The vertebrate genomes can be considered as paleopoly-ploids that had become modern dipaleopoly-ploids by means of ancestral chromosome fusions as well as sequence diver-gence between duplicated chromosomes. Recent paleo-genomic analyses in plants have confirmed and refined Ohno’s conclusions and led to the identification of poly-ploid common ancestors, showing that present-day spe-cies have been shaped through several rounds of whole genome duplications (WGDs), small scale duplications
(SSDs) as well as copy number variations (CNVs) of tan-dem duplicated genes followed by numerous chromo-some fusion (CF) events leading to the their present-day chromosome numbers [2-4]. Duplicate genes that per-sisted in multiple copies diverged by differentiation of sequence and/or function. Overall, recurrent gene or genome duplications generate functional redundancy followed either by pseudogenization (that is, unex-pressed or functionless paralogs), concerted evolution (that is, maintained function of paralogs), subfunctiona-lization (that is, partitioned function of paralogs), or neofunctionalization (that is, novel function of paralogs) during the course of genome evolution. Functional divergence either by subfunctionalization or neofunctio-nalization of duplicated genes has been proposed as one of the most important sources of evolutionary innova-tion in living organisms [5]. As a consequence, poly-ploidy followed by diploidization is a major mechanism that has shaped complex regulatory networks during the
* Correspondence: jsalse@clermont.inra.fr † Contributed equally
1
INRA, UMR 1095, Genetics, Diversity and Ecophysiology of Cereals, 234 avenue du Brézet, 63100 Clermont-Ferrand, France
Full list of author information is available at the end of the article
© 2011 Pont et al.; licensee BioMed Central Ltd. This is an open access article distributed under the terms of the Creative Commons Attribution License (http://creativecommons.org/licenses/by/2.0), which permits unrestricted use, distribution, and reproduction in any medium, provided the original work is properly cited.
evolution of the plant genomes. However, the real impact of genome duplication on gene network evolu-tion, by comparing ancestral pre-WDG networks to modern post-WGD networks, is not clear. Recent access to numerous sequenced plant genomes [4] now offers the opportunity to study, at an unprecedented resolu-tion, the impact of WGD on gene and genome organiza-tion as well as regulaorganiza-tion.
Recent paleogenomics studies in plants aiming at comparing modern genome sequences to reconstruct their common founder ancestors based on the charac-terization of shared duplication events allowed the char-acterization of seven genome paleoduplications for the monocots and seven genome paleotriplications for the eudicots. These data led to the construction of extinct ancestors of seven protochromosomes (9,731 proto-genes) and five protochromosomes (9,138 protoproto-genes) for the eudicots and monocots, respectively [4] (Figure 1a). These recent evolutionary studies in plants suggest that most duplicated genes that are structurally retained during evolution (referred to as ‘persistent duplicated genes’) have at least partially diverged in their function [6,7]. Microarray studies in eudicots and monocots showed that the vast majority of duplicated genes have diverged in their expression profiles, with 73% [8,9] and 88% [10] of gene pairs in Arabidopsis (eudicot reference genome) and rice (monocot reference genome), respec-tively, associated with asymmetric expression profiles after 50 to 100 million years of evolution. In maize, where a recent WGD dating back to 5 million years ago (MYA) occurred [11], more than 50% of the duplicated genes have been deleted and are no longer detectable within paralogous chromosomal blocks [12]. These results clearly demonstrate that most of the genetic redundancy originating from polyploidy events is erased by a massive loss of duplicated genes by pseudogeniza-tion in one of the duplicated segments soon after the polyploidization event.
Because many genes are part of more global regulatory networks, a change in the expression pattern of a single gene could induce changes for numerous genes involved in the same functional pathway. Haberer et al. [13] noted for example that tandem as well as segmental duplicate gene pairs exhibiting high cis-element similari-ties within promoters had divergent expression in Arabi-dopsis, suggesting that changes to a small fraction of cis-elements could be sufficient for neo- or subfunctionali-zation. We can argue that functional novelties derived from neo- or subfunctionalization of orthologous and paralogous copies may reduce the risk of extinction of plant species [14,15], similar to what has been suggested in mammals, where extinction events of vertebrate lineages is higher prior to the known ancestral WGD [16]. In this scenario, rapid genomic (that is, reciprocal
gene loss) and functional changes (that is, neo- or sub-functionalization) following WGD might enable poly-ploids to better or quickly adapt to environmental conditions with improved physiological and morphologi-cal traits and properties that were not present or suffi-cient in their diploid progenitors. For instance, it has been suggested that neo- or paleopolyploidy may increase vigor [17], favor tolerance to environmental changes [15], and facilitate propagation through increased self-fertilization species [18,19].
To gain insight into the impact of genome doubling on gene structure and expression, we performed high-throughput RNA sequencing (RNA-seq)-based inference of the grain filling gene network in bread wheat. We focused our functional experiments on a grain develop-mental kinetic to be able to run comparable experi-ments in other cereals (for example, rice in the next sections) based on the main conserved grain develop-mental phases: cell division, filling, and dehydration. Bread wheat is a good plant model to study the impact of distinct rounds of WGD on gene structure and func-tion, as its genome comprises seven ancestral paleodu-plications shared with all known cereal genomes and two recent neopolyploidization events to form Triticum aestivum, which originated from two hybridizations, one between Triticum urartu (A genome) and an Aegilops speltoides-related species (B genome) 1.5 to 3 MYA, forming Triticum turgidum ssp. durum, and one between T. turgidum (genomes A-B) and Aegilops tauschii (D genome) 10,000 years ago [20,21]. Bread wheat is thus a good genome model to study in the same analysis the impact of ancient and recent WGD on genome structure and function. The bread wheat genome architecture offers us the opportunity to study not only the structures and corresponding expression patterns of paleoduplicated genes (50 to 70 million years of evolution) but also neoduplicated genes (1.5 to 3 mil-lion years of evolution) by comparing expression profiles of A, B and D homoeologous gene copies, that is, homo-eoalleles (Figure 1a). As the complete assembled wheat genome sequence is not yet available, we have used Bra-chypodiumas reference genomes to investigate the grain filling gene network modification in response to recent and ancient evolutionary events, such as duplication, polyploidization and speciation. The aim of this study was not to perform a quantitative (that is, transcrip-tome) analysis of the genes expressed during grain development but rather a robust qualitative identifica-tion (that is, large scale repertoire) of homoeologous/ orthologous/paralogous gene networks, allowing us to provide new insights into the structural and functional evolution of genes after a WGD event in plants. This article provides relevant conclusions on how recent and ancient duplicated genes in plants evolve in both
Wheat 37695 genes
Computed gene order
Wheat w1 w2 w3 w4 w5 w6 w7 (b) (c) B S R M B S R M B S R M B S R M 2 3 1 3 8 B S R M B S R M B S R M 3 4 2 5 4 B S R M (a)
Rice (O. sativa)
Avena Barley (H. vulgare) Wheat (T. aestivum) Maize (Z. mays) 46 31 12 Brachypodium (B. distachyon) Ehrhartoideae Pooideae Panicoideae Setaria Pennisetum 28 14 Eleusine Sorghum (S. bicolor) Chloridoideae 0 50 150 100 n=12, 372 Mb, 40577 genes n=5, 271 Mb, 25532 genes n=7, ~5000 Mb, 3423 markers n=21, ~17000 Mb, 5003 markers n=10, ~2365Mb, 32540 genes n=10, ~659Mb, 34496 genes Genome Features n=5 n=12 0 CFÆ n=12 7 CFÆ n=5 5 CFÆ n=7 2 CFÆ n=10 0 CFÆ n=12 17 CFÆ n=10 0 CFÆ n=10 Genome Structure Genome A Genome B Genome D Ancestral Genomes Speciation Events
Million Years
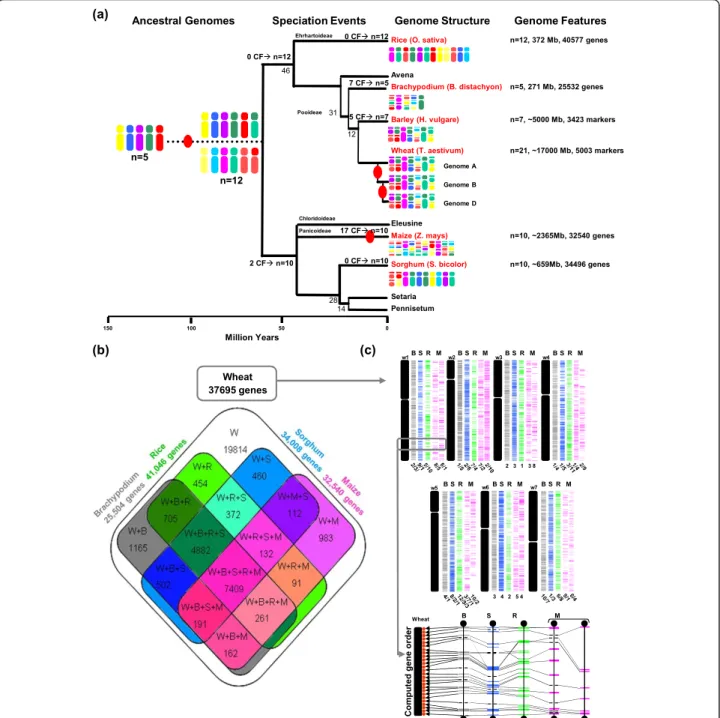
Figure 1 Homolog gene conservation between wheat and cereal sequenced genomes. (a) Cereal genome paleohistory. Schematic representation of the phylogenetic relationships between grass species adapted from [2,4]. Divergence times from a common ancestor are indicated below the branches of the phylogenetic tree (in million years). Whole genome duplication events are illustrated with red circles on the tree branches. The evolution of chromosome numbers of modern species from the ancestral genome structure is indicated with the number of chromosome fusion (CF) events. Genome features (number of chromosomes, physical size, and the number of annotated unigenes) of the six cereal genomes investigated are shown at the right-hand side. Modern genome architectures are illustrated using a color code that represents the n = 5 and 12 extinct ancestors (left). (b) Homologous gene groups between wheat and rice, Brachypodium, sorghum, and maize genomes. The Venn diagram illustrates the number of conserved protein domain-based homologs between wheat (RNA-seq gene clusters) and rice/ Brachypodium/sorghum/maize (annotated proteins). (c) Simulated synteny-based gene order model in bread wheat. The chromosomal location of the RNA-seq gene clusters are shown on the seven bread wheat chromosome groups based on a consensus gene order derived from the observed synteny between wheat and rice (’R’, in green), Brachypodium (’B’, in grey), sorghum (’S’, in blue), and maize (’M’, in pink) chromosomes (numbers are shown at the bottom of the chromosomes). The bottom inset illustrates a micro-synteny example of 26 re-ordered genes in bread wheat chromosome 1 (red dots) based on orthologous genes identified in Brachypodium (chromosome 2, 92 annotated genes, 0.9 Mb), sorghum (chromosome 9, 108 annotated genes, 1.1 Mb), rice (chromosome 5, 112 annotated genes, 0.9 Mb), maize (chromosomes 6 to 8, 145 annotated genes, 12.6 Mb). Non-conserved genes are illustrated using dotted lines and conserved genes are linked with black lines.
structure and function at the whole genome level, the gene family level, and the gene network level. The estab-lished divergence of structural and expression patterns between duplicated genes might have accelerated the erosion of colinearity between plant genomes as dis-cussed in the article.
Results
Synteny-based gene repertoire and expression map in wheat
We performed an RNA-seq analysis of samples collected during the grain development in wheat. We used a 454 (Roche, see Materials and methods)sequencing platform with five developmental stages, that is, 100 degree days (DD), 200 DD, 250 DD, 300 DD, and 500 DD after pol-lination. The five developmental stages cover the cell division (100, 200, 250 DD) and filling (300, 500 DD) phases of grain development in wheat. RNA was extracted, pooled, and sequenced and sequence reads (934,928 in total) were clustered and checked for quality as described in the Materials and methods section in order to provide a qualitative and exhaustive view of the grain development gene network in bread wheat (Table S1 in Additional file 1). We obtained 37,695 sequence clusters (20.1 Mb of assembled sequences with an aver-age coveraver-age of approximately 25× per cluster) based on the assembly strategy protocol described in the Materi-als and methods section. Detailed information on the 37,695 sequence clusters (identity, sequence, and func-tion) is available in Table S2 in Additional file 1 and consists of the most complete gene network repertoire of the grain development in wheat and probably in grasses more generally.
We aligned the 37,695 sequence clusters to the pro-teomes of the four monocot sequenced genomes, that is, rice, sorghum, Brachypodium, and maize (Figure 1b). Homologous gene pairs based on protein sequence con-servation (BLASTx) of functional domains allowed us to establish that 17,881 (47%) wheat genes can be paired with a single homolog counterpart (based on sequence comparisons using 50% protein identity as a threshold criterion) in at least one of the considered sequenced genomes. The remaining 19,814 are putative wheat-spe-cific unigenes (that is, not found in any of the four sequenced cereal genomes available to date) based on our BLAST alignment criteria, including 8,428 (43%) associated with wheat public EST-unigenes and 11,386 short reads (that is, an average of 430 bases for wheat-specific versus 650 bases for non-wheat-wheat-specific clusters) and/or low expressed/covered genes (that is, an average of 15× for wheat-specific versus 36× for non-wheat-spe-cific clusers). We cannot finally exclude that such orphan clusters may correspond to sequenced poly-ade-nylated non nuclear sequences. As expected, the
Brachypodiumsequence genome appears to be the clo-sest relative with the highest number of specific (not shared with any of the three other sequenced cereal genomes) protein-based homologs (1,165) identified in comparison with the wheat unigene set. A four genome-based synteny approach was used for all seven wheat chromosome groups by integrating wheat cytogenetic map information [22] and public chromosome-to-chro-mosome relationships [2,4] to produce the most parsi-monious simulated gene order in wheat based on gene conservation observed among the four sequenced cereal genomes as detailed in Murat et al. [23]. Based on the known synteny relationship established between the seven wheat chromosome groups and the rice, sorghum, Brachypodium and maize genomes [23], we produced a partial wheat gene-based physical map where RNA-seq clusters were ordered within wheat chromosomes in respect to the position of their orthologous counterparts (following the ordering priority of rice >Brachypodium > sorghum > maize; Figure 1b; Table S3 in Additional file 1). A comparable approach has also been used recently in barley [24]. The gene content for chromosome 3B has recently been estimated to include 8,400 unigenes [25], of which 3,478 (41.4%) were available from the cur-rent analysis. We provide here the largest set of uni-genes in wheat, covering almost half of the total genome-wide gene set based on the previous 3B chro-mosome comparison. Our wheat unigene set originated from a single tissue (grain), suggesting that only a few additional complementary ones (such as from root and leaf) would be sufficient to recover the vast majority of all genes in wheat. Therefore, we were able to place 17,881 wheat genes in a so-called computed or simu-lated order along chromosomes (Figure 1b) and have made the data available to users (Table S3 in Additional file 1) for further marker development or candidate gene identification. Figure 1c (bottom inset) illustrates the strategy used to infer computed gene order in wheat (chromosome group 1) based on the consensus gene order derived from the synteny observed between Bra-chypodium(chromosome 2), rice (chromosome 5), sor-ghum (chromosome 9) and maize (chromosomes 6 to 8) genomes. We therefore provide here for the first time the most complete qualitative set of unigene sequences expressed during the grain development in wheat asso-ciated with synteny-based physical locations on the seven chromosome groups.
Using the Brachypodium genome (5 chromosomes, 271 Mb, 25,504 gene models) as a reference to produce a heterologous wheat expression map, we could identify one-to-one robust orthologous gene pairs between wheat RNA-seq clusters and Brachypodium gene models using two nucleic acid alignment (BLASTn) parameters as described in Salse et al. [2,3] and the Materials and
methods section. Briefly, with the BLASTn alignment based on default parameter (such as expect values), homologous gene relationships are obtained, although the analysis is polluted with background noise corre-sponding to high functional domain conservation, mak-ing it difficult to characterize which are the real significant single orthologous relationships between two considered genomes. The used parameters (CIP = 60% and CALP = 70%) return statistically significant single copy collinear relationships between two gene sets, and the remaining homologous gene relationships are then considered artifactual, that is, obtained at random [2]. Among the 37,695 RNA-seq clusters, 8,485 (23%, with an average size of 761 bases) wheat sequences could be aligned with 7,158 known orthologous genes in Brachy-podium (Table S4 in Additional file 1) following this strategy. Map positions in wheat were simulated from syntenic relationships with Brachypodium as explained in the previous section. The remaining 29,210 RNA-seq clusters that could not be paired with Brachypodium gene models corresponded to short reads (average size of 468 bases) that were either considered as singletons or rejected based on our stringent sequence alignment criteria. These stringent alignment criteria were set to establish a robust repertoire of homoeologous/paralo-gous (wheat), ortholohomoeologous/paralo-gous (wheat/Brachypodium) genes in order to infer the consequence of evolutionary events (duplication, speciation) on gene structure and expres-sion patterns, as discussed in the next sections. The objective of the current analysis was not to obtain the largest set of wheat homologous counterparts in Brachy-podium for the 37,695 wheat sequence clusters (as described in the previous section and illustrated in Fig-ure 1b) but rather precise and robust evolutionary rela-tionships (conserved and duplicated genes) to investigate structural and functional redundancy.
In summary, we produced 37,695 wheat gene clusters (estimated to represent half of the total diploid wheat gene content based on the wheat chromosome 3B-based inference), of which 47% were associated with functional domain-based homologs of the sequenced genome pro-teomes (Brachypodium, rice, sorghum and maize) and 23% were strict orthologs with Brachypodium, consid-ered as the sequenced reference genome for the Triticeae.
Evolutionary fate of duplicated genes at the whole genome level
We produced a heterologous wheat expression map where 8,485 genes that were expressed during wheat grain filling were mapped strictly to the Brachypodium genome and positioned within the wheat genome based on the recently established Brachypodium /wheat gen-omes colinearity [4] (Figure 2a). This heterologous
wheat expression map (Table S4 in Additional file 1) has been used to study and discuss the evolutionary fate of paralogous, homoeologous and orthologous gene copies. Figure 2a depicts the five Brachypodium chro-mosomes as the inner circle (labeled‘Bd’) and illustrates the seven paleoduplications (in black) shared with other cereals in the center [2,3]. The second circle (labeled ‘Ta’) illustrates the orthologous relationships identified between Brachypodium and wheat using a seven color code [4], illuminating the Triticeae chromosome group origins. Black dots around the wheat circle illustrate the 454 RNA-seq reads from wheat (labeled‘454Ta’).
Our data clearly show that 6,024, 941, and 193 gene models matched with 1, 2, and 3 homoeologous gene copies in wheat, respectively (Figure 2a, 454Ta circles). Overall, only 193 of 7,158 orthologous gene pairs identi-fied between Brachypodium and wheat matched the three expected homoeologous counterparts in wheat. Therefore, we can suggest that 2.7% of the homoeolo-gous copies derived from two rounds of polyploidization that took place less that 1.5 to 3 MYA [20,21] have been structurally and functionally conserved in wheat. We cannot exclude that the expression of some homo-eologs may be too low to be detected by RNA-seq given the coverage used in the current analysis, but we have clearly established that, for 6,024 genes with detectable expression signals, the three homoeologs do not have perfectly redundant expression profiles in the considered grain experiment. This clearly suggests that, for a large majority of the homoeologs in wheat, at least one copy has been lost (deleted or pseudogenized) or neo- and/or subfunctionalized within 1.5 to 3 million years of evolu-tion. Moreover, Figure 2a illustrates that the genes expressed during the grain development were randomly distributed on the Brachypodium genome. Because of the average RNA-seq cluster length, however, we cannot distinguish homoeologous copies that have SNPs (1 per approximately 500 base-pairs in wheat) outside of the aligned sequences, leading to an overestimated percen-tage of homoeologous gene rearrangement events through homoeologous gene assemblage in the same cluster. We can still hypothesize that such homoeologs that do not harbor homoeoSNPs within the sequenced regions have been clustered together, leading to increased sequence coverage of the considered clusters. Consequently, we can extrapolate the homoeologous representation within a sequence assembly cluster based on the sequence coverage. The assumption is that for a sequence fraction of a gene that does not harbor homo-eoSNPs, the three homologs are then clustered within the same assembly, leading to an increase in the sequence coverage of such a region. Monitoring putative merged homoeologs in the same clusters based on the sequence coverage of the initial 37,695 RNA-seq
Wheat Chromosomes
2
CDS Brachypodium Orthologs (RNA-seq) wheat Paralogs Brachypodium Paralogs (RNA-seq) wheat
Brachypodium (Ch 2) – wheat (Chr 3-1) Cent. TF Brachypodium Chr1 A B D A B D Brachypodium Chr3 Duplication #3 Wheat Chr4 Wheat Chr1 Synteny w4/b1 Synteny w1/b3 S3 S1 C -S1 C-L1 L1 L3 S9 S1 0 C -S1 0 C-L6 L6 L1 L2 L3 S5 S1 S3 C -S3 C-L4 L4 L2 S3 S4 S1 C -S1 C -L 12 L 12 L13 L5 L4 S1 S8 S4 C -S4 C -L 1 L1 L5 S2 S3 S1 C -S1 C -L 9 L 9 L13 L1 2 Consensus Consensus 3 4 5 6 7 1 Bd Ta TFBd TFTa 454Ta B B B B Bd Bdd Bd B B B B Bd B B B B B B B B B B B B B B B B Bd B B Bdd B B B B B B B B B B T Ta Taaa T T T T T T T T T T T T T Ta T T T T T T T T T T T T T T T T T T T T Taa T Taaa TF TBdBdBBdddddddddddddddddddddddddd TFTa 454 454 4 4 4 4 4 4 4 TTTTTTTTTTTTTTTTTTa (a) (b) DNA control RNA RNA RNA 100DD 200DD 250DD 300DD 500DD Homoeolog CNV 2A 2A 2B2D N2A N2B N2D G roup A G roup D G roup B N2A N2B (c) (d) N2D Dp3 Dp4 Dp4 Dp4 Dp 2 Dp3 Dp5 Dp6 Dp2 Dp7 2A 2A 2B2D
Telo. Sub-telomeric region Peri-centromeric region Sub-telomeric region Telo.
Figure 2 Heterologous genome-wide wheat expression map. (a) The five Brachypodium chromosomes are illustrated in the inner circle (labeled Bd) and the seven paleoduplications (in black) shared within cereals are displayed in the center (Dp1 to Dp7). The second circle (labeled Ta) illustrates the orthologous relationships identified between Brachypodium and wheat using a seven color code. Dots around the two circles illustrate the Brachypodium transcription factors (red; labeled TFTa), the 454 RNA-seq reads from bread wheat (black; labeled 454Ta) and
associated TFs (green; labeled TFBb). (b) CNVs and homoeologous gene localization in bread wheat is illustrated with a single COS marker
(CT753726) that has been located on chromosome 2A (CNV of 2), 2B and 2D using the adapted cytogenetic material illustrated in the top. The arrows illustrate the observed amplification loss observed for the illustrated cytogenetic material (N2A, N2B, N2D respectively for the absence of the 2A, 2B, 2D chromosomes). The COS marker (CT753726) expression (SSCP amplification) profiles observed in the five RNA samples from wheat grain development, as well as in leaves (RNA and DNA amplifications) and roots (RNA) considered as negative control. Colored arrows highlight the loss of expression of the considered CNV or homoeologous copies. (c) Wheat (chromsomes 1 to 3) and Brachypodium (chromosome 2) heat maps for Brachydopium coding sequence (CDS; blue < 40, yellow approximately 41 to 50, red > 51 genes/500 kb), wheat RNA-seq ortholog (blue < 9, yellow approximately 10 to 19, red > 20 genes/500 kb), Brachypodium paralog (blue = 0, yellow approximately 1 to 5, red > 6 genes/ 500 kb), wheat RNA-seq paralog (blue = 0, yellow approximately 1 to 3, red > 4 genes/500 kb) distributions. The 44 RNA-seq TFs are illustrated with their corresponding orthologous positions on the Brachypodium chromosome as black vertical bars. (d) Paralogous chromosomal regions are shown in the center, involving Brachypodium chromosome 1 (2.1 Mb, 252 genes) and 3 (2.9 Mb, 181 genes), and annotated genes are shown with horizontal bars. Orthologous wheat chromosomes are shown at the right (consensus group 1 and homoeologous chromosomes in red) and left (consensus group 4 and homoeologous chromosomes in yellow). Orthologous genes identified between wheat and Brachypodium are linked with black lines. Paralogous genes identified between Brachypodium chromosomes are linked with green lines. Expression data from wheat RNA-seq cluster alignment against the considered Brachypodium chromosome sequences are shown with colored dots. Blue dots illustrate paralogous gene pairs for which only one copy is associated with wheat RNA-seq clusters while red dots illustrate paralogous pairs for which both duplicates are associated with wheat RNA-seq clusters.
unigenes, we were then able to identify 1,009 clusters covered with more than 140 reads (that is, putatively merged homoeologs) compared to 7,158 single copy homologs reported previously and associated with an average coverage of 38 to 42 reads. We confirm at the whole gene repertoire level (37,695 non-redundant sequence clusters), following a sequence coverage-based approach for detecting homoeologous copies, what we observed initially using a synteny-based approach (2.7% of wheat homoeologs are associated with a Brachypo-diumorthologous gene), that 2.7% (1,009) of the homo-eologous copies derived from two rounds of polyploidization that took place less than 1.5 to 3 MYA have been structurally and functionally conserved.
We designed an experiment using a subset of wheat genes to confirm the in silico structural and functional inference of homoeologous gene copies based on an in omic complementary approach. It is possible that miss-ing data (non-sequenced low expression genes) have led to an overestimation of the structural and expression differences between homoeoalleles. If we select a subset of 100 genes, we should observe, based on the in silico conclusions detailed in the previous sections, that a vast majority of the homoeologs do not share the same expression pattern during grain development. To do so, from a set of 100 wheat genes randomly distributed among the 7 chromosome groups, we were able to design 91 primer pairs for further in omic structural (that is, evidence of homoeolog deletion) and functional (that is, evidence of homoeolog neo- and subfunctionna-lization) inference of homoeologous gene copies in bread wheat. The Single Strand Conformational Poly-morphism (SSCP) detection allows identification of homoeologous amplicons in a polyploidy background through the exploitation, on a capillary sequencer, of secondary DNA structure under non-denaturing condi-tions. The SSCP approach on a capillary sequencer [26] offers two advantages, the ability to detect SNP and size polymorphisms and to identify homoeologous or even paralogous amplifications. Using the wheat cytogenetic material available for the structural detection of putative homoeologs based on the SSCP technique, we observed that 43 (54%) out of 79 successfully assigned genes exhibited loss of at least one homoeologous copy beyond technical detection. Regarding expression pat-terns, 33 genes (36%) out of 91 showed a loss of expres-sion when considering grain development, whereas 45 (49%) showed a loss of expression at the whole tissue level when comparing the expression in grain, the leaf, and the root (Figure 2b; Table S5 in Additional file 1). Consequently, 49% of the wheat homoeologous gene copies have been neo- and/or subfunctionalized when considering the grain developmental kinetic. Finally, only 27 (34%) genes out of 79 homoeoalleles detected
on the three chromosome groups clearly show a con-served expression pattern in grain. The remaining 66% have either been structurally lost and/or neo- and/or subfunctionalized in their expression profiles. Figure 2b (left) illustrates the chromosomal localization of a single COS (conserved orthologous set [26]) gene (wheat CT753726 with rice ortholog LOC-OS04g33150) assigned to chromosome group 2 (homoeologous copies A, B and D as well as a single CNV for the A homoeo-log). The same COS gene used to amplify, through the SSCP approach, the five RNA samples clearly shows that either the homoeologs (A, B and D copies) or CNVs do not present a perfect redundancy in their expression patterns. Figure 2b (right) illustrates how homoeoalleles and CNV expression signals were alterna-tively lost during grain development (colored arrows). Therefore, if 66% of homoeologs in wheat were either structurally lost (54%) or have diverged in their expres-sion patterns (36% within tissues and 49% between tis-sues), earlier in silico assessments of homoeologous gene shuffling (that is, only 2.4% of homoeoalleles show conserved expression profiles) deduced from the align-ment-based construction of homoeologous RNA-seq clusters was indeed overestimated (by about 20 to 30%), probably because of an average sequence read length of 761 bases as well as the possibility of missing low expressed genes, limits associated with this sequencing strategy.
Figure 1a illustrates a non-random distribution of wheat/Brachypodium orthologous genes at the whole genome level. As an example, Figure 2c shows Brachy-podiumchromosome 2, where the first heat map (cod-ing sequence (’CDS’) track) illustrates the distribution of annotated CDS with a clear enrichment of CDS in sub-telomeric regions (that is, 107.2 genes/Mb) and a reduced density in peri-centromeric regions (that is, 65.3 genes/Mb) due to transposable element (TE) inva-sion [27]. The second heat map illustrates the density of Brachypodium genes associated with a wheat ortholog (’Orthologs’ track) based on the data set of 8,485 RNA-seq clusters (Table S6 in Additional file 1). The gene conservation is higher in peri-centromeric regions (31.1% of conserved genes) compared to telomeric (23.8% of conserved genes) or sub-telomeric (28.1% of conserved genes) regions. Finally, the paralogs (either Brachypodiumor wheat gene ‘paralogs’ tracks) are not randomly and homogeneously distributed among chro-mosomes, that is, 47.4% versus 79.2% of duplicated genes in telomeric versus sub-telomeric regions, respec-tively. The 862 duplicated genes in Brachypodium, which arose from the seven ancestral duplications shared by the Poaceae, are depicted in the center of Fig-ure 2a (from 1 to 7). Therefore, 166 Brachypodium paralogous pairs (19.3%) matched with their duplicated
counterpart in wheat. The remaining 696 paralogous pairs (80.7%) matched with no or only one wheat sequence derived from the RNA-seq repertoire. This result is consistent with previous results [10] showing that 87.4% of the paleoduplicated genes in rice have been lost within a 50 to 70 million years of evolution. Figure 2d provides a detailed view of the ancestral dupli-cation referenced as‘Dp3’ shared between Brachypo-dium chromosomes 1 to 3 and wheat chromosomes 1 to 4. Duplicated genes are connected with a green line at the center of Figure 2d and wheat RNA-seq clusters that are orthologs of Brachypodium duplicated genes are illustrated with blue dots (wheat homoeologous genes identified for only one of the Brachypodium duplicates) or red dots (wheat homoeologous genes identified for both of the Brachypodium duplicates). At a micro-scale level for one (Dp3) of the seven ancestral duplications, among 20 paralogous gene pairs (green lines), 4 (20%) matched wheat homoeologous gene copies expressed during grain development (Figure 2d, red dots). This result further refines the conclusion that at either the whole genome level (19.3% of duplicates with concerted expression in the grain) or the micro-scale level (20% of duplicates with concerted expression in the grain), most of the paleoduplicated genes have been either lost or neo- and/or subfunctionalized so that the expression patterns at the tissue level are no longer redundant.
In summary, despite limitations of the RNA-seq approach in detecting low expressed genes and differen-tiating homoeoalleles, we have clearly shown at the whole genome level, using a heterologous wheat expres-sion map, that almost 70% of recent duplicates (from homoeologous copy evolutionary analysis) have diverged during 1.5 to 3 million years of evolution (54% of homo-eologous copies structurally lost and 36 to 49% of homoeologous copies with different expression profiles), and that more than 80% of ancient duplicates (from paralogous evolutionary analysis) have diverged during 50 to 70 million years of evolution.
Evolutionary fate of duplicated genes at the gene family level
Out of the 7,158 Brachypodium genes corresponding to 1, 2, or 3 wheat homoeologous gene copies derived from the grain RNA-seq data described previously, 5,967 (corresponding to 7,112 wheat sequences) follow a canonical Gene Ontology (GO) classification. Among the 38 GO categories (from‘molecular function’ classifi-cation) described at the whole genome level in Brachy-podium, the distribution of three classes were shown to be statistically (based on chi-square test using 1% as a threshold) biased between grain development data (that is, from wheat RNA-seq) and what is observed at the
whole-genome level (that is, annotated genes in Brachy-podium): protein binding, transcription factor activity, and electron carrier activity (Table S7 in Additional file 1). The three previous GO classes are then good candi-dates to study the evolutionary fate of duplicated genes at the gene family level.
We recently performed a transcriptome analysis of rice grain filling based on an oligonucleotide array, where among the 60,727 genes spotted on the array, 29,191 were expressed during grain development [10]. In particular, we conducted a detailed analysis of 32 transcription factors (TFs) that were expressed during rice grain development. Across 100 to 600 gene physical intervals covering the entire rice genome, no co-regula-tion was observed between the selected TFs and the flanking genes [10]. In order to test this hypothesis, we conducted a specific analysis of TF gene families in wheat. Among the 666 TFs identified in the Brachypo-diumgenome annotation (Figure 2a, TFBbred dots), 161
wheat homoeologs were extracted from the RNA-seq clusters (Figure 2A, TFTagreen dots). Of these 666
Bra-chypodiumTFs, 140 (21%) matched with a wheat ortho-log that was expressed during grain development. Figure 2c shows a classical heat map representation of Brachy-podiumchromosome 2, including the distribution of 44 TFs (Table S8 in Additional file 1) from the wheat RNA-seq clusters that matched an orthologous counter-part of Brachypodium chromosome 2 (highlighted with black bars). As can be observed, whereas the distribu-tion of genes among Brachypodium chromosomes is concentrated in the subtelomeric regions (see the pre-vious section), the TFs are conserved in orthologous positions along the entire chromosome (that is, 0.5 TF/ Mb in telomeric regions versus 0.6 TF/Mb in centro-meric regions). These data complement and refine ear-lier conclusions about wheat diploidization-resistant genes, that is, genes that are preferentially conserved among cereal after WGD are TFs or TF-related gene functions [3,28], leading to a random distribution of this gene family in modern genomes.
In summary, we have established that, at the gene family level and using the TF family as a reference, that the GO‘transcription factor activity’ class could be con-sidered a diploidization-resistant gene function as it might have provided a selective advantage during evolu-tion and adaptaevolu-tion and then retained as funcevolu-tional after WGD. Our data support preferential structural conser-vation of duplicated genes involved in signal transduc-tion and more precisely transcriptransduc-tion, which are putatively involved in response to rapidly changing bio-tic and abiobio-tic extrinsic factors compared with genes encoding products involved in relatively more stable processes.
Evolutionary fate of duplicated genes at the gene network level
In order to compare the wheat grain filling gene net-work with the previously published rice transcriptome analysis [10] described in the previous section, we con-ducted a similar analysis using the wheat Affymetrix array (based on the design and methods described in Wan et al. [29]). To avoid any bias due to different expression analysis methods - that is, RNA-seq versus Array technologies - we used the same RNA samples from the five wheat grain stages for hybridization of the wheat Affymetrix array (based on two independent bio-logical replicates), see Materials and methods. Among the 6,760 rice/wheat transcripts identified between the rice (60,726 oligonucleotide probes) and wheat (61,115 oligonucleotide probes) arrays, 2,600 (38.4%) showed concerted (that is, Presence versus Absence Variation, referenced as PAVs) expression signals during grain development (Table S9 in Additional file 1). When con-sidering not only rice/wheat orthologs but also paralogs that might have conserved the original or ancestral gene function and expression in rice and wheat, the percen-tage of concerted expression between both species would increase to 43.5% (that is, 2,944 genes).
Among the plant metabolic networks, the starch synthesis pathway is well known because starch is con-sidered a major key regulator of grain development. In this network, 170 enzyme-coding genes can be repre-sented with nodes and substrate-product metabolite flux by directional edges [30]. Figure 3 illustrates the com-parative gene network observed between rice (gene pro-files from microarray data [10]) and wheat (expression data from the current oligo-array and RNA-seq data) for the starch biosynthesis pathway described in Zhu et al. [31] (Table S10 in Additional file 1). Among the 170 genes involved in this network, 24 (14%) were identified as differentially expressed in rice and wheat based on the microarray experiments. However, based on the wheat RNA-seq data, 84 (49%) of the 170 enzyme-cod-ing genes could be matched with 1 (57 genes), 2 (21 genes) or even 3 (6 genes) homoeologous copies. We also could show that among the 84 genes for which we have identified RNA-seq clusters as proof of expression in grain development, only 6 (7%) matched their three homoeologous counterparts. This micro-scale analysis, focused on a unique and specific well-known gene net-work, also agreed with the whole-genome level analysis that revealed that, for a large majority of the homoeo-logs in wheat, at least one copy had been lost or neo-and/or subfunctionalized during 1.5 to 3 million years of evolution.
Figure 3b illustrates the impact of the paleoduplication in grasses on the starch network. Based on the identifi-cation of 20 duplicated genes (black brackets in Figure
3a,‘Gene Acc’ column) within the 170 enzyme-coding genes, we can suggest that 12% of the actual modern post-WGD network has been enriched by the ancestral shared tetraploidization event. We can then model the ancestral pre-WGD network consisting of 150 non-redundant starch enzyme-coding genes (Figure 3b). The observation that the post-WGD network is more abun-dant and enriched in TFs is also consistent with pre-viously reported biases in gene functions after WGDs in plants [32,33] as well as in fungi and mammals [7,34]. Previous results for cereal genomes [2-4,28] and for eudicots [32] clearly showed that retained duplicated gene families correspond to transcriptional regulators that were preferentially conserved after WGD events. However, our analysis, based on a single gene network, did not confirm earlier reported conclusions in Arabi-dopsis that bottleneck enzymes in metabolic networks, which tend to connect different modules, are preferen-tially retained as functional duplicates after WGD [35]. In our case, of the seven genes preferentially retained as duplicated (highlighted in red in the post-publication network representation), none correspond to enzyme-node encoding genes.
In summary, we suggest that, at the gene network level and using the starch biosynthesis pathway as a reference, 14% of the rice-wheat orthologous copies have the same expression pattern (compared to up to 44% at the whole-genome level), 7% of the wheat homo-eologous triplicates share the same expression pattern (consistent with what is observed at the whole-genome level), and WGDs have enriched the starch gene net-work by up to 12% in gene content.
Evolutionary consequences of duplicates on genome colinearity
Structural rearrangement and gene loss between dupli-cated regions results in the reduction of orthologous relationships between cereal genomes. Duplicated gene loss in maize (Figure 1b, bottom inset) accounts for the major source of erosion of colinearity between maize and the other grass genomes. Gene colinearity observed between maize chromosome 8 (or 6) is reduced com-pared to the microsynteny observed between Brachypo-dium, rice, and sorghum at the same loci due to the recent WGD that occurred specifically during maize genome evolution. Only seven chromosome 8 (purple) and eight chromosome 6 (purple) genes are conserved between maize and the other three cereal genomes com-pared to the 26 orthologous relationships (grey, blue, green in Figure 1b) identified when comparing the rice, sorghum, and Brachypodium genomes.
Despite the diploidization process following WGD associated with the loss of homoeolog and/or paralog sister gene copies being the major source of genome
(a) (b) Sucrose Fructose + UDP-Glucose Glc-1-P Glc-6-P Frc-6-P Frc-1,6-BP PEP GAI-3P + DHAP PEP GAI-3P + DHAP Frc-1,6-BP Frc-6-P Glc-1-P Glc-6-P ADP-Glc ADP-Glc Amylose Amylopectin Glucose Glc-1-P Oligosaccharides UDP UTP UDP ATP ADP ATP ADP PPi 1 2 3 Pi ATP PPi Pi Sucrose synthase UDPG pyrophosphorylase fructokinase G6P isomerase phosphoglucomutase Hexose- P isomerase Phosphofructokinase Or PPi-F6P 1-phosphotransferase Adolase Triose-P isomerase Hexose-P/Pi Translocator 1 2 3 PEP/Pi Translocator Triose-P/Pi Translocator Triose-P isomerase Adolase cp FBPase Hexose-P isomerase phosphoglucomutase ADPG pyrophosphorylase Starch synthases Branching enzymes Debranching enzyme Disproportionating enzyme Isoamylase Amylase, alpha Amylase-inhibitor Amylase, beta Glucosidase, alpha Starch phosphorylase Expression
Wheat RNA seq Rice Array Wheat Array
Gene Acc
Sucrose
Starch
WGD
Ancestral pre-WGD Starch Gene Network
Actual post-WGD Starch Gene Network Starch Duplication 0 1 >1 Sucrose Starch 7 3 124 3 4 2 6 7 3 10 6 4 7 4 4 3 6 11 4 2 2 4 18 10 10 9 2 3 3 2 4 7 3 8 4 7 4 3 3 5 9 4 2 2 4 16 10 8 9 6 3 9 3 3 4 3 2 Starch Stages Stages 1 2 3 4 5 1 2 3 4 5
Figure 3 Comparative evolution of the starch gene network between rice and wheat. (a) Twenty-nine enzyme-encoding genes involved in the starch biosynthesis network are listed at the left and 170 genes (named according to their accession numbers) are shown. Expression data from oligo-array experiments performed in rice and wheat are displayed using a classical colored scale in which yellow illustrates the absence of expression and red the observed highest level of expression (6.5 for rice, 14.5 for wheat as normalized intensity). At the right are illustrated orthologous RNA-seq clusters from one up to three homoeologous copies (black scares). (b) The starch gene network is schematically represented with black dots representing synthesized substrate and the number of gene-encoding enzymes is shown in circles. The pre-WGD (top) and post-WGD (bottom) networks illustrate the impact of paleoduplication where no impact (yellow), gain of an additional enzyme-encoding gene (blue) and more than one additional enzyme-enzyme-encoding gene (red) are shown.
colinearity erosion, CNV is also an important phenom-enon that can contribute to the observed reduced syn-teny between grass genomes, as illustrated in the Figure 1b where a single-copy COS gene identified in rice, Bra-chypodium, maize and sorghum corresponds to a puta-tive CNV in bread wheat chromosome 2A. Such species-specific CNVs will not be associated with any orthologous counterpart in the other genomes, thus reducing the percentage of conserved and orthologous genes in grasses. Figure 4 illustrates the difference between the loss of synteny and the increased number of tandem duplications, which were referred to as CNVs. At the right-hand side of the figure, bread wheat chromosome 3B is shown with 8 deletion bins, for which the number of available ESTs (blue bars) as well as the number of orthologous genes (red bars) with Bra-chypodium chromosome 2 is illustrated. The ortholo-gous blocks observed between wheat chromosome 3B and Brachypodium chromosome 2 are illustrated in
different colors in the center of the figure. Finally, at the left-hand side of the figure, Brachypodium chromosome 2 is split into orthologous blocks of bread wheat chro-mosome 3B. The number of RNA-seq clusters of Bra-chypodium genes is depicted as circles (black for homoeologous copies and red for CNVs). A clear corre-lation between the loss of colinearity and increase of CNV can be observed. The three 3B bin intervals dis-playing the highest loss of colinearity (3BS8, 3BL2, 3BL7; indicated by red stars) are associated with ortho-logous regions of Brachypodium chromosome 2 com-prising CNVs (linked with dotted black lines). Considering Brachypodium chromosome 2 as an exam-ple of a reference and model chromosomal structure, CNVs in wheat were preferentially located within subte-lomeric regions of modern chromosomes or paleo-inserted chromosomes (that is, the ancestral fusion event between W3 in green and W1 in red). We suggest here that the loss of colinearity observed locally between
wheat Ch 3B (571 mapped ESTs) Brachypodium Chr2 (5789 annotated genes) C onserved O rthologous S et (COS)
Copy Number Variation in 454 clusters
3BS8 3BS9 3BS1 3BL2 3BL10 3BL7 0 50 100 150 200
Nb assigned EST Nb orthologous EST
C-3BL2 C-3BS1 Homeologs CNVs
*
*
*
Wheat Chr1w3
w3
w1
Figure 4 Correlation between CNV and synteny erosion between Brachypodium and wheat. At the right is illustrated the wheat chromosome 3B subdivided into eight deletion bins surrounding the centromere. The number of available mapped ESTs per bin is illustrated with blue bars whereas the number of conserved orthologous sets (COS) is shown with red bars. The three deletion bins associated with the lowest percentage of COS regarding the number of available mapped ESTs are indicated by red stars. At the left is illustrated the Brachypodium chromosome 2 subdivided into orthologous chromosomal relationships with wheat chromosomes 1 (in red) and 3 (in green). The wheat RNA-seq clusters are shown according to their orthologous positions on Brachypodium chromosome 2 as homoeologs (black dots) or additional CNVs (red dots). At the center are shown the Brachypodium/wheat orthologous genes linked with colored lines according to their position within the wheat deletion bins.
Brachypodiumand wheat is mainly due to tandem gene duplications putatively favored by recent polyploidiza-tion events in bread wheat.
In summary, we have shown that, at the whole gen-ome as well as the chromosgen-ome level, segmental dupli-cations and gene duplidupli-cations in tandem (CNVs) comprise the main basis of colinearity loss between cer-eal genomes.
Discussion
Structural divergence between duplicated genes in plants
Our estimate of the frequency of chromosomal rearran-gements (that is, duplicated gene loss) between homo-eoalleles in wheat - 54% within less than 1.5 to 3 million years of evolution - needs to be viewed in the context of published studies. Qi et al. [22], based on a restriction fragment length polymorphism (RFLP) geno-typing approach, mapped 7,104 EST unigenes onto 16,099 loci within the 21 bread wheat chromosomes. Because 39% of the ESTs mapped to the three homoeo-logous groups, those studies might have suggested that up to 61% of the homoeologs might have lost at least one of the homoeoalleles even despite technological lim-its due to the RFLP mapping resolution. Overall, we suggest here that, based on our and published data, 54 to 61% (depending on the genetic mapping or chromo-some assignation procedures) of the wheat homoeoal-leles have been entirely deleted or pseudogenized within less than 3 million years of evolution.
Re-analysis of the paleoduplication within the rice gen-ome, consisting of ten major duplications as part of a WGD event 50 to 70 MYA, has shown that 87.4% of the duplicated genes have lost their orthologous counterparts [10]. Diverged polyploids, such as maize, are likely to have evolved from ancient polyploids by a process of pseudo-gene formation followed by sequence loss. In a study of the fate of duplicated genes in the maize genome, Lai et al.[36] and Messing et al. [12] have suggested that, within 5 million years of evolution, about 50% of duplicated genes have been lost through deletion. Nonetheless, gene duplication in maize, per se, via (auto)polyploidization may be associated with detectable increases in expression level, as demonstrated by Guo et al. [37]. Blanc et al. [9] reported similar findings from the Arabidopsis genome, where also only 20% of paralogs were retained within duplicated segments. More precisely, the authors stated that 28% and 13.5% of duplicated genes are retained in recent (date back to the Arabidopsis/Brassicacae diver-gence, 24 to 40 MYA) and old (date back to the monocot/ dicot divergence, approximately 150 to 200 MYA) duplica-tion blocks, respectively. Considering the recent data obtained in dicots (Arabidopsis) and monocots (rice, wheat, maize), our results provide additional support that most of the genetic redundancy originating from
polyploidy is erased by a massive loss of duplicated genes by pseudogenization in one of the duplicated segments soon after the polyploidization event.
The structural loss of duplicated genes between para-logous segments as well as gene duplication in tandem (CNVs) accounted for a large part of the erosion of coli-nearity between cereal genomes. It became clear that using synteny-based approaches to establish a virtual gene order in non-sequenced genomes might mimic up to 77% of the gene order and content [4]. The remain-ing consists of lineage-specific duplicates loss and CNVs that will not be known until the genome is fully sequenced [4]. However, we can estimate that a large majority of the gene content can be modeled based on synteny, especially to support the development of gene-based markers such as COS [26].
Expression divergence between duplicated genes in plants
As for chromosomal rearrangements, we also need to place our estimate of the frequency of change in expres-sion patterns between homoeoalleles in wheat - 36 to 49% (depending on the considered tissues) within less than 1.5 to 3 million years of evolution - in the context of pub-lished studies. Using a similar cDNA-SSCP approach to that reported in this study, Bottley et al. [38] demonstrated that for 27% (in leaf) and 26% (in roots) of the considered genes, one homoeologous copy was not detectable within the cDNA samples. Our estimate of functional partitioning between homoeoalleles includes not only a presence/ absence variation at the tissue level (49%) but also takes into account the difference in the expression profiles based on a developmental kinetic within a specific organ (36% in wheat grain). Using a cDNA-amplified fragment length polymorphism (AFLP) assay, Kashkush et al. [39] estimated that about 5% of the genes are silenced in a newly synthesized allohexaploid, a figure comparable with the study of He et al. [40] using a similar approach. This level is substantially lower than our estimates, but not sur-prising given the time gene silencing could continue over many generations. It certainly confirms that the diploidiza-tion process immediately follows the polyploidizadiploidiza-tion event. Exploiting large collections of EST data, Mochida et al.[41,42] concluded that silencing affected 11 out of 90 sets of homoeoalleles (12%). Overall, based on our and published data, we suggest that 12 to 49% (depending on the tissues and approaches considered) of the wheat homoeoalleles have been neo- and/or subfunctionalized within less than 3 million years of evolution.
A similar difference between synthetic and ancient hybrids has been demonstrated in cotton, where Adams et al. [43,44] used a cDNA-AFLP assay to show that about 5% of all genes are silenced in a newly synthesized allotetraploid, but that about 25% of genes were affected
in natural tetraploid cotton (within 1 to 2 million years of divergence). However, in newly synthesized A. thali-ana × A. arenosa hybrids described by Comai et al. [45], only 0.4% of genes are silenced as a direct result of polyploidization, a figure substantially lower than that described in wheat and cotton. On the other hand, a survey on gene expression variation of A. thaliana and A. arenosa, which split from a common ancestor approximately 1.5 MYA, showed a higher number of approximately 2.5% of gene expression differences. The reason(s) for these disparities remain unclear, but might be a consequence of lower levels of homoeology between the two contributing genomes, and therefore the induction of a lower level of interference in their independent expression. Still, gene silencing certainly appears to be a common phenomenon in established polyploids, and the frequency of silencing seems to increase over time. Using detailed analysis of expression divergence between rice paleoduplicates, Throude et al. [10] have shown that 88%, 89%, and 96% diverged in their expression pattern in grain, leaf and root within 50 to 70 million years of evolution, respectively. Blanc et al. [9] showed that 57% (for young duplications) to 73% (for old duplications) of paralogs have diverged in expression based on a computational analysis involving 62 Affymetrix microarray experiments in Arabidopsis. However, Blanc et al. [9] cautioned that the 73% of gene pairs that have diverged in expression in the context of old duplications is an underestimate as cross-hybridiza-tion occurred at a high rate in this type of array-based experiment. Finally, expression of maize duplicates has been investigated through EST and cDNA mapping (EST-overgos by Gardiner et al. [46] and cDNA-RFLP by Helentjaris et al. [47]), suggesting that 20% and 29%, respectively, of the considered probes identified two dis-tinct contigs or loci. These data suggest that 71 to 80% of the maize paralogs have diverged in their expression profiles from both EST and cDNA-based mapping experiments. However, gene silencing of duplicated copies rather than deletion is probably more a gene-dosage effect than just a strict diploidization response. Paralogous copies of prolamin genes (a medium size multigene family) in maize also showed that less than 50% of the duplicated copies remained intact [48]. Inter-estingly, at the same level, differential gene amplification (such as CNVs) also resulted in subfunctionalization of additional gene copies by divergent transcriptional regu-lation, mimicking the same events that happen in the same period of evolution between homoeologs [49].
Temporal modeling of structural and expression gene shuffling after duplications in plants
We established clearly in this study that around 70% of homoeoalleles in the hexaploid wheat genomes have
been lost (54 to 61%) or have diverged in gene expres-sion (12 to 49%) since 1.5 to 3 MYA. These data con-firm and complement the conclusion of Mochida et al. [41,42] that, considering 79 genes with scored expres-sion in 10 tissues, 15 (19%) were expressed equally for the three homoeologs whereas the remaining 64 (81%) showed preferential homoeologous gene expression in at least one of the considered tissues. Based on the collec-tive data from wheat detailed in the current article and from other plant species available in the literature, we tried to model the structural and functional conse-quences of gene set amplification after genome doubling for the last 100 million years of evolution. Figure 5a illustrates plant phylogeny, where speciation events are dated in MYA and known WGDs are marked with red dots. Based on our and other studies from the literature referenced in Table S11 in Additional file 1, we propose that structural rearrangements (from pseudogenization up to deletion) have been suggested to affect 54 to 61% of wheat homoeoalleles (Figure 5b, data point 1), 71 to 80% of maize neoparalogs (Figure 5b, data point 2), 72% of Arabidopsis neoparalogs (Figure 5b, data point 3), 87% of rice paleoparalogs (Figure 5b, data point 4), and 86% of Arabidopsis paleoparalogs (Figure 5b, data point 5) after 1.5 to 3, 5, 24 to 40, 70 to 100, and 150 to 200 million years of evolution, respectively. Regarding the impact of polyploidy on functional differentiation between duplicated gene copies, our and published data have suggested that 12 to 49% of wheat homoeoalleles (Figure 5b, data point 6), 50% of maize neoparalogs (Fig-ure 5b, data point 7), 57% of Arabidopsis neoparalogs (Figure 5b, data point 8), 88% of rice paleoparalogs (Fig-ure 5b, data point 9), and 73% of Arabidopsis paleopara-logs (Figure 5b, data point 10) do not exhibit any concerted and redundant expression after 1.5 to 3, 5, 24 to 40, 70 to 100, and 150 to 200 million years of evolu-tion, respectively.
Given the prevalence of gene and genome duplication in the paleohistory of plant, species and lineage develop-ment in angiosperms might differ from organisms where genome duplication was rare and where extensive expression divergence following duplication would have a profound impact on the pattern of developmental and regulatory networks. Our data support the idea that after 50 to 70 million years of evolution since grass gen-omes experienced a shared paleotetraploidization event, the vast majority of the homoeologous genes have been lost within a sister block and that the expression profiles of the remaining gene copies have largely diverged (Fig-ure 5b). Changes in gene expression may have occurred immediately after polyploidy or might need a few gen-erations to reach a new expression status. This trend towards silencing (or gene loss via pseudogenization) or expression shift (via neo- or subfunctionalization) of a
particular locus soon after a polyploid event could be advantageous for adaptation and the establishment of a successful polyploid genome compared to its diploid founder progenitor. Figure 5b shows the evolution of gene function (grey dotted curve) and structure (black dotted curve). It follows that loss of duplicated genes due to mutation and deletion appeared to be a rapid
and exponential process arising immediately after poly-ploidy because there is sufficient time for point muta-tions to accumulate. Moreover, expression modification and silencing of duplicated genes appear to take longer and are probably epigenetically induced (that is, the putative causal factor). Strikingly, based on the deduced total duplicated gene shuffling inference (dotted curves Eurosids Oryza (rice) Avena Hordeum (barley) Triticum (wheat) Zea (maize) 65 46 31 12 Brachypodium (brome) Ehrhartoideae Pooideae Panicoideae Setaria Pennisetum 28 14 Eleusine Euasterids Vitis (grape) Populus (poplar) Eucaliptus Medicago Arabidopsis (cress) Glycine (soybean) Carica (papaya) Apicales Solanum Nicotinia Sorghum (millet) Flowering plants Chloridoideae 90 120 150 50 48 70 A B D Structural shuffling [y = 6.092 x ln(x) + 57.604] Functional shuffling [y = 11.189 x ln(x) + 26.651] Million Years Cretaceaous Tertiary Jurassic
(a)
Total shuffling [y = 1.919 x ln(x) + 91.93] 10 Gene % 20 30 40 50 90 100 60 70 80 [1] [6] [2] [8](b)
[3] [7] [5] [4] [9] [10] Quat.Figure 5 Temporal model of structural and functional gene shuffling in plants. (a) Schematic representation of the phylogenetic relationships between angiosperm species. Divergence times from a common ancestor are indicated on the branches of the phylogenetic tree (in million years). Sequenced genomes are indicated in red. WGD events are illustrated with red circles on the tree branches. (b) The percentage of total and structural (gene loss) or functional (neo-subfunctionalization) gene shuffling discussed in the article (referred to as data point‘X’ in the text) and observed during the last 100 million years of evolution are plotted as dotted red, black and grey logarithmic curves.
in Figure 5b) within approximately 10 million years of evolution after a polyploidization event, approximately 50% of the homoeologs have either been lost or sub- or neofunctionalized in plants. The superimposition on these immediate or short-term (putatively mutation-based changes) and longer-term (putatively epigenetic-based changes) responses to genome doubling might explain the observed structural and functional partition-ing among gene pairs originatpartition-ing from a duplication event. We can hypothesize that the diploidization that takes place immediately after a WGD is completed for 100% of the duplicated genes after 45 to 50 million years of evolution, the evolutionary timescale necessary to observe that none of the sister duplicated gene copies exhibit any structural or expressional or functional redundancy (pink dotted lines in Figure 5b).
Gene dosage relations, which play a huge role in gen-ome reorganization, are unbalanced after a WGD due to function redundancy between duplicated copies. Struc-tural and functional shuffling occurs relatively soon (within less than a few million years of evolution) after polyploidy in plants that are still cytogenetically poly-ploidy (such as in the case of bread wheat in the current study), but is still active several million years latter, dur-ing or after cytological diploidization (such as in the case of rice, Arabidopsis and maize in the current study). We may hypothesize that epigenetic differences between duplicates or even sub-genomes deriving from WGD might have contributed to a gene or genome dominance through the rapid differentiation of expres-sion toward gene dosage balance recovery soon after polyploidy. Wang et al. [50] observed silencing of poly-ploidy-derived duplicates due to hypermethylation in Arabidopsis polyploids. Epigenetic mechanisms as well as interaction networks might be the origin of an extre-mely rapid divergence of expression between duplicated genes soon after polyploidization. It has even been reported that polyploidization-derived modulation of expression between gene pairs was due to epigenetic mechanisms (sensu lato) in higher plants (reviewed in [45,51]). Based on our data set and derived conclusions, the bread wheat genome could be considered as a perti-nent model for studying the molecular basis of the interaction between homoeologous gene pairs, especially the epigenetic basis of such observed modification in expression between duplicates in response to polyploidi-zations. The spectrum of phenomena discussed here illustrates the immediate impact of polyploidy on gen-ome structure and its profound implication for evolu-tion. For example, some of the observed genomic changes are known to affect phenotypes in ways that are highly visible to natural selection. A case in point con-cerns genomics rearrangements that affect the flower-ing-time locus/network in synthetic Brassica polyploids.
These polyploidy-induced structural and functional rear-rangements may impact traits as relevant as flowering-time divergence in modern plant species.
Conclusions
Even if our estimates of divergence of expression between gene pairs might represent an underestimation of the true values in wheat because the data set is (i) centered on a grain developmental kinetic and then only a sampling of possible environmental conditions or tis-sues where the duplicated genes may be expressed, and (ii) based on RNA-seq, which may bias low expressed gene and homoeoallele identification, one cannot escape the theme that a large majority of the polyploidy-derived duplicated genes in plants have acquired divergent expression patterns and with them probably functions. Overall, duplication-mediated structural and functional gene shuffling promote a powerful acceleration of evolu-tion in plants.
Materials and methods
Plant material and RNA extraction Plant material
Two hundred seeds of hexaploid wheat, Triticum aesti-vum(cv. Récital), were sown with 4/5 Neuhaus compost and 1/5 Pouzzolane. After 8 weeks of vernalization, plants were transferred to a greenhouse with normalized temperature (approximately 18.5°C), light and hygrome-try conditions (60%). The main stem heads were tagged at anthesis and grain samples (endosperm and embryo) were collected at 100, 200, 250, 300 and 500 DD after pollination. Two biological replications of samples were done in 2004 and 2006. Leaves were sampled at differ-ent growing stages and pooled, and roots were sampled on 12-day-old seedlings grown in sand.
RNA extraction
Grain wheat (100, 200, 250, 300, 500 DD), root and leaf samples (approximately 1 g of tissue) were ground in liquid nitrogen and extracted with 4.5 ml of buffer (10 mM Tris-HCl, pH7.4, 1 mM EDTA, 0.1 M NaCI, 1% SDS) and 3 ml of phenol-chloroform-isoamyl alcohol mixture 25:24:1. The supernatant was extracted one more time with the same phenol solution in order to eliminate proteins and starch residues. The nucleic acids were precipitated by addition of 0.1 vol of 3M AcNA pH5.2 and 2 vol of 100% ethanol. After precipitation, RNA was rinsed once with 70% ethanol and the pellets dissolved in RNase-free water. Purification was made with a DNAse treatment RNase-Free DNase Set (Qia-gen, [52]) and then an RNeasy MinElute Cleanup Kit (Qiagen). The integrity of RNA was checked with an Agilent 2100 Bioanalyser microfluidics-based platform using a RNA 6000 Nano Chip kit and reagents (Agilent Technologies, [53]).