Publisher’s version / Version de l'éditeur:
International Journal of Engineering and Industries, 3, 1, pp. 45-54, 2012-03-01
READ THESE TERMS AND CONDITIONS CAREFULLY BEFORE USING THIS WEBSITE.
https://nrc-publications.canada.ca/eng/copyright
Vous avez des questions? Nous pouvons vous aider. Pour communiquer directement avec un auteur, consultez la
première page de la revue dans laquelle son article a été publié afin de trouver ses coordonnées. Si vous n’arrivez pas à les repérer, communiquez avec nous à [email protected].
Questions? Contact the NRC Publications Archive team at
[email protected]. If you wish to email the authors directly, please see the first page of the publication for their contact information.
NRC Publications Archive
Archives des publications du CNRC
This publication could be one of several versions: author’s original, accepted manuscript or the publisher’s version. / La version de cette publication peut être l’une des suivantes : la version prépublication de l’auteur, la version acceptée du manuscrit ou la version de l’éditeur.
For the publisher’s version, please access the DOI link below./ Pour consulter la version de l’éditeur, utilisez le lien DOI ci-dessous.
https://doi.org/10.4156/IJEI.vol3.issue1.5
Access and use of this website and the material on it are subject to the Terms and Conditions set forth at
Efficient image recognition using local feature and fuzzy triangular
number based similarity measures
Belacel, Nabil; Kardouchi, Mustapha; Liu, Zikuan
https://publications-cnrc.canada.ca/fra/droits
L’accès à ce site Web et l’utilisation de son contenu sont assujettis aux conditions présentées dans le site LISEZ CES CONDITIONS ATTENTIVEMENT AVANT D’UTILISER CE SITE WEB.
NRC Publications Record / Notice d'Archives des publications de CNRC:
https://nrc-publications.canada.ca/eng/view/object/?id=6d74bcd1-600b-4472-8c5c-1d7bf8ea5784 https://publications-cnrc.canada.ca/fra/voir/objet/?id=6d74bcd1-600b-4472-8c5c-1d7bf8ea5784Efficient Image Recognition Using Local Feature and Fuzzy Triangular
Number Based Similarity Measures
Nabil Belacel
NRC-IIT, 100 des Aboiteaux Street, Moncton, NB, Canada E1A 7R1
Email: [email protected]
Mustapha Kardouchi
Universite de Moncton, NB, E1A 3E9, Canada
Email: [email protected]
Zikuan Liu
NRC, 100 des Aboiteaux St, Moncton, NB, Canada E1A 7R1
Abstract
Image local scale invariant features are of great importance for object recognition. Among various local scale invariant feature descriptors, Scale Invariant Feature Transform (SIFT) descriptor has been shown to be the most descriptive one and thus widely applied to image retrieval, object recognition and computer vision. By SIFT descriptor, an image may be described by hundreds of key points with each point depicted by a 128-element feature vector; this representation makes the subsequent feature matching very computationally demanding. In this paper, we propose to incorporate the fuzzy set concepts into SIFT features and define fuzzy similarity between images. The proposed approach is applied to image recognition. Experimental results with the coil-100 image database are provided to show the superiority of the proposed approach.
1. Introduction
During the past decade, content based image retrieval and object recognition have received considerable attention and been successfully applied in a wide variety of areas such as computer vision and pattern recognition. Muller et al. [1] provided an overview of content-based image retrieval. In order to achieve high quality object recognition, the extracted image features are expected to be invariant to imaging noise, rotation, partial occlusion, and changes in scale, illumination and viewpoint [2,3]. After years of studying, many robust local feature descriptors have been proposed in the literature. Mikolajczyk and Schmid [4] provided a comprehensive survey of image local scale invariant feature descriptors and evaluated the performance of ten different feature descriptors. Based on intensive experimental results, they concluded that Scale Invariant Feature Transform (SIFT) has the best performance. In 2006, Bay, Tuytelaars and Gool [5] proposed another scale invariant feature descriptor, called Speeded Up Robust Features (SURF). Just like SIFT, SURF extracts key points, but describes each key point by a 64-element feature vector. Bauer, Sunderhauf and Protzel [6] evaluated the performance of SIFT and SURF, and concluded that SIFT is more distinctive than SURF, but SURF is more compact and faster. Some extensions of the SIFT descriptor have been proposed in order to improve matching properties or reduce computational complexity. For more details on scale invariant feature descriptor, we refer the reader to [4,5,6,7] and the references therein.
The idea of SIFT is to detect key points that have scale invariant local properties under a class of transformations, and then extract discriminating descriptors for these key points. Experiments have shown its outstanding performance in terms of distinctiveness, robustness and computational effectiveness; it has also demonstrated large success in many applications, such as image retrieval [8,9 ,10] and objects recognition [11,12]. For image recognition, SIFT features are extracted from a set of reference images and stored in a database, and then the SIFT features for a query image are extracted and compared with those in the database to choose the most similar ones. In the literature, classical distances between image features are usually used to define the similarity metrics, in which case the large amount of feature data inevitably make the subsequent feature matching computationally demanding.
In practice, images contain noise, occlusion, and spurious features, and moreover, the feature extraction process itself is imperfect. Therefore it is very unlikely that an image and its model features
match perfectly. In this case, the fuzzy set theory offers powerful tools to represent and process this kind of imprecision. In this paper, we propose using both fuzzy SIFT features and fuzzy distance for object recognition of images. The fuzzy SIFT feature should reflect a more objective description of content than the conventional SIFT features. The main contribution of this paper is the introduction of a new algorithm for image object recognition, which is based on fuzzy SIFT descriptors [13] and fuzzy similarity measure [14, 15, 16,17]. To the best of our knowledge, it is the first time to combine the SIFT descriptors with fuzzy metrics to study image recognition.
The remainder of this paper is organized as follows: Section 2 reviews the SIFT descriptors. Section 3 presents the proposed approach based on SIFT descriptors and fuzzy similarity measure. Section 4 defines the fuzzy similarity measures used in this work. Section 5 provides some experimental results. Finally, Section 6 concludes paper.
2. Brief Description of SIFT Descriptors
Local image features that are invariant to image transformations and variations are the key to object recognition; extracting local image features has been the focus of image processing during the last decade. Experiments showed that SIFT descriptor [10] is reasonably invariant to changes in illumination, image noise, rotation, scaling, and small changes in viewpoint. Because of the robustness of SIFT descriptor, it is chosen for image characterization in this paper.
Usually, there are two main stages to extract local features of an image: The first stage involves detecting features in an image in a repeatable way and the second one involves computing descriptors for each detected interest point. As described in [13], the SIFT feature extraction procedure consists of four steps:
Step1: Scale-space peak selection.
In the first step, possible interest points are identified by browsing the image over spatial and scale spaces. This is implemented efficiently by constructing a Gaussian pyramid and searching for local peaks, called keypoints, in a series of difference-of-Gaussian (DoG) images which can be computed from the difference of two neighboring scaled images separated by a multiplicative factor k:
D(x,y,σ) = G(x,y,k σ) - G(x,y, σ) * I(x,y)
= L(x, y, kσ) – L(x,y, σ) (1)
where L(x, y, σ) is the convolution of a variable-scale Gaussian G(x, y, σ) with an input image
I
(
x,y , namely,)
L(x,y, σ) = G(x,y, σ) * I(x,y). (2) Keypoints are identified as the local extrema (maxima or minima) of D(x,y,σ) cross scales. In
order to detect the local extrema, each pixel in D(x,y,σ) image is compared to its 8 neighbors in the current image and 9 neighbors in the above and below scales. If a pixel is a local maximum or minimum, it is selected as a candidate keypoint.
Step 2: Keypoint localization
Once keypoint candidates have been found by comparing each pixel to its neighbors, the next step is to filter them so that only stable and more localized keypoints are retained. For each candidate keypoint, interpolation of nearby data is used to accurately determine its position. Then, keypoints with low contrast are removed and responses along edges are eliminated. Step 3: Orientation assignment
In this step, an orientation is assigned to each keypoint detected in Step 2. To determine the keypoint orientation, a gradient orientation histogram is computed from an orientation histogram of local gradients of the closest smoothed image L(x,y,σ). For each image sample
L(x,y) at this scale, the gradient magnitude m(x, y) and orientation θ(x, y) are calculated using
pixel differences:
,
) , 1 ( ) , 1 ( ) 1 , ( ) 1 , ( arctan ) , ( 2 2 ) , (
y x L y x L y x L y x L g y x y L x L y x m where ΔLx = L(x+1, y) – L(x-1, y) and ΔLy = L(x, y+1) – L(x, y-1). An orientation histogram is formed from the gradient orientations of sample points within a region around the keypoint. The orientation histogram has 36 bins covering the 360 degree range of orientations. Each sample added to the histogram is weighted by its gradient magnitude and by a Gaussian-weighted circular window with a standard deviation σ being 1.5 times that of the scale of the keypoint. Peaks in the histogram correspond to dominant orientations. A separate keypoint is created for the direction corresponding to the histogram maxima, and any other direction within 80% of the maximum value. All the properties of the keypoint are measured relative to the keypoint orientation, which provides invariance to rotation.
Step 4: Keypoint descriptor
The local gradient data from the closest smoothed image L(x, y, σ) is used to create the keypoint descriptor. This gradient information is first rotated to align it with the assigned orientation of the keypoint and then weighted by a Gaussian with sigma that is 1.5 times the scale of the keypoint. The weighted data is used to create a specified number of histograms over a set window around the keypoint. Usual keypoint descriptors employ 16 orientation histograms aligned in a 4×4 grid. Each histogram has 8 orientation bins each created over a support window of 4×4 pixels. This leads to a SIFT feature vector with 128 elements with a support window of 16×16 scaled pixels.
3. Proposed Approach
For image retrieval, keypoints of the query image are compared with keypoints of images in the database. As mentioned in the introduction, we propose to incorporate fuzzy set concepts into SIFT features. This does not result in too much additional complexity because fuzzy set theories are very easy to implement and, more importantly, fuzzy set theories have been intensively studied and have very solid theoretical foundation, see e.g. [14,15,16,17] and the references therein. In the proposed approach, we first transform each keypoints component of every image into a set of fuzzy triangular numbers, and then define the fuzzy similarity measure between images in the database. Let image A contain the source object to be queried and B be an image possibly containing a similar object, the retrieval consists of the following three steps:
Step 1. Extract SIFT features.
SIFT transforms images A and B into collection of local feature vectors represented by {Aik,i = 1, 2, …, n; k = 1, 2, …, 128} and {Bjk, j = 1, 2, …, m; k = 1, 2, …, 128} where n and m denote the number of keypoints extracted from A and B, respectively.
Step 2. Extract fuzzy triangular numbers.
The keypoints extracted in Step 1 have the same dimension 128, but the number of keypoints varies from image to image. To measure the similarity between two images with different numbers of key points, this step extracts fuzzy triangular numbers for the SIFT features of each image.
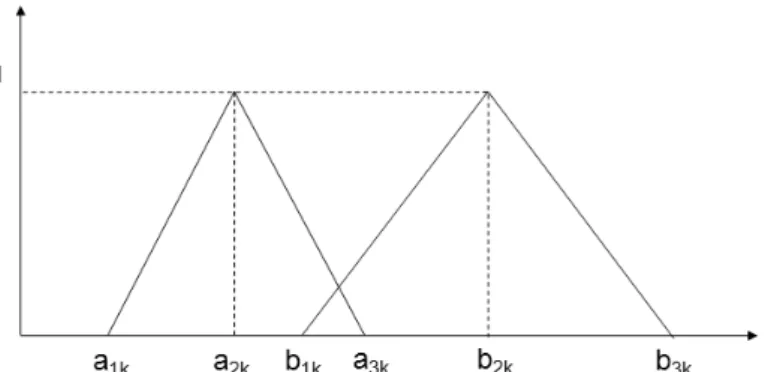
Let I(k, A) = (a1k, a2k, a3k), 1≤k≤128, represent the fuzzy number of the k-th component of the SIFT feature for image A, as shown in Figure1, where the parameters a1k, a2k and a3k are determined by using the Chebitchev’s theorem as follows: For each 1 ≤ k ≤ 128, let mk and σk denote the mean and standard deviation of the k-th component of the SIFT feature vectors {Aik,
i = 1, 2, …, n}, then the parameters a1k, a2k and a3k are defined by:
a1k = mk - t σk, a1k = mk, a1k = mk + t σk, (3) for k= 1,…128, where t is an integer number greater or equal 2.
Figure 1: A Fuzzy Symmetric Triangular Number
In this work, for simplicity we adopt the fuzzy symmetric triangular number as described in equation (3) which is adapted from the asymmetric fuzzy triangular number defined in [14]. Based on experiments with real image databases, t = 2 is chosen in this work.
Step 3. Measure the similarity between images.
Once the fuzzy triangular numbers are determined as described in the previous steps, the similarity between any two images A and B is defined by
128 1)
,
(
128
1
)
,
(
k kA
B
S
B
A
S
(4)where Sk(A,B) is the partial similarity between the k-th components of images A and B. The partial fuzzy similarity represents the intersection area between the fuzzy triangular numbers I(k,
A) and I(k, B). The details of the partial similarity calculation are provided in the next section.
4. Fuzzy Similarity Measure
As described in the previous section, the similarity between images A and B is computed from the partial similarities Sk(A,B), k = 1, 2, …,128, where the partial similarity Sk(A,B) corresponds to the intersection area between the fuzzy symmetric triangular numbers I(k,A) = (a1k,a2k,a3k) and I(k,B) =
(b1k,b2k,b3k). An example of intersection is given in Figure 2, from which we find that there are several possible cases between two symmetric triangles depending on the triangular number values. For each situation, there is an explicit formula which allows computing the intersection area between two triangles. These formulas were adapted from [14] and are described as follows:
Figure 2: Sample Intersection between two symmetric fuzzy triangular numbers
Case 1: If a1k > b3k, then I(k, A)∩ I(k, B))= Ø since the two membership functions do not overlap. Case 2: If a3k ≥ b3k, b3k > a1k, and a1k ≥ b1k, then
.
))
(
)
((
2
)
(
)
,
(
)
,
(
1 3 2 2 2 1 3 k k k k k ka
b
b
a
a
b
B
k
I
A
k
I
Case 3: If a3k > b3k and b1k > a1k, then
.
))
(
)
((
2
)
(
))
(
)
((
2
)
(
)
,
(
)
,
(
1 3 2 2 2 1 3 1 1 2 2 2 1 1 k k k k k k k k k k k ka
b
b
a
a
b
b
a
a
b
a
b
B
k
I
A
k
I
Case 4: If b3k > a3k and a1k > b1k, then
.
))
(
)
((
2
)
(
))
(
)
((
2
)
(
)
,
(
)
,
(
3 3 2 2 2 3 3 1 3 2 2 2 1 3 k k k k k k k k k k k kb
a
a
b
b
a
a
b
b
a
a
b
B
k
I
A
k
I
Case 5: If b3k > a3k and b1k > a1k, then
.
))
(
)
((
2
)
(
))
(
)
((
2
)
(
))
(
)
((
2
)
(
)
,
(
)
,
(
2 2 3 3 2 3 3 2 2 1 3 2 1 3 2 2 1 1 2 1 1 k k k k k k k k k k k k k k k k k ka
b
b
a
b
a
b
a
a
b
a
b
b
a
b
a
a
b
B
k
I
A
k
I
ii). If a2k < b2k, we have the same cases as in the above situation i). Similar formulas can be obtained by switching the parameters aik and bik, namely, replace parameters aik with bik and vice versa.
iii). If a2k = b2k, there are four possible situations between two symmetric triangles: Case 1: If a1k ≥ b1k and a3k ≤ b3k, then
;
2
)
(
)
,
(
)
,
(
b
3kb
1kB
k
I
A
k
I
Case 2: if b1k ≥ a1k and b3k ≤ a3k, then
;
2
)
(
)
,
(
)
,
(
a
3ka
1kB
k
I
A
k
I
Case 3: if a1k ≥ b1k and a3k ≥ b3k, then
;
2
)
(
)
,
(
)
,
(
b
3ka
1kB
k
I
A
k
I
Case 4: if a1k≤ b1k and a3k ≤ b3k, then
.
2
)
(
)
,
(
)
,
(
a
3kb
1kB
k
I
A
k
I
5. Experimental Results
This section gives some experiment results to evaluate the proposed method. For this purpose, we implemented the fuzzy triangular similarity with Matlab. The experiments are conducted by using the
Columbia University COIL-100 database.1 The COIL-100 image database contains 7200 color images of 100 different objects, where 72 images were taken for each object at 72 different viewpoints that are equally separated by 5ο. It is well known that dealing with viewpoint change is the greatest challenge of object recognition. So the COIL-100 database provides an excellent data set to test the performance on how well the proposed method can deal with change of view point. Figure 3 shows seven sample images extracted from the COIL-100 database (in this paper only gray images are plotted) and Figure 4 shows a sample image with the extracted keypoints.
Figure 3: Sample Images from the Coil Database
Figure 4: A Sample Image with Extracted Key Points
Next, we proceed to evaluate the proposed fuzzy similarity and compare it with the existing similarity metrics defined by various distances including the Euclidean, Minkovski, and Chebitchev distances. Assume that images A and B have n and m SIFT key points detected, respectively, and denote their SIFT-features by {Aik, i=1,2,…,n; k = 1,2,…,128} and {Bjk, j = 1,2,…,m; k = 1,2,…,128}. Let μA = (μA1, μA2, …, μA128) and μB = (μB1, μB2, …, μB128) be their means, namely, for k=1,2, …,128,
m i ik Bk n i ik AkB
m
A
n
1 11
,
1
The Euclidean, Minkowski and Chebitchev similarity metrics between A and B are defined by the Euclidean, Minkowski and Chebitchev distances between μA and μB.
Statistics, recall and precision, are two commonly used performance metrics for information retrieval [18], where precision is a measure of exactness and recall measures completeness. In this paper, precision is defined as the number of correctly retrieved images divided by the total number of images retrieved, and recall is defined as the ratio between the number of retrieved images and the total number of images in the class that the target image belongs to. More specifically, for each retrieval, let X be the number of the most similar images retrieved by a search, f be the number of correctly retrieved images among the X retrieved images, and N be the number images of the class to which the target image belongs, then precision=f/X and recall=f/N. In the sequel experiments, N=72 because each class of the COIL-100 database has 72 images.
Table 1: Recognition rates among 20 most similar images for different of similarity metrics
Image Euclidean distance Chebitchev Fuzzy triangular
similarity IMG1 0.75 0.55 0.85 IMG2 0.15 0.15 1 IMG3 0.5 0.2 0.5 IMG4 0.75 0.65 0.85 IMG5 0.4 0.35 0.6 IMG6 0.65 0.4 0.65 IMG7 0.6 0.4 0.55 Average 0.5 0.39 0.71
For each image shown in Figure1, 20 most similar images are extracted from the COIL-100 database. Table 1 presents precision of the recognition results by using Euclidean, Chebitchev and the Fuzzy Triangular similarity metrics. Table 1 shows that the Fuzzy Triangular similarity method significantly outperforms the others except for IMG7. As for IMG7, the precision of Fuzzy triangular similarity is 8 percent lower than that of Euclidean method, but 38 percent higher than that of Chebitchev. Table 1 shows that by combining SIFT descriptors and fuzzy similarity, the Fuzzy triangular similarity is able to recognize a single object.
Figure 5 presents the recognition results of IMG7 (see figure 3) by using the fuzzy triangle similarity. The retrieved images are listed in the descending order of fuzzy triangle similarity from left to right and from top to down. The one on the top-left is the query image. Figure 6 shows that with the increase of change in view angle, the fuzzy similarity decreases. In the cases of large viewing angle, the proposed approach fails to recognize the object in the image.
Figure 5: Recognition Result of the image 7 "IMG7"
To further compare the performance of various similarity measures, we conducted some experiments with another four images from the coil-100 database. For each selected image and for each similarity metric, the recall and precision are computed for X=20,40,60,100,200 to compare their precision under various conditions of recall. Figure 6 presents the results of precision versus recall, showing that (i) for a given search method, the precision rate decreases as recall increases; (ii) Chebitchev has the worst performance for all the four images; (iii) for images Img025, Img034 and Img031, the fuzzy triangle similarity metric significantly outperforms the others; (iv) for image Img058, the Euclidean distance and fuzzy triangle similarity have similar performance.
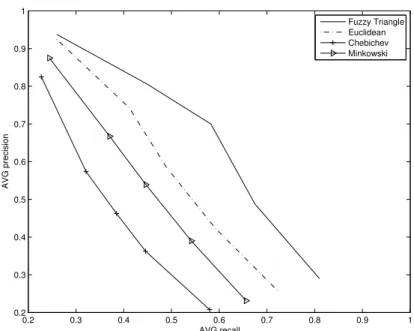
Figure 7 plots the average precision versus average recall of the four images, which shows that in overall, the proposed fuzzy triangle similarity outperforms the others significantly.
0.2 0.4 0.6 0.8 1 0.2 0.4 0.6 0.8 1 precision recall Img−025 0.2 0.4 0.6 0.8 1 0.1 0.2 0.3 0.4 0.5 0.6 0.7 0.8 precision recall Img−034 Fuzzy Triangle Euclidean Chebichev Minkowski 0.2 0.4 0.6 0.8 1 0 0.2 0.4 0.6 0.8 1 precision recall Img−031 0.2 0.4 0.6 0.8 1 0.2 0.4 0.6 0.8 1 precision recall Img−058
0.2 0.3 0.4 0.5 0.6 0.7 0.8 0.9 1 0.2 0.3 0.4 0.5 0.6 0.7 0.8 0.9 1 AVG recall AVG precision Fuzzy Triangle Euclidean Chebichev Minkowski
Figure 7: Average Recall Versus Average Precision
6. Conclusions
In this paper, we presented a method for image recognition based on SIFT descriptors and fuzzy similarity measure. The proposed method was evaluated and compared to other methods by applying to the COIL-100 image database. Experiment results show the proposed method performs well in the case of single object in an image. The experimental results have shown that combining fuzzy similarity with SIFT has strong potential in object recognition. The experiments also showed that change in viewing angle significantly degrades the performance of the proposed approach. We are currently investigating how to integrate learning algorithms and color information into our approach to improve its performance and also to apply the enhanced approach to real life applications. Extending the proposed method to include asymmetric fuzzy triangular number will be presented in another work.
Acknowledgment
This work was supported by the Natural Sciences and Engineering Research Council of Canada (NSERC) discovery grants RG262114-03 and RG293261-05. We would like to thank David Lowe for the SIFT feature code.
References
[1] H. Muller, W. Muller, D. McG. Squire, S. Marchand-Maillet and T. Pun, “Performance evaluation in content-based image retrieval: overview and proposals," Pattern Recognition Letters, vol. 22, Issue 5, pp. 593-601, 2001.
[2] M. Brown, and D. G. Lowe, “Invariant features from interest point groups," In Proc. of BMVC
2002, Cardiff, Wales, pp. 656-665, 2002.
[3] T. Lazebnik, S.C. Schmid and J. Ponce, “Affine-invariant local descriptors and neighborhood statistics for texture recognition," In Proc. of International Conference on Computer Vision, 2003. [4] K. Mikolajczyk, C. Schmid, “A performance evaluation of local descriptors", IEEE Transactions
on Pattern Analysis and Machine Intelligence, vol. 27, pp. 1615–1630, 2005.
[5] H. Bay, T. Tuytelaars and L. V. Gool. “SURF: Speeded up robust features," in Proc. of the ninth
[6] J. Bauer, N. Sunderhauf and P. Protzel, “Comparing several implementations of two recently published feature detectors," in Proc. of the International Conf. on Intelligent and Autonomous
Systems, IAV, Toulouse, France 2007.
[7] P. Moreno, A. Bernardinoa and J. Santos-Victora, “Improving the SIFT descriptor with smooth derivative filters," Pattern Recognition Letters, vol. 30, Issue 1, pp. 18-26, 2009.
[8] Y. Ke, R. Sukthankar and L. Huston, “An efficient parts-based near-duplicate and sub-image retrieval system," In Proc. Int. Conf. on Multimedia, pp. 869–876, 2004.
[9] T. Tuytelaars and L. V. Gool, “Content-based image retrieval based on local affinely invariant regions," In Proc. Int. Conf. on Visual Information and Information Systems, pp. 493–500, 1999. [10] K. Mikolajczyk and C. Schmid, “Indexing based on scale invariant interest points," In Proc. of
International Conference on Computer Vision, pp. 525–531, 2001.
[11] R. Fergus, P. Perona and A. Zisserman, “Object class recognition by unsupervised scale-invariant learning," In Proceedings of Computer Vision and Pattern Recognition, 2003.
[12] D. G. Lowe, “Object recognition from local scale-invariant features," In Proc. of International
Conference on Computer Vision, pp. 1150–1157, 1999.
[13] D. G. Lowe, “Distinctive image features from scale-invariant keypoints," International Journal of
Computer Vision, vol.60, no. 2, pp. 91-110, 2004.
[14] C. Lin and W. Ho, “An asymmetry-similarity-measure-based neural fuzzy inference system,"
Fuzzy Sets and Systems, Elsevier, 152, pp. 535–551, 2005.
[15] D. Yong, W. Shi, F. Du and Q. Liu, “A new similarity measure of generalized fuzzy numbers and its application to pattern recognition," Pattern Recognition Letters, vol. 25, Issue 8, pp. 875-883, 2004.
[16] D.F. Li and C. T. Cheng, “New similarity measures of intuitionistic fuzzy sets and application to pattern recognitions," Pattern Recognition Lett., vol. 23, pp. 221–-225, 2002.
[17] A. Khanum, "An Intelligent Framework for Natural Object Identification in Images", IJACT:
International Journal of Advancements in Computing Technology, Vol. 2, No. 2, pp. 122-129,
2010.
[18] J. R. Smith and S.-F. Chang. “Tools and techniques for color image retrieval", In Proc. of