RESEARCH OUTPUTS / RÉSULTATS DE RECHERCHE
Author(s) - Auteur(s) :
Publication date - Date de publication :
Permanent link - Permalien :
Rights / License - Licence de droit d’auteur :
Institutional Repository - Research Portal
Dépôt Institutionnel - Portail de la Recherche
researchportal.unamur.be
University of Namur
Biodiversity mediates the effects of stressors but not nutrients on litter decomposition
Beaumelle, Léa; DE LAENDER, Frederik; Eisenhauer, Nico
Published in:
eLife
DOI:
10.7554/eLife.55659
Publication date:
2020
Document Version
Peer reviewed version
Link to publication
Citation for pulished version (HARVARD):
Beaumelle, L, DE LAENDER, F & Eisenhauer, N 2020, 'Biodiversity mediates the effects of stressors but not
nutrients on litter decomposition', eLife, vol. 9, e55659, pp. 1-40. https://doi.org/10.7554/eLife.55659
General rights
Copyright and moral rights for the publications made accessible in the public portal are retained by the authors and/or other copyright owners and it is a condition of accessing publications that users recognise and abide by the legal requirements associated with these rights. • Users may download and print one copy of any publication from the public portal for the purpose of private study or research. • You may not further distribute the material or use it for any profit-making activity or commercial gain
• You may freely distribute the URL identifying the publication in the public portal ?
Take down policy
If you believe that this document breaches copyright please contact us providing details, and we will remove access to the work immediately and investigate your claim.
Biodiversity mediates the effects of
1
stressors but not nutrients on litter
2
decomposition
3 Léa Beaumelle1,2,§* , Frederik De Laender3 , Nico Eisenhauer1,2 4 *For correspondence: lea.beaumelle@gmail.com(LB)Present address:§INRAE, UMR
SAVE, Villenave d’Ornon, France
1German Centre for Integrative Biodiversity Research (iDiv) Halle-Jena-Leipzig, Deutscher
5
Platz 5e, 04103 Leipzig, Germany;2Institute of Biology, Leipzig University, Deutscher Platz
6
5e, 04103 Leipzig, Germany;3Research Unit of Environmental and Evolutionary Biology,
7
Namur Institute of Complex Systems, and Institute of Life, Earth, and the Environment,
8
University of Namur, Rue de Bruxelles 61, 5000, Namur, Belgium
9
10
Abstract Understanding the consequences of ongoing biodiversity changes for ecosystems is a 11
pressing challenge. Controlled biodiversity-ecosystem function experiments with random 12
biodiversity loss scenarios have demonstrated that more diverse communities usually provide 13
higher levels of ecosystem functioning. However, it is not clear if these results predict the 14
ecosystem consequences of environmental changes that cause non-random alterations in 15
biodiversity and community composition. We synthesized 69 independent studies reporting 660 16
observations of the impacts of two pervasive drivers of global change (chemical stressors and 17
nutrient enrichment) on animal and microbial decomposer diversity and litter decomposition. 18
Using meta-analysis and structural equation modelling, we show that declines in decomposer 19
diversity and abundance explain reduced litter decomposition in response to stressors but not to 20
nutrients. While chemical stressors generally reduced biodiversity and ecosystem functioning, 21
detrimental effects of nutrients occurred only at high levels of nutrient inputs. Thus, more intense 22
environmental change does not always result in stronger responses, illustrating the complexity of 23
ecosystem consequences of biodiversity change. Overall, these findings provide strong empirical 24
evidence for significant real-world biodiversity-ecosystem functioning relationships when human 25
activities decrease biodiversity. This highlights that the ecosystem consequences of observed 26
biodiversity change are nontrivial and depend on the kind of environmental change. 27
28
Introduction
29
Human activities cause global environmental changes with important consequences for biodiversity 30
and the functioning of ecosystems. Understanding these consequences is crucial for better policy 31
and conservation strategies, which will ultimately promote human well-being too (IPBES, 2019). 32
A key question is to what extent changes in ecosystem functioning are mediated by changes at 33
which dimensions of biodiversity. Extensive research has demonstrated that biodiversity is needed 34
for the stable provenance and enhancement of ecosystem processes and functions (Cardinale 35
et al., 2012;Schuldt et al., 2018;Tilman et al., 2012). However, this body of evidence is mostly 36
based on experiments comparing ecosystem functioning in artificial communities with varying 37
number of species. Such experiments might not capture the complex ways by which shifts in 38
biodiversity induced by global change ultimately affect ecosystem functioning (De Laender et al., 39
2016;Eisenhauer et al., 2019b). 40
Early biodiversity-ecosystem function (BEF) experiments typically controlled for environmen-41
tal gradients, thus not accounting for the underlying drivers of biodiversity change (De Laender 42
et al., 2016;Srivastava and Vellend, 2005;Wardle, 2016). These early experiments also focused on 43
species richness as the sole biodiversity index, and manipulated it directly and randomly. How-44
ever, environmental change will often elicit non-random changes in several facets of biodiversity 45
(Eisenhauer et al., 2016;Giling et al., 2019;van der Plas, 2019) (community composition and pop-46
ulation densities (Glassman et al., 2018;Spaak et al., 2017), functional diversity (Cadotte et al., 47
2011;Craven et al., 2018;Heemsbergen et al., 2004), trophic diversity (Soliveres et al., 2016;Wang 48
and Brose, 2018;Zhao et al., 2019), or intra-specific diversity (Des Roches et al., 2018)). The se-49
lective effects of environmental change emerge because organisms differ in their response to 50
environmental change. For example, larger organisms and predators are often more negatively 51
affected than smaller organisms at lower trophic levels (Hines et al., 2015;Sheridan and Bickford, 52
2011;Srivastava and Vellend, 2005;Voigt et al., 2007). Using realistic extinction scenarios, exper-53
iments found contrasting effects of non-random shifts in biodiversity on ecosystem functioning 54
(e.g.Cárdenas et al., 2017;Jonsson et al., 2002;Melguizo-Ruiz et al., 2020;Oliveira et al., 2019; 55
Smith and Knapp, 2003;Zavaleta and Hulvey, 2004). In addition, several variables that are not 56
directly related to biodiversity control ecosystem functions (e.g. physiological rates (Dib et al., 57
2020;Thakur et al., 2018) and alterations of physical and chemical conditions (De Laender et al., 58
2016;Giling et al., 2019)). When environmental change affects these mechanisms, teasing out the 59
relative importance of biodiversity-mediated effects is complicated even more. Given the number 60
of different potential mechanisms, quantifying the extent to which shifts in biodiversity underpin 61
the effect of environmental change on ecosystem functioning under real-world scenarios of global 62
change is a key challenge for ecology (De Laender et al., 2016;Duffy et al., 2017;Eisenhauer et al., 63
2019b;Srivastava and Vellend, 2005;van der Plas, 2019;Wardle, 2016). Incorporating the impacts 64
of environmental change drivers into BEF studies and meta-analyses is an important step forward 65
to address such questions (De Laender et al., 2016;Eisenhauer et al., 2019b). 66
The vast majority of BEF experiments has focused on plant richness and ecosystem functions 67
such as biomass production (van der Plas, 2019). However, litter decomposition has a tremendous 68
importance in ecosystems and biogeochemical cycles (Follstad Shah et al., 2017). Small changes in 69
the rate of this process can have important consequences for the overall carbon balance. Indeed, 70
increases in decomposition rates could have positive feedback effects on climate warming by 71
enhancing C losses (Kirschbaum, 2000). The diversity of decomposers (invertebrates and micro-72
organisms that fragment and decompose organic matter in both aquatic and terrestrial systems) 73
is crucial for litter decomposition (Eisenhauer et al., 2012;García-Palacios et al., 2013;Gessner 74
et al., 2010;Handa et al., 2014;Hättenschwiler et al., 2005) and for other ecosystem functions as 75
well (Eisenhauer et al., 2019a;Lefcheck et al., 2015;Schuldt et al., 2018). Despite the importance 76
of decomposers, BEF experiments focusing on litter decomposition more often addressed the 77
influence of plant litter diversity than of decomposers (Gessner et al., 2010;Tonin et al., 2018). In 78
a meta-analysis, decomposer diversity had a greater effect on decomposition than the diversity 79
of plant litter (Srivastava et al., 2009), although also weak and neutral effects have been reported 80
(van der Plas, 2019). Facilitation and complementarity through niche partitioning are primary 81
mechanisms underlying the positive relationship between decomposer diversity and decomposition 82
(Gessner et al., 2010;Hättenschwiler et al., 2005;Tonin et al., 2018). Experiments conducted 83
in natural conditions and reflecting realistic extinction scenarios are still relatively scarce, and 84
demonstrate contrasting effects of non-random shifts in decomposer diversity on decomposition 85
(Cárdenas et al., 2017;Jonsson et al., 2002;Melguizo-Ruiz et al., 2020). The need to quantify 86
environmental change effects on decomposer diversity, along with potential knock-on effects on 87
litter decomposition, is therefore particularly pressing. 88
There is a variety of environmental change drivers, and different types of drivers may have 89
diverse effects on biodiversity and ecosystem functions (De Laender et al., 2016;Dib et al., 2020). 90
We postulate that there are two main categories of environmental change: stressors and resource 91
shifts. While stressors cannot be consumed, and act as conditions that alter growth rates (e.g., tem-92
perature, drought, chemical stressors), resources are by definition consumed (e.g., CO
2or mineral
93
nutrients), which has important implications for how they should enter theory (Chase and Leibold, 94
2003;De Laender, 2018). Chemical stressors and nutrient enrichment are important case studies 95
of environmental stressors and resource enrichment, because their presence is increasing rapidly 96
(Bernhardt et al., 2017) and they are projected to have severe effects on biodiversity (Mazor et al., 97
2018). They are also of particular relevance for decomposer communities. Chemical stressors such 98
as metals and pesticides decrease the diversity, abundance, growth and activity of decomposers 99
across terrestrial and aquatic systems (e.g.,Hogsden and Harding, 2012;Pelosi et al., 2014;Schäfer, 100
2019). In contrast, nutrient enrichment can have positive impacts on the abundance and physio-101
logical rates of decomposer organisms by reducing resource limitations (Treseder, 2008), but at 102
the same time decrease decomposer diversity (Lecerf and Chauvet, 2008;Woodward et al., 2012). 103
Across ecosystems, stressors and nutrients can exert opposite impacts on litter decomposition 104
rates, with decreases in response to chemical stressors but increases following nutrient enrichment 105
(Ferreira et al., 2015,2016). In addition, decomposition involves both microorganisms and inverte-106
brates (Bardgett and van der Putten, 2014;Gessner et al., 2010;Hättenschwiler et al., 2005) that 107
may respond differently to stressors and nutrients with a higher sensitivity of invertebrates than 108
microorganisms (Peters et al., 2013;Siebert et al., 2019). Although many published case studies 109
report shifts in decomposer diversity and in rates of litter decomposition at sites impacted by 110
stressors and nutrients, biodiversity-mediated effects have not yet been quantified across systems. 111
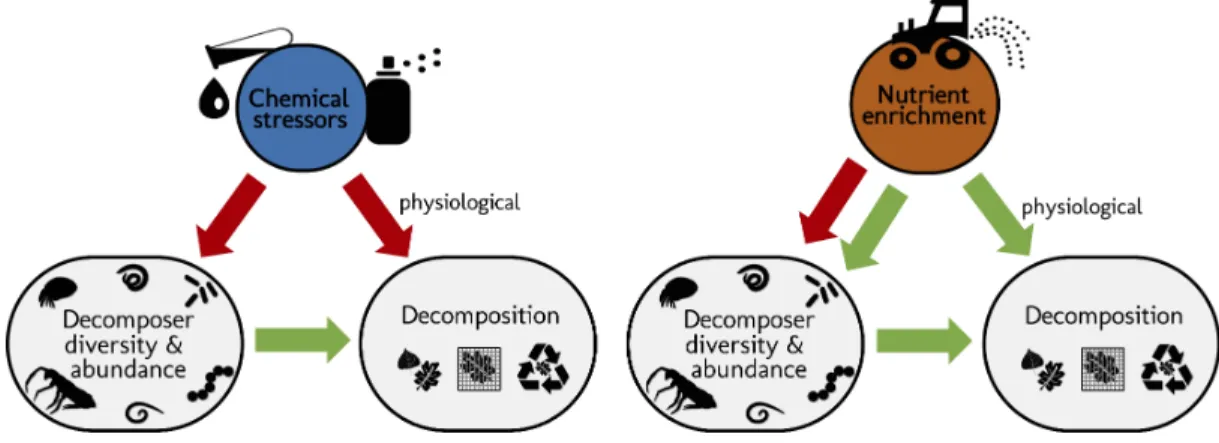
Here we addressed the question if the effects of stressors and nutrient enrichment on decom-112
poser diversity and abundance explain the response of litter decomposition to these two types 113
of pervasive environmental change drivers (Figure 1). We synthesized 69 published case studies 114
reporting the impact of stressors (metals, pesticides) and nutrients (nitrogen or phosphorous 115
additions) on litter decomposition and on decomposer diversity (taxa richness, Shannon diversity, 116
evenness) or abundance (density, biomass) at sites differing in stressor or nutrient levels. Our 117
comprehensive global dataset of 660 observations encompasses studies across taxonomic groups 118
(animal (soil micro-, meso- and macrofauna, stream macroinvertebrates) and microbial (fungi and 119
bacteria) decomposers), ecosystems (aquatic and terrestrial), and study types (experimental and 120
observational) (Figure 2). We quantified the effect size of environmental change on decomposer 121
diversity or abundance and on litter decomposition within studies using correlation coefficients 122
between stressor or nutrient levels and decomposer diversity, abundance, and litter decomposition. 123
We also characterized stressor and nutrient intensities, and standardized their levels in water, soil, 124
or sediment using environmental quality criteria issued by environmental authorities (e.g. ECHA, 125
USEPA, UKTAG). Using meta-analysis and structural equation modelling (SEM), we first compared 126
the overall effects of stressors and nutrients on decomposers and decomposition across systems 127
and studies (first meta-analysis), and second, addressed to what extent changes in decomposer 128
diversity and abundance mediate the impacts of these two contrasting drivers of environmental 129
change on decomposition (second meta-analysis and SEM). Third, we explored the effects of three 130
main moderators on decomposers diversity, abundance, and decomposition responses, as found 131
in the second meta-analysis: stressor or nutrient intensity, taxonomic group (animal vs. microbes) 132
and study type (experimental vs. observational studies). 133
We expected that chemical stressors and nutrients would have contrasting effects on de-134
composer diversity and abundance, and on litter decomposition across ecosystems and studies 135
(Figure 1). We hypothesized that chemical stressors generally decrease decomposer diversity, 136
abundance (Hogsden and Harding, 2012;Petrin et al., 2008), and litter decomposition rates ( Fer-137
reira et al., 2016;Peters et al., 2013), and that nutrients generally decrease decomposer diversity 138
(Lecerf and Chauvet, 2008;Woodward et al., 2012) but increase decomposer abundance and litter 139
decomposition rates (based on physiological effects and decreasing resource limitations (Bergfur 140
et al., 2007;Ferreira et al., 2015;Treseder, 2008;Woodward et al., 2012)). We further hypothesized 141
that litter decomposition responses to environmental change depend on changes in decomposer di-142
Figure 1. Schematic representation of the structural hypotheses tested in this study. Green arrows
depict expected positive effects, red arrows represent negative effects. Stressors and nutrients are hypothesized to decrease decomposer diversity. The response of decomposers diversity to environmental change drivers determines the response of decomposition (Srivastava et al., 2009). Nutrients are hypothesized to increase decomposer abundance. Stressors and nutrients can affect litter decomposition independent of changes in decomposer diversity and abundance, especially through changes in physiological activity (De Laender et al., 2016, Giling et al., 2019).
versity and abundance, and expected an overall positive relationship independent of environmental 143
change intensity (Srivastava et al., 2009). 144
Results
145
Description of the data and overall patterns 146
The final dataset contained 69 (case) studies from 59 publications, representing 660 observations. 147
Data were mostly from Europe (44 ; 443 (studies; observations)) and North and South America (19; 148
168), while Asia (2; 9) and Oceania (4, 40) were less well represented (Figure 2.A). The studies covered 149
aquatic (55; 388) and terrestrial systems (14; 272) (Figure 2.C), and used observational (43; 336) or 150
experimental approaches (26; 324). Studies reported abundance (66; 463) or diversity responses 151
(48; 197) (Figure 2.B) of soil and benthic invertebrates (48; 509) and microbes (fungi and bacteria) 152
associated with litter materials (36; 151) (Figure 2.C). Chemical stressors were mostly metals (13; 153
257) and pesticides (12; 66) associated with industrial activities, accidental spills, and agricultural 154
practices. Nutrient enrichment studies addressed fertilization by various N and/or P forms (26; 155
175), and eutrophication due to agricultural runoffs (10; 59) or wastewater effluents (4; 44). There 156
was no study reporting nutrient enrichment impacts on soil decomposer diversity in the dataset. 157
Funnel plots and intercepts of Egger’s regression showed evidence for positive publication bias in 158
nutrient enrichment studies reporting decomposer abundance (Appendix 2-Figure 2, -Table 1). No 159
publication bias was detected in the other datasets. 160
We found largely contrasting effects of stressors and nutrients on each of the three response 161
variables in a first-level meta-analysis comparing the overall effects of the two drivers of environ-162
mental change (Figure 3,Appendix 2-Table 2). Chemical stressors overall decreased decomposer 163
diversity, abundance and litter decomposition across studies (Figure 3). Nutrient enrichment 164
tended to decrease decomposer diversity but to increase abundance, and decomposition, although 165
these trends were not significant as indicated by confidence intervals of the grand mean effects 166
overlapping with zero (Figure 3). 167
Biodiversity-mediated effects of stressors and nutrients on litter decomposition 168
The responses of decomposition and of decomposer diversity and abundance to chemical stressors 169
were correlated: decreases in decomposition were associated with decreases in decomposer 170
diversity and abundance (Figure 4upper panels). We did not find such a relationship for nutrients. 171
Figure 2. Description of the data used in the present meta-analysis. A: countries represented and
corresponding number of observations, B: decomposer diversity and abundance metrics covered, and C: ecosystem types and decomposer taxonomic groups (animals: soil micro-, meso-, macro-fauna, stream macroinvertebrates; and microbial decomposers: fungi and bacteria) represented.
Figure 3. Grand mean effect sizes of chemical stressors and nutrient enrichment on decomposer diversity (taxa richness and diversity indices), abundance (density and biomass), and litter decomposition. Effect sizes are z-transformed correlation coefficients. Error bars show 95% confidence
intervals. Numbers in parentheses indicate number of studies and observations, respectively. Symbols show the significance level for the comparison between mean effect size and zero (∗∗∗P <0.001; ∗ P <0.05). For full
Figure 4. Relationship between the responses of decomposition and decomposer diversity and abundance to chemical stressors and nutrient enrichment. Variables are effect sizes (z-transformed
correlation coefficients) of stressors or nutrients on litter decomposition and on animal and microbial decomposer diversity (left panels) or abundance/biomass (right panels). Gray symbols are individual
observations of effect sizes; Colored symbols indicate the mean effect size on biodiversity or abundance across effect sizes on litter decomposition. Darker colors represent a higher standardized level of environmental change. Lines represent meta-regressions between effect sizes for decomposition and decomposers, where solid lines are statistically significant (P <0.05), dashed lines are non-significant (P >0.05), and thin lines depict the regression’s confidence interval. QM andP represent the model heterogeneity P-value of the
meta-regressions, respectively, with sample size (number of studies; number of observations).
Instead, a range of positive and negative responses of decomposer diversity, abundance, and 172
decomposition to nutrients were found, without significant associations between them (Figure 4 173
lower panels). In addition, when decomposer diversity and abundance responses to nutrients were 174
close to zero, there was a wide range of decomposition responses (intercepts fromFigure 4lower 175
panels). 176
According to our overarching hypothesis, the SEM indicated that the effects of stressors on litter 177
decomposition were mediated by shifts in decomposer diversity and abundance. Including the 178
direct paths from decomposer diversity or abundance to litter decomposition improved both the 179
models according to mediation tests and AIC comparisons (Figure 5). In addition, the path coeffi-180
cients from diversity and abundance to the decomposition response to stressors had (standardized) 181
values higher than 0.1 (Figure 5) and were statistically different from zero (Appendix 2-Table 3). 182
However, in contrast to chemical stressors, the SEM did not support biodiversity-mediated effects 183
of nutrient enrichment on litter decomposition. While the mediation test and AIC indicated that 184
the decomposer diversity-mediated path improved the model (Figure 5), the path coefficient was 185
not significantly different from 0 (Appendix 2-Table 3). The decomposer abundance-mediated path 186
of nutrients was not supported by the data: an SEM without the direct path from decomposer 187
abundance to decomposition could not be rejected based on the mediation test (Figure 5), and 188
including this path did not improve the model according to the AIC comparison. Besides, we found 189
publication bias in this dataset (Appendix 2-Figure 2, -Table 1), and model check indicated that the 190
residuals of the nutrients-abundance model were non-independent from the fitted values. Thus, 191
the results from this model are reported here for comparison purposes only. 192
The magnitude of the biodiversity-mediated effects of chemical stressors on decomposition was 193
stronger than that of the direct effects of stressor intensity on decomposition. The indirect effect of 194
stressors on decomposition mediated by diversity (i.e. mathematical product of the standardized 195
paths from stressor intensity to decomposer diversity and from diversity to decompositionFigure 5) 196
was higher than the direct effect of stressors on decomposition, while the abundance-mediated 197
effect of stressors was negligible (Figure 5). In the case of nutrient enrichment, however, decomposi-198
tion responses were not explained by shifts in decomposer diversity and abundance, and the direct 199
effects of nutrient intensity dominated the total effect (Figure 5). Finally, between-model compar-200
isons (based on unstandardized path coefficients (Grace, 2006)) revealed that decomposer diversity 201
was a stronger driver of decomposition response to stressors than decomposer abundance (unstan-202
dardized paths were 0.42 and 0.24 respectively for diversity and abundance,Appendix 2-Table 3). 203
Sensitivity analyses revealed that the results were robust to the inclusion of approximated 204
standard deviations (Appendix 3- -Table 1, -Table 2), and extreme values of effect sizes (Appendix 3 -205
Table 3, -Table 4). We found partially different results when using log-response ratios as effect 206
sizes (Appendix 3-Table 5, -Table 6), due to lower sample sizes and emergence of extreme values in 207
these datasets. In addition, the log-response ratio is probably sensitive to the various metrics of 208
biodiversity, abundance, and decomposition covered by the individual studies that we included, 209
while correlation coefficients better accommodate such discrepancies (Koricheva et al., 2013). 210
Response of animal and microbial decomposers and decomposition to stressor and 211
nutrient intensity 212
Despite the overall negative effects of stressors on decomposition, negative responses in decompo-213
sition were not associated with higher stressor intensity (Figure 5,Figure 6). This result held for two 214
complementary approaches: multivariate SEM (Figure 5) that relied on data resampling to account 215
for replicated values of decomposition matching several decomposer responses (e.g. for different 216
taxa in the same litterbag), and meta-regressions (Figure 6) where data resampling was not neces-217
sary (see Methods). There was mixed support for a stressor intensity effect on decomposer diversity 218
across the two approaches: decomposer diversity responses decreased with stressor intensity 219
according to the SEM (Figure 5), but this trend was not significant according to the second level 220
meta-analysis (Figure 6). Similar slopes were obtained both with the SEM relying on data resampling 221
(the slope of the relationship was -0.10 ± 0.04,Appendix 2-Table 2) and with the meta-regression 222
(the slope was -0.05 ± 0.03). The differences between the two approaches can be explained by 223
the different data included. Decomposer abundance responses were not associated to stressor 224
intensity in both the SEM and meta-regression approaches (Figure 5,Figure 6). We found different 225
patterns for nutrient enrichment, where decomposition responses decreased with nutrient intensity 226
(Figure 5,Figure 6), from positive effects at low intensity to negative effects at higher intensity ( Fig-227
ure 6). A similar pattern was observed for decomposer diversity, where responses decreased with 228
nutrient intensity from positive to neutral to negative responses at high nutrient levels (Figure 6). 229
Nutrient intensity, however, did not explain the responses of decomposer abundance (Figure 5, 230
Figure 6), and both positive and negative responses were found at high nutrient levels. 231
The meta-analysis further revealed clear discrepancies between the response of animal and 232
microbial (fungi and bacteria) decomposers to stressors and nutrients. Animal decomposers 233
responded more strongly to chemical stressors than microbial decomposers. The mean effects 234
of chemical stressors on animal decomposer diversity and abundance were more negative than 235
that on microbial decomposers, confirmed by Wald type tests of the second-level meta-analyses 236
(Figure 7upper panels,Appendix 2-Table 4). Animal decomposers overall decreased in diversity but 237
Figure 5. Decomposer diversity and abundance explained litter decomposition response to chemical stressors but not to nutrient enrichment. Structural equation models investigating decomposer
diversity-or abundance-mediated effects of chemical stressdiversity-ors and nutrient enrichment on litter decomposition across 69 studies. Arrows represent relationships between stressor or nutrient intensity levels, and effect sizes of stressors or nutrients on litter decomposition and on decomposer diversity (taxa richness, Shannon diversity, or evenness: left panels) or abundance and biomass (right panels). Values along the arrows are standardized path coefficients. Green, red, and gray arrows indicate positive, negative, and non-significant relationships, respectively. Curved arrows depict the indirect effects of stressors or nutrients on decomposition as mediated by diversity or abundance. Arrow widths are scaled relative to the magnitude of standardized path coefficients. C statistic,P-value (P <0.05 indicate poor model fit), and sample sizes (number of studies; number of
observations). Results of mediation tests: comparison with models omitting the path from diversity or abundance to decomposition (ΔAIC < -2 indicates that reduced models were not consistent with the data).
Figure 6. Decomposer and decomposition responses to the intensity levels of chemical stressors and nutrient enrichment. Values are effect sizes (z-transformed correlation coefficients). Stressor or nutrient
intensity represents the standardized level of environmental change in the treatment with the highest level (values <0: observed level below quality criteria considered to be safe for the environment; values > 0: observed level above quality criteria). Point size is proportional to the inverse of the variance in effect size. Lines are the slopes and 95% confidence intervals from bivariate meta-regressions, with associated QM statistics,P-value and sample size (number of studies; number of observations).
Figure 7. Moderator effects on decomposer diversity and abundance and on decomposition responses to chemical stressors and nutrient enrichment. Responses of decomposer diversity (taxa richness and
diversity indices) and abundance (densities and biomass) to stressors and nutrients according to the taxonomic group (animals and microbes) and study type (Expe. = experimental; Obs. = observational studies). Values are mean effect sizes (z-transformed correlation coefficients) and 95% confidence intervals derived from
meta-analytic models. Sample sizes are reported for each moderator: (number of studies; number of observations).
increased in abundance in response to nutrient enrichment (Figure 7, lower panels). On the other 238
hand, the mean effects of nutrients on microbial decomposer diversity and abundance had lower 239
magnitudes compared to animals (Appendix 2-Table 4), with confidence intervals overlapping with 240
zero (Figure 7lower left panel). Finally, there was no clear difference between observational and 241
experimental studies (Figure 7,Appendix 2-Table 4), and between biodiversity responses in terms 242
of taxa richness or of diversity indices (Appendix 2-Table 4). 243
Discussion
244
The present synthesis brings new insights into how changes in decomposer biodiversity induced 245
by two pervasive drivers of environmental change ultimately affect decomposition. We find con-246
comitant changes in biodiversity and decomposition under the influence of chemical stressors 247
but not nutrient enrichment, highlighting that real-world patterns relating shifts in biodiversity 248
and ecosystem functioning depend on the type of environmental change. In fact, we observed 249
significant correlations between effects on biodiversity and ecosystem function in a scenario where 250
chemical stressors caused a significant decline in biodiversity. In contrast, in cases where nutri-251
ent enrichment caused variable responses in biodiversity, relationships between biodiversity and 252
ecosystem function responses were weaker. It remains an understudied but important question if 253
results of controlled BEF experiments are applicable to non-random changes in biodiversity caused 254
by human activities (e.g.,De Laender et al., 2016;Duffy et al., 2017;Eisenhauer et al., 2019b; Sri-255
vastava and Vellend, 2005;van der Plas, 2019;Wardle, 2016). The present results provide strong 256
empirical evidence for significant real-world BEF relationships when human activities decrease 257
biodiversity. 258
Biodiversity-mediated effects of chemical stressors on decomposition 259
Chemical stressors caused consistent reductions in decomposer diversity and abundance as well as 260
in litter decomposition rates, in line with several previous case studies (Beketov et al., 2013;Malaj 261
et al., 2014) and meta-analyses (Ferreira et al., 2016;Peters et al., 2013). Adding to the previous 262
knowledge, the present meta-analysis shows that changes in decomposer diversity and abundance 263
explained the decomposition response to stressors, providing evidence for the expectation that 264
shifts in biodiversity mediate the impact of chemical stressors on decomposition. We acknowledge 265
that despite the SEM analysis, the approach conducted here remains correlative. However, our 266
study builds on a body of experimental and observational evidence that already demonstrated that 267
more diverse and abundant decomposer communities support higher decomposition rates, albeit 268
not under the influence of environmental change (e.g.García-Palacios et al., 2013;Handa et al., 269
2014). 270
We especially complement a previous meta-analysis showing the importance of decomposer 271
diversity for decomposition across experiments manipulating the richness of invertebrate and 272
microbial decomposer communities (Srivastava et al., 2009). We extend on this and show that 273
non-random biodiversity losses induced by stressors are closely associated with decreases in 274
decomposition across a wide range of studies. A recent review pointed out that in naturally-275
assembled terrestrial communities, studies more often found neutral and to a lesser extent positive 276
relationships between decomposer diversity and decomposition (van der Plas, 2019). In that 277
review, communities were not influenced by environmental change drivers, and the vote counting 278
approach used is sensitive to the statistical power of individual studies and could have increased 279
the probability of finding non-significant relationships (Koricheva et al., 2013). In line with our 280
findings, an experiment mimicking the sequence in which freshwater invertebrate decomposers 281
are lost after disturbances showed that decreasing non-randomly the number of species decreased 282
decomposition rates (Jonsson et al., 2002). 283
Biodiversity-ecosystem function experiments manipulating biodiversity directly are key to un-284
derstand the mechanisms involved in this relationship (Eisenhauer et al., 2016), especially because 285
they control for the effects of environmental heterogeneity or abundance. However, in real-world 286
scenarios, environmental change drivers affect both biodiversity and abundance simultaneously. As 287
demonstrated here, this is especially the case for stressors that decrease decomposer diversity and 288
abundance (Hogsden and Harding, 2012). The abundance or biomass of different decomposers 289
is of critical importance for decomposition (e.g.Bergfur et al., 2007;Ebeling et al., 2014;Manning 290
and Cutler, 2018). Even at constant richness and community composition, strong decreases in 291
abundance can have important impacts on ecosystem functioning (Spaak et al., 2017; but see 292
Dainese et al., 2019). It is beyond the scope of the present meta-analysis to disentangle the effects 293
of biodiversity from the effects of abundance, and we found that both contributed to explain shifts 294
in decomposition in separate analyses. It is interesting to note that the few cases where negative 295
effect sizes of stressors on biodiversity were associated with positive effect sizes on decomposition 296
were also cases where decomposer abundance was positively associated with stressors (Figure 4). 297
Although we cannot specifically test this with the present data, it seems that in those particular 298
cases, increases in decomposer abundance counteracted the negative effects of decreases in 299
decomposer diversity (Lucisine et al., 2015). Those results could therefore be in line with the mass-300
ratio hypothesis (Grime, 1998;Smith and Knapp, 2003). Indeed, an exclusion experiment showed 301
that dominant, small, detritivores can compensate reductions in litter decomposition caused by 302
the removal of large detritivores (Cárdenas et al., 2017). These concomitant shifts in both diversity 303
and abundance further have important implications for our estimates of diversity responses, as 304
studies mostly reported richness to estimate decomposer diversity, but rarely corrected for the 305
sampling effort (Gotelli and Colwell, 2001). This means that lower abundances rather than a lower 306
number of speciesper se might have directly caused some of the negative effects on biodiversity 307
reported here (Chase and Knight, 2013). This common caveat in meta-analysis approaches that 308
rely on how individual studies report biodiversity, also applies to the present study, and reinforces 309
the importance of reporting raw data in future studies of the impacts of chemical stressors on 310
biodiversity and ecosystem functioning. 311
The effects of changes in decomposer diversity and abundance on decomposition found in 312
the present study might also have channeled changes in community and food-web structure 313
not captured by our biodiversity metrics. Changes in keystone species (Hättenschwiler et al., 314
2005), functional diversity (Cadotte et al., 2011;Dangles et al., 2012;Heemsbergen et al., 2004), 315
vertical diversity (Gessner et al., 2010;Melguizo-Ruiz et al., 2020;Wang and Brose, 2018;Zhao et al., 316
2019), or dominance patterns (Dangles and Malmqvist, 2004) might have shifted concomitantly to 317
taxonomic diversity and abundance. Moreover, these different components of diversity might act 318
at different timings of decomposition (Oliveira et al., 2019). Unfortunately, studies rarely reported 319
such measurements together with decomposition. For example in our dataset, only 7 studies 320
reported evenness. Future studies need to explore shifts in decomposer community composition in 321
more detail to better understand what particular aspect of biodiversity is responsible for changes 322
in decomposition rates (Giling et al., 2019;Hättenschwiler et al., 2005). In particular, few of the 323
included studies reported comparable functional groups allowing to address the effect of functional 324
diversity across the multiple systems and taxonomic groups addressed by the present analysis. 325
Future synthesis work could specifically address the effect of functional diversity, by focusing on a 326
given system type. Indeed, there is ample evidence that shifts in functional diversity are crucial for 327
decomposition (Heemsbergen et al., 2004), and that facilitative interactions occur primarily between 328
decomposers of contrasting body size (Dangles et al., 2012;Tonin et al., 2018). This is especially the 329
case for interactions between animal and microbial decomposers, where fragmentation of litter by 330
detritivores facilitates access for microbial decomposers (Eisenhauer et al., 2010;Hättenschwiler 331
et al., 2005;Yang et al., 2012). 332
Here, we found that invertebrates were more affected by chemical stressors than microbes, 333
across aquatic and terrestrial ecosystems. Invertebrate decomposers are particularly sensitive to 334
the impacts of metals and pesticides (Hogsden and Harding, 2012;Pelosi et al., 2014;Peters et al., 335
2013;Schäfer, 2019). Microbial decomposers are known to be sensitive to metals (Giller et al., 336
2009) and pesticides as well (DeLorenzo et al., 2001). Nevertheless, our result is consistent with the 337
general expectation that larger organisms are more sensitive to environmental change due to longer 338
generation time, higher energetic demands and lower population densities (Hines et al., 2015; 339
Sheridan and Bickford, 2011;Woodward et al., 2005;Yvon-Durocher et al., 2011). These different 340
sensitivities between groups of decomposers could imply that the biodiversity-mediated effects of 341
stressors on decomposition are more strongly linked to shifts in invertebrates than microbes, as 342
reported in a previous review (Peters et al., 2013). However, in another meta-analysis focusing on 343
microbial-driven decomposition rates, changes in fungal biomass and richness explained shifts in 344
decomposition under the impacts of chemical stressors, but also of nutrient enrichment (Lecerf 345
and Chauvet, 2008). 346
Nutrient-induced changes in decomposition were not related to shifts in decom-347
poser diversity 348
The impacts of nutrient enrichment on litter decomposition and decomposer diversity were different 349
from those caused by stressors, confirming our expectations. These different biodiversity and 350
function responses led to different emergent relationships between decomposer diversity and 351
decomposition compared to stressors. We found that nutrients had a variety of effects ranging from 352
positive to negative depending on the taxonomic group (Figure 7) and nutrient intensity (Figure 6), 353
and resulting in neutral overall mean effects (Figure 3). Previous syntheses also found positive 354
(Ferreira et al., 2015) as well as inconsistent (Knorr et al., 2005) responses of decomposition rates 355
to nutrient enrichment in streams. The relatively small mean effect of nutrient enrichment on 356
decomposition in the present meta-analysis could be explained by the use of correlation as an effect 357
size, which does not capture potentially non-monotonic responses of decomposition to nutrients 358
(Woodward et al., 2012). However, we noted that most of the studies included in the present 359
meta-analysis did not individually span nutrient gradients sufficiently large to capture this potential 360
non-monotonous response. Taken together, the studies show positive effects on decomposition 361
at low nutrient intensities that shifted towards neutral to negative effects at higher intensities 362
(Figure 6), which is consistent with previous findings (Ferreira et al., 2015;Woodward et al., 2012). 363
Low nutrient intensities might have enhanced microbial activity and biomass by alleviating resource 364
limitation, resulting in enhanced decomposition. At higher intensities, however, negative impacts 365
on invertebrates might have decreased decomposition rates (Peters et al., 2013;Woodward et al., 366
2012). 367
These nutrient intensity patterns contrasted with the results for chemical stressors. The overall 368
negative effects of stressors (Figure 1) on decomposition were not explained by stressor intensity 369
levels (Figure 6), and there was mixed support for a stressor intensity effect on decomposer diversity 370
based on two complementary data analysis approaches (SEM based on data resampling (Figure 5) 371
vs. second level meta-analysisFigure 6). Thus, negative responses to chemical stressors happened 372
across the range of stressor intensity. Such contrasting patterns between stressor and nutrient 373
intensity effects may reflect the greater number of stressor types (different metals, pesticides, 374
mixtures) covered by individual studies compared to the limited number of nutrients. In addition, 375
due to the higher variability of stressor types, we relied on more variable sources to standardize 376
stressor levels compared to nutrients in the diversity dataset (Methods,Appendix 1-Table 1). With 377
the data at hand, it was not possible to test the influence of the environmental quality criteria 378
used to standardize stressor and nutrient levels, because such an effect would be confounded with 379
stressor or nutrient types. The datasets were all dominated by environmental quality criteria based 380
on similar methodologies (for 75 to 100% of observations, see Methods). However, future studies 381
focusing on stressor intensity effects across ecosystems would greatly benefit from coordinated 382
efforts to derive quality criteria encompassing the vast and rapidly increasing number of chemical 383
stressors (Wang et al., 2020). 384
Contrary to our expectation, nutrient-induced shifts in decomposer diversity and abundance 385
were not associated with shifts in decomposition rates across studies. We found that increasing 386
nutrient intensity decreased the effects on decomposition and on decomposer diversity, but not 387
on decomposer abundance. Statistically controlling for the effect of nutrient intensity with SEM 388
indicated no residual association between shifts in decomposer diversity or abundance and in 389
decomposition rates, i.e. a non-significant BEF relationship. Changes in microbial abundance 390
in response to nitrogen deposition explained the responses of different ecosystem functions in 391
terrestrial systems in previous meta-analyses (García-Palacios et al., 2015;Treseder, 2008). Here 392
we show that this pattern cannot be generalized across aquatic and terrestrial systems and across 393
animal and microbial decomposers. Contrary to stressors, when the diversity and abundance of 394
animal and microbial decomposers were not affected by nutrients, we observed large positive 395
and negative shifts in decomposition (intercepts of Figure 4), that were explained by nutrient 396
intensity (Figure 4: negative effects on decomposition at invariant biodiversity are associated 397
with high intensities and positive effects with lower intensities). Together, these results show 398
that nutrient-induced shifts in decomposer diversity were not as strong drivers of decomposition 399
changes as stressor-induced biodiversity shifts. These differences may be partly due to the different 400
mechanisms underlying the effects of stressors and nutrients. Based on previous studies, we 401
speculate that our results are due to the complex responses of animal and microbial decomposers 402
at different nutrient intensities (Ferreira et al., 2015;Lecerf and Chauvet, 2008;Treseder, 2008; 403
Woodward et al., 2012). 404
Animal decomposers showed a stronger response to nutrients than microbes. Invertebrate 405
decomposers overall decreased in diversity, but they increased in abundance under nutrient 406
enrichment. These results could reflect a loss of sensitive taxa to the benefit of tolerant taxa that 407
were able to use additional resources and would then increase in density (Bergfur et al., 2007). 408
Overall, microbial decomposers responded little to nutrient enrichment, probably reflecting a 409
mixture of positive and negative effects that nutrients can have on microbial growth (Lecerf and 410
Chauvet, 2008;Treseder, 2008), as well as on different microbial taxa. Indeed, nutrients can alleviate 411
resource limitations at low intensities, but can also exert toxic effects at high intensities. The initial 412
levels of nutrients thus condition subsequent responses in decomposers and decomposition to 413
nutrient enrichment (Ferreira et al., 2015;Knorr et al., 2005). Furthermore, at high intensities, 414
nutrients can be associated with other chemical stressors (e.g. pesticides in agricultural runoffs) 415
(Ferreira et al., 2015;Woodward et al., 2012). The influence of interactive effects of stressors and 416
nutrients was impossible to quantify with the data at hand, given that only a few experiments 417
assessed the effects of both drivers independently, but many observational studies may have 418
been confounded by such joint effects. Chemical stressors and nutrients are often co-occurring in 419
e.g. agricultural landscapes, and the consequences of such combinations are still poorly understood. 420
Furthermore, stressor and nutrient effects might be modulated by climatic and other environmental 421
conditions, and studies on interaction effects are scarce (Rillig et al., 2019;Thakur et al., 2018). 422
Finally, although our comparison of stressors versus resources allowed us to test a clear concept, 423
any kind of grouping in ecological studies may mask some of the variation within the categories 424
and future studies may be interested in different categories. As data availability improves, future 425
work could include different environmental change drivers. This would also allow to test additional 426
groupings of drivers and ecological concepts unifying stressors and resources (De Laender, 2018; 427
Harley et al., 2017). 428
Conclusions
429
In conclusion, this study brings new insights into the real-world patterns relating ecosystem function 430
to non-random changes in biodiversity induced by environmental change. We found that the conse-431
quences of changes in biodiversity for ecosystem functioning depend on the type of environmental 432
change. Real-world scenarios do not necessarily involve concomitant changes in both biodiversity 433
and function across terrestrial and aquatic systems. We further found that with the environmental 434
quality criteria used in risk assessment, there were already significant positive and negative effects 435
on decomposers and decomposition (Figure 6), highlighting the need to better incorporate biodi-436
versity and ecosystem function into ecological risk assessment programs (De Laender and Janssen, 437
2013). Finally, we report overall negative effects of chemical stressors on biodiversity and ecosys-438
tem functioning across terrestrial and aquatic ecosystems that reinforce recent calls to consider 439
chemical stressors as important global change drivers and address their impacts on biodiversity 440
and ecosystems (Bernhardt et al., 2017;Mazor et al., 2018;Steffen et al., 2015). Positive real-world 441
BEF relationships may be particularly significant in cases where environmental changes decrease 442
biodiversity, such as in the case of chemical stressors. Such information are crucial if we are to 443
design policy and conservation strategies able to reconcile human development with biodiversity 444 conservation. 445
Methods
446 Data collection 447We searched the Web of Science for studies that addressed the impact of environmental drivers and 448
recorded decomposer community responses and litter decomposition rates. The search strategy 449
is fully reported in Supplementary Methods (Appendix 1). The search retrieved 2536 references. 450
Abstracts and titles were screened to identify a final set of 61 records that met our inclusion criteria 451
(PRISMA plot,Appendix 1-Figure 1, and list of included references (Appendix 4)). To be included in 452
the meta-analysis, studies had to: 453
• Report litter decomposition (rates, mass loss, proportion of mass remaining) and the diversity, 454
abundance, or biomass of decomposers at sites differing in chemical stressor or nutrient 455
levels. 456
• Focus on naturally-assembled communities subjected to the impact of chemical stressors or 457
nutrient enrichment. Studies that manipulated decomposer diversity directly were not consid-458
ered to only focus on non-random biodiversity change scenarios. We included mesocosm 459
studies only when they used field-sampled communities and left time for the community 460
to reach an equilibrium in mesocosms in order to reflect real-world conditions as much as 461
possible. 462
• Report the response of animal (benthic macroinvertebrates, or soil micro, meso or macro-463
fauna) or microbial decomposers (bacteria or fungi from decomposing leaves or in surround-464
ing water or soil samples). 465
• Report decomposer abundance (density or biomass), or decomposer diversity (taxa richness, 466
Shannon diversity, evenness). 467
When a reference reported different environmental change drivers or geographical areas with 468
a specific reference site for each case, we considered these as individual (case) studies ( García-469
Palacios et al., 2015). We extracted means or sums, standard deviations, and sample sizes of litter 470
decomposition, decomposer diversity, and abundance (outcomes) in non-impacted vs. impacted 471
sites (control-treatment studies), or at each site when gradients of chemical stressors or nutrients 472
were investigated (gradient studies). When response variables were reported at different time 473
points, we kept only the last time point to capture long-term responses. For studies reporting 474
decomposition, decomposer abundance or diversity for several litter types (e.g. different litter 475
species), several groups of organisms (e.g. functional feeding groups for macroinvertebrates), 476
and several diversity metrics (e.g. Shannon indices and taxon richness), we created separate 477
observations within case studies. We also extracted chemical stressor or nutrient levels at those 478
sites (water, soil, or sediment concentrations of chemical stressors or nutrients, or application rate 479
of pesticides or fertilizers). The study type (experimental vs. observational), taxonomic group (animal 480
decomposers or microbial decomposers) and metric of diversity (taxa richness or diversity indices 481
(Shannon diversity and evenness)) were also recorded. We used the online software Webplotdigitizer 482
to extract data from figures (Rohatgi, 2018). We converted standard errors and confidence intervals 483
into standard deviations using the equations inLajeunesse(2013). When reported as mass loss, 484
litter decomposition data were transformed into k rates using the exponential decay equation used 485
inFerreira et al.(2015). 486
Effect size calculation 487
We used z-transformed correlation coefficients as effect sizes in order to cope with the heterogeneity 488
of data and study types (Koricheva et al., 2013). For control-treatment studies, we first calculated 489
Hedge’s d, and then transformed Hedge’s d into correlation coefficients (Lajeunesse, 2013). For 490
gradient studies (4 or more treatment levels), we calculated correlation coefficients between the 491
mean values of abundance, diversity, or decomposition rate and the corresponding chemical 492
stressor or nutrient concentrations. When means, standard deviations, or sample sizes were 493
missing, we contacted the authors to retrieve the data. When the information could not be 494
retrieved, standard deviations were approximated from the data, using the linear relationship 495
between mean values and standard deviations across our datasets (Lajeunesse, 2013). 496
Standardization of chemical stressors and nutrient enrichment intensities 497
Given the variability in the different stressors and nutrients combinations in the studies, stressor and 498
nutrient levels were standardized into a common environmental change driver intensity (𝐸𝐶𝐷𝑖𝑛𝑡𝑒𝑛𝑠𝑖𝑡𝑦) 499
as follows: 500
𝐸𝐶𝐷𝑖𝑛𝑡𝑒𝑛𝑠𝑖𝑡𝑦= 𝑙𝑜𝑔([𝐶𝑜𝑚𝑝𝑜𝑢𝑛𝑑𝑖]𝑡𝑟𝑒𝑎𝑡𝑚𝑒𝑛𝑡∕[𝐶𝑜𝑚𝑝𝑜𝑢𝑛𝑑𝑖]𝑐𝑟𝑖𝑡𝑒𝑟𝑖𝑎) 501
where [𝐶𝑜𝑚𝑝𝑜𝑢𝑛𝑑𝑖]𝑐𝑟𝑖𝑡𝑒𝑟𝑖𝑎 were environmental quality criteria set by European or US
environ-502
mental authorities for the chemical stressor or nutrient considered (Appendix 1-Table 1), and 503
[𝐶𝑜𝑚𝑝𝑜𝑢𝑛𝑑𝑖]𝑡𝑟𝑒𝑎𝑡𝑚𝑒𝑛𝑡were the concentrations of the chemical stressor or nutrient at the treatment 504
or impacted sites. When multiple stressors or nutrients were reported, we used the standardized 505
intensity of the stressor or nutrient corresponding to the highest standardized intensity for the rest 506
of the analyses. 507
We used consistent sources for the environmental quality criteria as much as possible. For 508
chemicals, we relied primarily on quality criteria from the European Chemical Agency (ECHA) 509
and United States Environmental Protection Agency (USEPA) that use standardized procedures 510
across aquatic and terrestrial realms based on ecotoxicological data. For nutrients, we relied 511
mostly on European Water Framework Directive (WFD) benchmarks. Using various sources for 512
those quality criteria was inevitable due to the high number of chemicals and the various way the 513
authors reported stressor or nutrient levels in individual studies. When we could not find quality 514
criteria for the stressors or nutrients considered in the studies in our main sources, we relied 515
on the authors’ statements and expert knowledge regarding their stressor or nutrient levels (e.g. 516
recommended application rates of pesticides, citation for ecotoxicological data, or synthesis studies, 517
(Appendix 1-Table 1)). Despite this, the final datasets were all dominated by similar sources for 518
standardizing stressor and nutrient intensity levels: thresholds from ECHA or USEPA for 80 and 519
90% of observations in the stressor-diversity and stressor-abundance datasets, respectively, and 520
for nutrients, thresholds from WFD for 100 and 75% of observations in the nutrient-diversity and 521
nutrient-abundance datasets, respectively. 522
Overall effects of chemical stressors and nutrient enrichment: first-level meta-523
analysis 524
We first tested the differences between the effects of chemical stressors and nutrient enrichment 525
on decomposer diversity, abundance and litter decomposition responses by quantifying the grand 526
mean effect sizes on the three response variables (first level analysis). Three separate meta-527
analyses were conducted, one for each response variable, and included the type of driver (stressors 528
or nutrients) as a categorical moderator, and a random effect of the case study. We used a weighted 529
meta-analysis giving more weight to effect sizes derived from studies with larger sample sizes. 530
Weights were the inverse of the variance in z-transformed correlation coefficients (Viechtbauer, 531
2010). Publication bias was evaluated using funnel plots with environmental change driver type as 532
covariate. The intercepts from Egger’s regressions (standardized effect size vs. precision = 1/SE) 533
were inspected for significant deviation from zero that would indicate publication bias (Koricheva 534
et al., 2013). Residual plots were used to detect strong deviation from normality and outliers. 535
We estimated the grand mean effect sizes and compared the effect of chemical stressors and of 536
nutrients using Wald-type chi-square tests. The rma.mv() function of the R package metafor was 537
used (R Core Team, 2018;Viechtbauer, 2010). 538
Relationship between biodiversity and decomposition: Structural equation mod-539
elling 540
An SEM was fitted to estimate the relationship between decomposer diversity or abundance and 541
litter decomposition responses to environmental change drivers while controlling for the joint 542
influence of stressor or nutrient intensity and categorical covariates. We used piecewise SEM 543
(Lefcheck, 2016) estimating two linear mixed effect models, one for decomposition (𝑧𝐿𝐷) and one 544
for decomposer diversity or abundance responses (𝑧𝐵), with a random effect of the case study 545
on the intercepts. These two sub-models embedded in the piecewise SEM were the second-level 546
meta-analyses in our hierarchical approach. The random effect structure, weighting approach and 547
variance structure were coded with the R package nlme (Pinheiro et al., 2018) in a way that fully 548
reproduced the meta-analysis approach of weighting and of known residual variance (Viechtbauer, 549 2016): 550 𝑧𝐿𝐷∼ 𝑧𝐵+ 𝐸𝐶𝐷𝑖𝑛𝑡𝑒𝑛𝑠𝑖𝑡𝑦+ 𝑠𝑡𝑢𝑑𝑦 𝑡𝑦𝑝𝑒, 𝑟𝑎𝑛𝑑𝑜𝑚 =∼ 1|𝐶𝑎𝑠𝑒 𝑠𝑡𝑢𝑑𝑦∕𝐼𝐷 551 𝑧𝐵∼ 𝐸𝐶𝐷𝑖𝑛𝑡𝑒𝑛𝑠𝑖𝑡𝑦+ 𝑠𝑡𝑢𝑑𝑦 𝑡𝑦𝑝𝑒 + 𝑡𝑎𝑥𝑜𝑛𝑜𝑚𝑖𝑐 𝑔𝑟𝑜𝑢𝑝 (+𝑑𝑖𝑣𝑒𝑟𝑠𝑖𝑡𝑦 𝑚𝑒𝑡𝑟𝑖𝑐), 𝑟𝑎𝑛𝑑𝑜𝑚 =∼ 1|𝐶𝑎𝑠𝑒 𝑠𝑡𝑢𝑑𝑦∕𝐼𝐷 552
This SEM was tested separately for each of four datasets: Stressors – Biodiversity; Stressors 553
– Abundance; Nutrients – Biodiversity and Nutrients – Abundance datasets. The influence of the 554
diversity metric (diversity indices versus taxa richness) was tested in the Biodiversity datasets only. 555
We initially considered more complex model structures, but were unable to use them for analysis 556
due to data limitations (in particular the effect of the ecosystem type and of interactions between 557
our covariates). 558
Outliers, relationships between covariates, and non-linear patterns between continuous covari-559
ates were explored graphically. Studies often reported different decomposer diversity or abundance 560
values for the same litter decomposition (e.g. when several taxonomic or functional groups were 561
reported in the same litterbag). This variability could have affected the model estimates. We 562
thus used data resampling to account for duplicated effect sizes on litter decomposition in the 563
analyses. A stratified resampling was conducted, where for each duplicated value of effect size on 564
decomposition, one randomly selected effect size on biodiversity was kept at each out of 1,000 565
iterations. The models were fitted for each data resampling iteration, and we averaged model 566
estimates and statistics across iterations and used the means as final values (path coefficients and 567
standard error of the path and intercepts, Chi-square statistics and AICs). 568
Goodness-of-fit of the SEMs was assessed using directed separation tests based on the Fisher’s 569
C statistic. We used mediation tests to explore the significance of the path between decomposer 570
diversity or abundance and litter decomposition based on the Fisher’s C statistic of SEM that did not 571
include the biodiversity-mediated path (Lefcheck, 2016;Shipley, 2009). We calculated theP-value 572
associated with the mean Fisher’s C statistic across data resampling iterations (P-value < 0.05 573
indicated poor model fit). The AICs of models with and without the biodiversity-mediated paths 574
were further compared using averaged AICs across data resampling iterations. We considered 575
the biodiversity (or abundance) path to be consistent with the data when the SEM without the 576
biodiversity-path hadP-value < 0.05 (poor fit) and was not associated with a better AIC value 577
(i.e. lower than 2 units) than the SEM including the biodiversity path. Residuals from the two sub-578
models of each SEM were graphically evaluated for strong departure to normality and relationship 579
with the fitted values (Duffy et al., 2015). For these analyses, we averaged the residuals across 580
data resampling iterations for each observation. We finally compared the relative magnitude of 581
the biodiversity-mediated path versus the direct path from stressor or nutrient intensity to litter 582
decomposition based on the mathematical product of the standardized path coefficients (Grace, 583
2006). 584
Moderator analyses: Second-level meta-analyses 585
In order to quantify the influence of the categorical (study type, taxonomic group and diversity met-586
rics) and continuous (environmental change intensity) moderators on the three response variables, 587
we further analyzed the results of the second-level meta-analyses (i.e. the sub-models embedded 588
in the SEMs). The data resampling used in the SEM was no longer necessary, because there were 589
no repeated values of decomposition matching different decomposer diversity or abundance mea-590
surements in this univariate approach. We quantified the effects of the different moderators based 591
on the Wald-type chi-square tests derived with the R package metafor (Viechtbauer, 2010). 592
Sensitivity analyses 593
We finally tested the robustness of the results to the approximation of standard deviations, the 594
presence of extreme values, and the metric of effect size used. The analyses were re-run with 595
datasets that did not include the effect sizes for which we approximated standard deviations, for 596
datasets that did not include extreme values of effect sizes (values beyond the whiskers of boxplots 597
i.e. below quantile 1 minus 1.5 times the interquartile range or above quantile 3 plus 1.5 times the 598
interquartile range). Finally, we calculated log-response ratios instead of correlation coefficients as 599
effect sizes and re-run the analyses. 600