HAL Id: halshs-00120383
https://halshs.archives-ouvertes.fr/halshs-00120383
Submitted on 30 Jan 2007
HAL is a multi-disciplinary open access archive for the deposit and dissemination of sci-entific research documents, whether they are pub-lished or not. The documents may come from teaching and research institutions in France or abroad, or from public or private research centers.
L’archive ouverte pluridisciplinaire HAL, est destinée au dépôt et à la diffusion de documents scientifiques de niveau recherche, publiés ou non, émanant des établissements d’enseignement et de recherche français ou étrangers, des laboratoires publics ou privés.
China
Sylvie Démurger, Weiyong Yang
To cite this version:
Sylvie Démurger, Weiyong Yang. Economic changes and afforestation incentives in rural China. Environment and Development Economics, Cambridge University Press (CUP), 2006, pp.629-649. �halshs-00120383�
Economic changes and afforestation incentives in rural China
Sylvie Démurger
HIEBS, the University of Hong Kong and GATE-CNRS (France)
Weiyong Yang
University of International Business and Economics (Beijing)
Corresponding author
:Sylvie Démurger
HK Institute of Economics & Business Strategy (HIEBS) K. K. Leung Building
University of Hong Kong Pokfulam Road, Hong Kong
Tel: (852) 2241-5067; Fax: (852) 2548 1152; E-mail: [email protected]
Word count
: 8384.Abstract:
This paper uses provincial macro-data from the mid-1980s onwards to investigate thedeterminants of land-use choice in rural China, by paying a particular attention to the decision to plant trees as competing with agriculture. The evidence supports the importance of economic motivations in the afforestation decision. A profit-seeking behavior is found to be at stake in the decision to plant trees, which is made according to both the relative profitability of forestry against agriculture, and their relative risks. Afforestation is also found to strongly depend on the pressure upon land as well as on household wealth.
Summary:
During the reform period, Chinese forest resources have increased both in coverage and in standing stock. This is mainly the result of constant afforestation efforts that have more than compensated deforestation during the period. The aim of this paper is to examine the forces that shape the afforestation incentives of rural economic agents, in the context of rapid economic changes since the end of the 1970s. As land resources are scarce compared with the huge population in China, the afforestation activity is analyzed within a framework of land allocation between agriculture and forestry, under the hypothesis that the two sectors compete for land. Several factors can influence activity choices. First, with market developments during the reform period, the choice between agriculture and afforestation is expected to become increasingly sensitive to the relative returns of the two activities, namely, timber prices relative to agricultural prices. Second, as predicted by the portfolio choice theory, abundant risks in a rural economy may induce a diversification strategy by combining agriculture and forestry activities. Third, land-use choice is determined by demographic pressure on land and land quality. Fourth, the changing socio-economic environment in rural China, measured through rural households wealth and the existence of alternative mechanisms of insurance against risks, such as diversification from agriculture to rural industry, can be expected to have an impact on land allocation choices. Evidence from Chinese provinces during the reform period confirms the important role of economic changes in the agro-forestry land allocation. The empirical results show that an increase of forestry prices relative to agricultural prices and a risk increment in agricultural production and price variability all lead to a higher land ratio for afforestation at the expense of agriculture. Similarly, rural wealth is positively related to afforestation efforts. On the contrary, rural population pressure over land reduces afforestation incentives. However, this negative impact is offset by the improvement of land quality and agricultural productivity which can relieve demographic pressure on land.
Acknowledgments:
This paper is drawn from a research program on “Economic Growth and Sustainable Forest Management in China” funded by the Centre National de la Recherche Scientifique (CNRS, France). The authors wish to express their gratitude to Li Junqing, Pascal Marty and Jean-Luc Peyron for their precious collaboration in undertaking the whole research program and to Belton Fleisher, Martin Fournier, Mbolatiana Rambonilaza and Xu Jintao for useful comments on earlier versions of the paper. We are also grateful to two anonymous referees for valuable comments and suggestions. We remain solely responsible for errors and omissions.
Economic changes and afforestation incentives in rural China
Abstract:
This paper uses provincial macro-data from the mid-1980s onwards to investigate thedeterminants of land-use choice in rural China, by paying a particular attention to the decision to plant trees as competing with agriculture. The evidence supports the importance of economic motivations in the afforestation decision. A profit-seeking behavior is found to be at stake in the decision to plant trees, which is made according to both the relative profitability of forestry against agriculture, and their relative risks. Afforestation is also found to strongly depend on the pressure upon land as well as on household wealth.
Keywords:
Forest economics, Land use, Economic development, China.JEL classification:
Q15, Q23, O13, N55.1. Introduction
Since the implementation of the reform and opening-door policy at the end of the 1970s, natural resources and environmental conservation in China has been influenced by opposite trends. Although on the one hand, an increasing concern on the necessity to protect resources and to promote biodiversity conservation began to emerge from the beginning of the 1980s onwards, on the other hand, great economic changes induced by the set of reform policies put a growing pressure on natural systems and the environment (Smil, 1997; Harkness, 1998). This has been clearly the case for air pollution and water conservation, which are threatened by the unprecedented increase in industrial production and fertilizer use in agriculture. Higher income levels generated by the overall economic growth also contributed to increasing pressure on
natural resources and particularly on land, by accelerating demand for agricultural goods as well as for housing and furniture goods.
Concerning forest resources, pressures not only came from land use reallocation needs, but also from timber resources needs, as energy sources or construction materials. However, despite these pressures, the last 25 years have been characterized by an increase in total forested land, which indicates a reversal from former trends of “net” deforestation (Shi and Xu, 2000). Although this positive trend does not mean that forest-clearing behaviors have disappeared, it nonetheless indicates that tree plantings have more than compensated the overall deforestation.
Achieving balanced growth in forested land so as to increase available forest resources is a major challenge that China now faces in order to both satisfy the growing demand for wood in China and relieve its pressure on international forest resources. Given that China’s forest resources only account for 4% of the world forest, while China represents 7% of the world land area and 21% of the world population (FAO, 2003), China can be considered as “forest-deficient” (Lu et al., 2002, p. 9). As such, and being the second largest timber importer in the world (Zhang, 2000), China’s forest-related choices necessarily have strong implications on international reserves.
As the increase of Chinese forest resources over the last 25 years is largely the result of intensive tree planting activities, the aim of this paper is to assess the determinants of afforestation, by focusing on the economic changes that can influence rural forest-related behaviors. Answering the question of the economic incentives for rural economic agents to plant trees is important to understand the evolution of forest resources over the period and to target further policies in order to maintain a sustainable level of forest area. This paper draws on microeconomic theoretical analysis of rural economic agents’ behavior and uses macro data at the province level to highlight the determinants of afforestation efforts in a context of rapid economic and institutional changes.
Economic agents involved in the planting activity in China mainly include rural households, local collectivities and State forestry units. However, as pointed out in the literature (e.g. Hyde et al. 2003, Xu et al. 2004), State forestry units usually do not follow economic incentives1. In particular, most State forests have been in financial arrears for years and have
seriously depleted their forest stocks, despite numerous centrally sponsored attempts at reforestation. Moreover, parts of reforestation programs held by State-owned units are driven by environmental or wasteland recovery considerations. Ideally, we should thus separate State afforestation and afforestation undertaken by households or communities, but limited data availability precludes from disentangling State afforestation from collective or individual afforestation. Therefore, we keep total afforestation as our variable of interest, even though we acknowledge that it may not be the most focused variable to evaluate households and communities responses to economic incentives in planting trees2.
The paper is organized as follows. In section 2, we describe the state of forests and afforestation activities in China since the end of the 1970s. This section particularly shows that the recent period has been characterized by an increase in forest cover in China, with, however, strong regional disparities in afforestation efforts. The aim of the subsequent sections is then to highlight the determinants of afforestation. Section 3 develops theoretical hypotheses on the determinants of land-use choice between competing rural activities. Section 4 presents econometric testing of these hypotheses, using provincial macro-data from 1984 onwards. Section 5 summarizes the findings and discusses some policy implications.
1 We are grateful to an anonymous referee of the review for pointing out the distinction between State forests and non-State
forests in the underlying motivations for afforestation or reforestation.
2 Hyde et al. (2003) indicate that over the reform period, forest land areas have grown more rapidly in collective forests than in
State-owned forests. This implies that even though we cannot separate State forests and non-State forests in afforestation efforts, we can expect that our results reflect at least part of the “true” behavior of households and communities, and that they would be even better if our measure for afforestation excluded State afforestation.
2. China’s forests evolution and planting activities since the end of the 1970s
a. Forest resources: trends and regional distribution
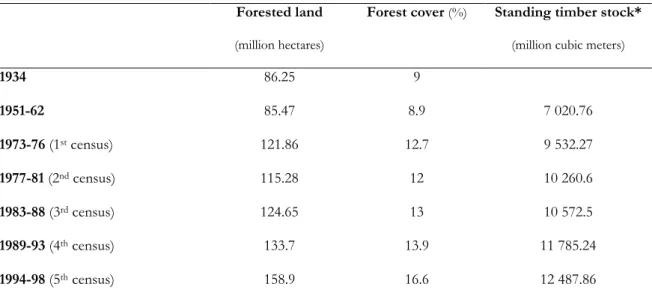
Forest resources in China have been growing steadily in both coverage and stock during the last 25 years. According to national forest resource censuses data, forest cover has increased from 113.3 million hectares in 1981 to 156.8 million hectares in 1998, which represents an increase in forested land of 43.5 million hectares over the period. The standing timber stock has simultaneously increased by 2 billions cubic meters (Table 1).
<Insert Table 1>
As we will discuss later, this increase in forest resources is undoubtedly the result of active policies, including afforestation efforts. As a result, China now has the largest plantation area in the world (46.7 million hectares), which accounts for 31% of its total forest area (Shi and Xu, 2000; Lu et al., 2002). However, this increase should also be related to the continuous changes in definition for forest areas all over the period. As underlined by Richardson (1990, p. 89), “on 28 April 1986, the State Council promulgated regulations for the implementation of the Consolidated Forest Law. Grassland and woodland with 30 percent canopy cover were in future to be defined as forest resources (formerly 40 percent canopy cover was so defined); this measure, by a stroke, increased the forest land area from 273 to 287 million hectares”. The definition for forest area has been further widened since then. In 1994, the former Ministry of Forestry promulgated a document on the “principal technical norms for forest resources census”, which redefined the extent of canopy cover needed to record land in forest resources as 20 percent. This change has been later ratified in propositions for the implementation of the Forest Law in January 2000 (State Forestry Administration, 2000b). This change in definition might at least partly explain the huge increase in forest cover between the 4th and the 5th census
In a regional perspective, four forest regions can be identified (Yin, 1994). They are: the Northeast National Forest Region (Heilongjiang, Jilin and Inner Mongolia), the Southwest National Forest Region (Yunnan, Sichuan and Tibet), the Southern Collective Forest Region and the North/Northeast/Northwest (or Three-North) Farm Forest Region. The two first categories (Northeast and Southwest) cover most of State-owned forests, where natural forests are mainly located and which serve as major traditional timber production bases. The Southern Collective Forest Region, composed of 10 provinces (see Table 2), mainly entails man-made forests, which have been developed quite recently. Lastly, the Three-North Farm Forest Region is made of the rest of the country (14 provinces), where forest resources are scarce. As indicated in Table 2, forest resources are highly concentrated in the first three regions, which account for 84 percent of forest cover in China while only 58 percent of total land area. Ninety percent of timber standing stock is located in these regions, where most forestry activities are conducted.
<Insert Table 2>
Despite rising trends in coverage and stock, China’s forestry however faces important constraints related to the level of resources on one side, and to the quality of existing forests on the other side. Indeed, overall forest resources remain scarce as compared to the world average. They represent only 16.4% of China’s total land area, half of the world average, and 0.13 hectare per capita, considerably less than the world average of 0.65 hectare per capita (FAO, 2003). Timber stock comparisons lead to the same gap as compared to the world average, since the standing stock volume amounts to 9.7 cubic meters per capita while the world average is around 66 cubic meters per capita (Yin, 1998; State Forestry Administration, 2000b).
Moreover, both the level of reserves for timber forests and the forest age structure have steadily deteriorated over time, leading to a lowering quality (Yin, 1998; Shi and Xu, 2000; Rozelle et al., 2004). While the level of forest stocks was around 80 cubic meters per hectare in 1980 (Yin, 1998), it now amounts to only 72.5 cubic meters per hectare. Although this level has increased for man-made forests taken alone (from 22.5 to 34.5 cubic meters per hectare), it
however remains insufficient to make man-made forests a major timber resource in a near future. In terms of age distribution, according to the fifth census, young forests represent more than two-third of forest land (71%), but only 41% of forest volume, which underlines their low productivity (45 cubic meters per hectare). The proportion of mature or near-mature forests is much more important in forest volume (59%), but many of them are located in non-accessible areas.
These divergent evolutions indicate that the biggest challenge for forestry in China does not relate to forest cover destruction, but it is rather linked to a decreasing diversity and the depletion of natural forests and/or mature forests. This problem has been pointed out recently, in particular after the 1998 Yangtze River flood and the subsequent implementation of the Natural Forest Protection Program, which entails a logging ban on natural forests in 17 provinces along the Yangtze and the Yellow River Basins (Xu et al., 2002). At the same time, a target of reforestation, through natural regeneration or artificial planting, has been set out to shift the source of timber supply from natural forests to planted forests.
b. Afforestation efforts
Apart from statistical changes mentioned above, the observed rising trend in forest resources is above all the consequence of the substantial efforts that China made to plant trees as well as to protect existing resources since economic reforms were launched in the late 1970s. In addition to the symbolic designation of a national day for tree planting (March 12), a variety of national campaigns and market-based incentives have been designed to encourage tree planting since the end of the 1970s. Various large-scale afforestation programs3 include the “National
compulsory tree-planting campaign” launched in 1981, the “Four sides” afforestation campaign, which encourages tree planting around houses and villages, and along roads and rivers, and a
number of regional afforestation campaigns, such as the “Three-North Shelterbelt Development Program” in 1978, the “Coastal Shelterbelt Development Program” in 1991, the “Taihang Mountain Afforestation Program” in 1990, etc.
Other policies designed to stimulate the active participation of a “private” sector in forest activities include the adoption of a national forest policy in 1981, characterized by the so-called “Three fix policy”, aimed at securing resources rights (Lu et al., 2002). As highlighted by Richardson (1990), the three objectives of this policy were “the rapid resolution of forest rights of ownership and usufruct, the demarcation of wasteland for household reforestation and the establishment of contract responsibility systems for collective forestry operations” (p. 187). The Forest Law, issued in 1984 and amended in 1998, reinvigorated the “three fix” policy by allowing private use rights over trees (Lu et al., 2002).
Moreover, the introduction and the generalization of the forestry household responsibility system4 gave more resources such as forestry land to rural households, and favored
tree-plantings (Zhang et al., 2000), although the land tenure insecurity related to this system may have had negative impacts on forestry, as highlighted by Yin and Newman (1997) and Harkness (1998). In particular, Harkness (1998) emphasizes the fact that unsecured property rights led to sub-optimal forest-clearing behaviors, since they both discouraged forestry long-term investments and provided in turn incentives to clear more forests as a way to claim property rights over land.
Simultaneously, the designation of protected areas and, more recently, the implementation of the Natural Forest Protection Program (NFPP, 1998) and the Sloping Land
4 The household responsibility system first implemented in agriculture has been expanded to forested land in the beginning of the
1980s. It basically involved transferring use rights and management responsibilities from the collective to rural households or cooperatives. Although the in fine responsibility remained under the local forestry bureaus, this system aimed at granting households with greater autonomy in forest management.
Conversion Program (SLCP, 1999) aimed at protecting existing resources, as well as encouraging afforestation (Xu et al., 2002; Wang et al., 2004).
China’s transition towards a market-based economy has also been accompanied by a decentralization process that gave more responsibilities to local governments in the case of agriculture and forestry, and to rural households in the management of natural resources. To enforce incentives to plant trees, afforestation responsibility has been decentralized to local leaders in 1984. As local governments have better information about local conditions and preferences, they are indeed expected to make greater efforts to protect and improve their natural resource bases. A few years later, afforestation even became a criterion for performance evaluation of local leaders and in 1990, the allocation of the harvesting quota has been linked to afforestation. All these measures contributed to give local governments more responsibilities in terms of fixed-assets investments, production decisions and resources exploitation (Zhang et al., 1999).
Afforestation efforts in China resulted in the following planting trends. As can be seen from Figure 1, there is an upward trend of planted area over time: plantings averaged 5 million hectares a year during the 1970s, and nearly 6 million hectares a year during the 1980s and 1990s (excluding 1984 and 1985). During this period, 2 years (1984 and 1985) show much higher rate of afforestation, the area of afforestation being higher than 8 million hectares a year. The higher level of afforestation can be partly explained by the fact that during these two years, liberalization reforms accelerated before being suddenly stopped in 1986. Indeed, several policy measures have been adopted to further liberalize timber prices and markets as well as to accelerate property rights changes up to the mid 1980s. In 1984, a larger portion of forestland has been attributed to farmers in the south, and more freedom given concerning the use of forest production after quota fulfillment. The same year, the central government decentralized the afforestation responsibility to local leaders where forest is collectively owned, and in the case of state forest farms, afforestation also became part of contracts established with the State. A complementary
explanation to the unusual afforestation observed in 1984 and 1985 is that these years followed the massive movement of deforestation that occurred when the household responsibility system was extended to forestry lands (see above).
<Insert Figure 1>
Again, it is important to point out potential definition problems, which might lead to an overestimation of positive trends in forest resources in China. As afforestation only measures the area of trees planted rather than effectively established areas (Richardson, 1990), questions on survival rates and quality issues are not taken into account in this kind of data.
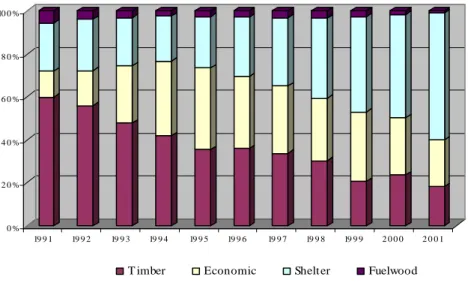
Since the 1984 Forest Law, forests are classified according to their use into the following 5 categories: timber forests, shelter forests, economic forests, fuel forests and forests for special use (See Appendix 1 for a definition of these categories). According to the fifth census, they represent respectively 65%, 14%, 16%, 3% and 3% of total forested land in China. Figure 2 shows the evolution of the distribution of afforestation according to the type of forest planted during the 1990s. At the beginning of the 1990s, most of the plantings have been done in timber forests, which represented 60 percent of total plantings. Shelter forests came second, with a share of 22 percent of total afforestation and economic forests ranked third with a share of 12 percent. However, this uneven distribution has changed during the 1990s, when both shelter forests and economic forests recorded a huge increase in their share of total planting. This evolution can be linked with the growing concern about the necessity to protect environment and forests resources (especially with the implementation of the Natural Forest Protection Program in 1998 and the Sloping Land Conversion Program in 1999), as well as the development of non-timber forestry activities in South China.
<Insert Figure 2>
Looking at the regional distribution also reveals substantial differences in afforestation efforts (Table 2). On the one hand, southern provinces planted on average a higher area of trees as a share of their total land area throughout the 1981-2001 period. As suggested by the
distribution by forest type, these provinces mainly focused on timber forests and economic forests, the share of shelter forests being much lower than the national average. These provinces have several common characteristics, among which predominantly collective property rights, rapid economic changes, a relatively efficient agricultural sector and a higher income level. On the other hand, major timber production bases of State forest regions from the North and mixed-managed forest regions from the South-West show a substantially lower ratio of afforestation to total land area. This regional pattern of afforestation efforts supports the usually highlighted trend of a decreasing natural forest and a growing forest cover in regions that were not traditionally timber bases.
This rapid review of the current state of forests and afforestation in China highlights some of the challenges that forestry in China now faces, and which constitute the background for this paper. It particularly shows that although the forested land area increased on average by 2.5% a year between the third (1983-88) and the fifth (1994-98) census (Table 1), China can still be regarded as forest deficient by international standards. In the context of a growing demand for wood in China, it is hence important to analyze the determinants of afforestation to target policies towards an efficient management of China’s forestry, in order to reduce pressure upon international forest resources.
3. Framework of forest land-use choice
A range of papers have recently studied the determinants of forest cover variation in China, using data based either on forest inventories or on small-scale surveys conducted by the authors (see Yin and Newman, 1997; Rozelle et al., 2000, 2004; Zhang et al., 2000; Xu et al., 2004). They highlight the important role of economic and institutional factors such as relative prices and changes in land tenure in the evolution of forest resources. Our objective here is slightly different since we aim at determining the factors which can explain tree plantings efforts.
Apart from the State, which owns approximately one third of forests, two categories of actors can be involved in tree planting activities in China. They are on one side, local communities (including local governments) and on the other side, individuals. According to Lu et al. (2002), “by 1985 households were estimated to be responsible for over 50 per cent of the increase in forest area” (p. 23), and, “by 1995, an estimated 95 per cent of all collective households were involved in some form of contract tenure arrangements in forest land” (p. 1). This is probably the result of economic deregulation and the introduction of the household forestry responsibility system from the beginning of the 1980s onwards. Meanwhile, along with the advancement of reforms and market institutional development, forestry producers, rural households, and local communities have been more and more sensitive to economic factors. In this context, although a portion of China’s afforestation has been driven by environmental considerations, such as shelter forests planted by the State, economic factors can be expected to have an increasing role in afforestation activities during the reform period.
As a mountainous country where mountains and plateaus account for more than two-third of total land area (Wang and Hu, 1999), China is characterized by relatively scarce land resources. Its topographical characteristics imply unfavorable natural conditions to economic development and a strong concentration of the huge population on a reduced space: in 2002, 94% of the Chinese population was living on 46% of total land. They also make China a weakly-endowed country in terms of arable land, which covers only 10% of the territory.
Facing the land constraint, decision makers have to make a careful land-use choice between alternative productive activities, including both agricultural and non-agricultural (pasture, forestry, etc.) activities. Zhang et al. (2000) have illustrated for Hainan province the land allocation decision among natural forests, degraded land, tree plantation, tropical crops, cultivation land and other. In a broader nationwide perspective, we will assume here that forestry competes for land mainly with agriculture in order to simplify the analysis. Therefore, the question raised is about the determinants of this land allocation decision between agriculture and
forestry. Undoubtedly, this is a strong assumption insofar as China has some barren land more suitable for forestry than for agriculture. However, under a high demographic pressure on scarce land, wasteland is likely to be used for agriculture production, as what occurred in the 1960s with the nationwide generalization of the “Dazhai Model”.5 Therefore, agriculture can be considered
as a competing or potentially competing activity to forestry.6
The land allocation decision between agriculture and forestry can be analyzed within a simple theoretical framework of activity choice, as illustrated by Zhang (2000) and Zhang et al. (2000). Economic agents, such as rural households or local communities, allocate their land between tree planting and agriculture so as to get the highest rent from the use of their land. In this respect, the criteria that determine why a landowner chooses a particular use for land are related to a classical profit-seeking behavior in which decision is made according to the relative profitability of competing activities (prices), risk considerations, land quality, and the socio-economic and institutional environment.
α being the proportion of land an agent chooses to allocate to afforestation, the agro-forestry land-use choice can be analyzed in a reduced-form equation as follows:
) , , , (p R q E α α = (1)
where p stands for output prices, R for both market risks and production risks, q represents land quality, and E the socio-economic and institutional environment.
As far as profitability is concerned, land allocation is determined by the relative return of competing activities (Zhang et al., 2000). During the reform period, market institutional developments have gradually made Chinese producers more profit-oriented and more responsive
5 It consisted in converting sloping hills into terrace land to increase grain production.
6 This assumption can be regarded as rather “consistent” with the observed pattern in China. To give a recent example, the
Sloping Land Conversion Program (SLCP) launched in the late 1990s called for the conversion of agriculture on sloping lands into forests or grasslands (Xu et al., 2002). Furthermore, our field observation in a rural county of Beijing municipality gives some support to this assumption, since a large portion of fruit trees planted by rural households are growing on arable land.
to market signals as price changes. Since 1978, State procurement prices of timber and other forest products have been increased several times.7 Meanwhile, timber markets have developed
rapidly, especially in the 1990s. A national timber market has been created in Beijing, and by 1994, a great number of regional timber markets were established in the whole country.8 With
the development of market mechanisms, land allocation between agriculture and afforestation can then be expected to be more sensitive to relative prices changes, an increase in forestry product prices relative to agricultural product prices leading to an increase in the ratio of land allocated to forest, other things being equal.
The second criterion is to cope with risks which are abundant in rural areas. There are essentially two sources of risks. One is related to agricultural production risks, such as timing and quantity variability of rainfall. The other is related to market risks, since the transition period is characterized by market imperfections, and volatile and unpredictable relative prices. Due to the lack of credit or insurance markets in rural areas, a diversification strategy from agriculture to forestry can be an efficient ex ante risk management mechanism for rural risk-averse households. As predicted by portfolio choice models, a risk increment in agriculture should lead to a higher share of land allocated to forests. The existing literature on forest resources variations in China also points out the importance of institutional risks, the most important being unsecured land tenure (Yin and Newman, 1997; Zhang et al., 2000; Rozelle et al., 2004). Dummy variables for the household responsibility system are thus usually introduced in empirical analyses. However, we cannot consider this change here since our data start in 1984, when the household responsibility system was already largely developed throughout the whole country.
As regards land quality, several papers have shown that land quality can help increasing forest area (Rozelle et al., 2004; Xu et al., 2004). Moreover, the question of the relative scarcity of
7 In 1979, the timber procurement prices rose by 30.6% and in 1990, they increased further by 48% in the northern State forestry
regions.
land is crucial in China where land is a basic production factor for feeding a large population, which can create conflicts in land-use choices. On the one hand, if demographic pressure is particularly strong, preference might be given to agricultural activities rather than afforestation. On the other hand, improvements in agricultural productivity might help reducing the pressure upon land and thus favor longer term activities such as forestry.
Lastly, the decentralization process that occurred during the reform period has been accompanied by several changes in rural areas, the most striking being the development of rural industry through township and villages enterprises (TVEs) (Chen, 2000). The emergence of these dynamic rural collective enterprises favored the diversification of rural activities (e.g. the development of off-farm activities), as well as the improvement of rural revenues and living standards (Yang, 2003). Higher incomes and saving capacity in rural areas can be expected to increase the incentives for longer term investments such as forestry investments, since less pressure is put on day-to-day food-related needs. In addition, higher incomes can also facilitate the entry into forestry activity, which requires substantial long-term investment. However, as wealth is also an important ex-post insurance tool against risk, a substitution effect can partly compensate the positive income effect. Indeed, higher incomes and saving capacity can encourage rural households to direct their savings towards other investments (such as real estate, insurance, etc.) and then, allow them to increase their agricultural activity without fearing risks. As far as the diversification of activities in rural area is concerned, both an income effect and a substitution effect are also at stake, which makes the overall impact on afforestation effort undetermined. Indeed, on the one hand, less important needs for agricultural activities reduce pressures on forest land and might thus favor the extension of the forest cover rate. On the other hand, the diversification of income sources provides insurance alternatives and reduces the incidence of agricultural risks. Therefore, the emergence of new activities might also encourage rural households to focus on other sources of investment than forestry.
4. Empirical evidence on the determinants of afforestation in China
a. The data
The econometric study relies on data gathered on an annual basis for as many provinces as possible using various Chinese sources described in Appendix 2. The database used in the following econometric analysis thus covers 25 Chinese provinces and autonomous regions over the period from 1984 to 2001. Due to numerous missing values, Beijing,9 Tianjin and Shanghai
municipalities directly under the Central Government as well as Tibet autonomous region and Hainan province are excluded from the quantitative analysis. Moreover, as Chongqing area was given a municipality status only from 1997 onwards, available data before 1997 do not allow distinguishing between Sichuan province and Chongqing municipality, which are thus gathered.
A description of all variables introduced in the empirical analysis is provided in Appendix 2. More specifically, to measure households’ wealth, we use information on their productive assets and we compute a wealth composite index, as a linear combination of household assets indicators through principal components analysis. We selected three indicators reflecting several productive fixed assets owned by rural households: large and medium tractors, mini and walking tractors and carts with rubber tires. Results of the principal components analysis are given in Appendix 3. They give the eigenvector estimates, as well as summary statistics for each variable. We only use the first principal component (with an eigenvalue of 1.87), which accounts for 62 per cent of the variance in our indicators.
Weather variability is measured with an annual precipitation variation index, using monthly precipitations for the capital of each province, and following the methodology proposed by Gurgand (2003). The method consists in computing the annual deviation of
9 Beijing municipality does not produce much timber but undertook important efforts to improve its level of afforestation, as
precipitations in comparison with a “norm” defined for every month as being the average precipitation over the period. Therefore, the index can be defined as:
∑ − = = 12 1 2 ) ( 12 1 j itj ij it m m p (2)
where i, t and j denote respectively a given province, a given year and a given month, mitj
measures monthly precipitation in province i, during year t and mij measures the average
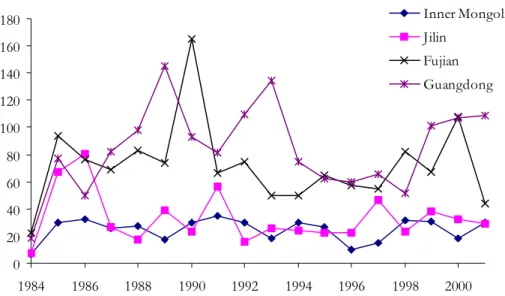
monthly precipitation in province i, over the whole period. Figure 3 shows the evolution of this index for several provinces in South China (Guangdong and Fujian) and in North-eastern China (Inner Mongolia and Jilin). It underlines the variability of precipitations, particularly in South China where climatic fluctuations are quite important. The relatively high frequency of floods in this region where agricultural activities are intensive probably entails a higher risk for them.
<Insert Figure 3>
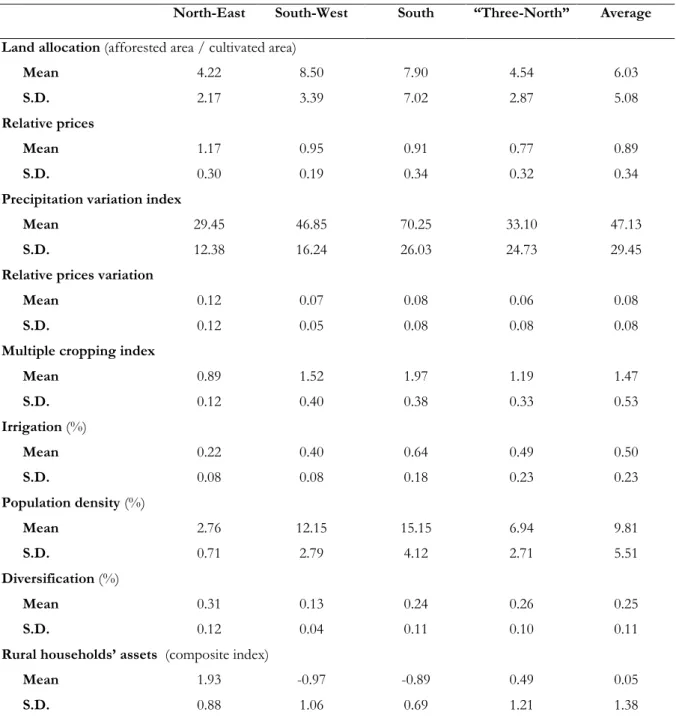
Table 3 illustrates some of the existing disparities among regions for variables included in subsequent regressions. It shows that Southern provinces (South and South-west) are those where the highest proportion of land is allocated to tree planting, with an average of 8 hectares of afforested land for 100 hectares of cultivated land, namely twice the ratio for Northern provinces (mean tests confirm that the difference is statistically significant). These statistics confirm the stronger incentives for afforestation in provinces that were not traditionally well-endowed in forest resources, and that made greater effort to develop a diversified forestry activity (from timber to non-timber products) during the reform period. Southern provinces are also characterized by an intensive agricultural activity, with on average two harvests a year and a more developed irrigation system than in other provinces. But they also face strong constraints in terms of population density and they depend on higher weather variations (both variables for the South region are one standard deviation more than the mean value).
<Insert Table 3>
it it it it it it X X X X u Y = + + + + 4 4+ 3 3 2 2 1 1 γ γ γ γ α (3)
where Y is the annual land-use choice, measured as the ratio of afforested land over cultivated land. X1 is the relative return of agricultural to forestry activities (measured through relative
prices), X2 a set of variables representing risks (precipitation variations and relative price
variability), X3 a set of variables representing land quality/scarcity (multiple cropping index,
irrigation and agricultural population density), and X4 a set of variables representing changes in
the socio-economic environment (wealth and diversification of income sources).
The data set being a panel of provinces over years, the error term can be expressed as follows:
it i it
u =
α
+ε
(4)where
α
i is a province-specific parameter, introduced to take account of unmeasured features specific to the provinces concerned (reforms, property rights or location differences). As shown in Table 4, the Breush and Pagan LM test for specific effects indicates that a specific-effect model is to be preferred to a pooled specification, and the Hausman test indicates that the fixed-effect specification is to be preferred to a random-fixed-effect one. In the estimated specifications, all explanatory variables are lagged by one year to account for the fact that land-use decision is made given the information set available at the end of the preceding year. This allows reducing endogeneity problems, but at the cost of one year observation loss. Hence, our data set effectively starts from 1986 instead of 1985 to 2001, a period of 16 years.10Last but not least, it is important to come back to the data quality issue briefly raised in Section 2. On the one hand, it is important to note that the use of afforestation data does not allow taking account of survival rates. This means that our analysis only focuses on the efforts made by rural economic agents to plant trees and does not take account of harvesting or planted
10 To control for the potential bias induced by the exceptionally high rates of afforestation observed in 1985, we have chosen to
trees that do not survive. However, using afforestation data (as opposed to forest cover data) allows reducing problems linked with forest coverage definition changes, as highlighted in Section 2.
b. Econometric results
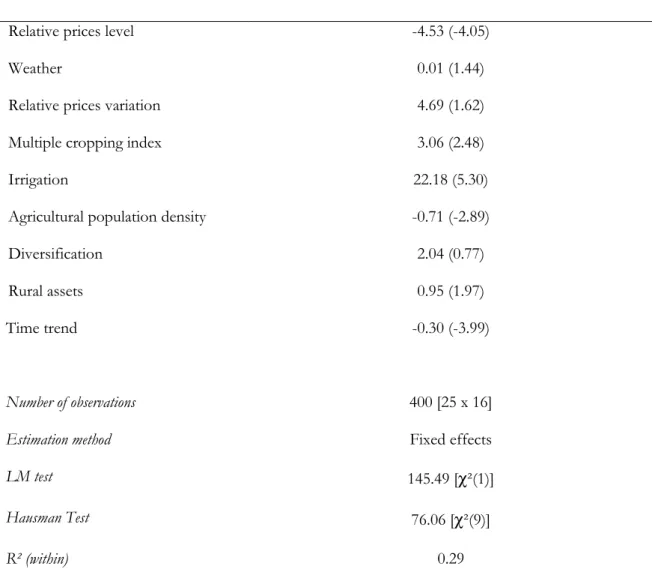
Estimation results of this “land-use choice” equation are reported in Table 4. They provide an evaluation of the relative importance of economic motivations in the afforestation decision. The model explains one third of variations in land-use choice, and most variables are significant at the usual threshold level of 5 per cent with the expected sign.
First, estimation results show a negative relationship between the agriculture-to-forestry relative price level and afforestation efforts, which illustrates the determination of land-use choice according to the expected relative return of competing activities in a more market-based economy. Hence, the estimated coefficient associated to the relative price level supports the assertion that higher agricultural relative prices encourage farmers to keep land for agricultural purposes, and reduce the incentives to plant trees, other things being equal.
<Insert Table 4>
Concerning the impact of risk, both agricultural production risks (precipitation variation) and market risks (the relative price volatility) tend to encourage afforestation, all things being equal. The estimation of the land-use choice equation indeed shows positive and significant coefficients associated with both the precipitation variation index (although weakly significant) and the relative price variation. These results indicate that besides the immediate relative profitability of agriculture, the existence of risks encourages rural households to adopt a diversification strategy in the use of land, by allocating part of it to tree plantings. And indeed, following the different plantation campaigns in the 1980s and the allocation of private plots to households, rural households have been encouraged to plant trees (especially for non-timber products purposes) and to diversify their productive activities.
As for land quality and scarcity, the estimation results give an evaluation of the importance of demographic pressure over land as a determinant for land-use choice between agriculture and forestry. On the one hand, the agricultural population density has a negative impact on afforestation effort. On the other hand, the quality of land, measured through both irrigation and the multiple cropping index, which participates to the increase in the total factor productivity in agriculture, tends to reduce pressure upon land and contributes positively to afforestation efforts. Therefore, the negative impact of demographic pressure might thus be offset by the positive impact of technological progress.
As regards the effect of households’ wealth on their incentive to plant trees, the introduction of the households’ assets composite index calculated through principal components analysis shows a positive effect on afforestation. This result implies that wealthier households (in terms of productive assets) tend to allocate relatively more land to tree planting, all things being equal. On the opposite, the non-significant coefficient associated with diversification suggests that, neither the income effect, nor the substitution effect dominates in afforestation decision. Hence, the existence of alternative activities such as rural industry, might reduce pressure over land and favor afforestation, but it seems that in China, this effect is at least partly offset by the fact that diversification in economic activities in rural areas has played as a substitute to forestry as insurance against risk.11 One explanation for this particular evolution certainly lies in the fact
that, although efforts have been done towards securing property rights of farmers on trees (see Section 2), evidence shows that tenure insecurity remains a major problem in rural China (Xu et al., 2002). In this context, investing in long-term forest-related activities may still prove not to be as “secured” and efficient as other non-agricultural activities to diversify income sources and insure against agricultural risks.
11 Note that some positive indirect (and unmeasured) effects certainly also come from diversification, including the increase in rural income and the absorption of agricultural surplus labor force, which reduces the pressure upon arable land.
5. Conclusion
The purpose of this paper is to highlight the determinants of afforestation efforts in China, using available macro-economic information at a province level over the period from 1984 to 2001. By focusing on economic factors that drive afforestation, we mainly refer here to afforestation done by households and collectives, rather than by the State, even though available data preclude from clearly separating these categories in our analysis. Using panel data for a sample of 25 provinces throughout the period, the quantitative analysis suggests that land allocation between agriculture and afforestation is driven by economic factors including profitability, production and market risks pressure upon land and household wealth.
Our findings have several policy implications, which might be worthwhile to underline in the current context of a growing interest for environment and natural resources protection in China. They particularly suggest that economic reforms that have been implemented since the end of the 1970s have had important, although contrasting, effects in terms of land allocation towards forest. It can be clearly seen that accounting for the relative profitability and risk of activities has become a significant element in activity choices, on which economic policies oriented towards the market might have an impact. Hence, as timber prices have been kept for a long time at very low level by administrative measures, timber markets should be further developed so that prices reflect the real value of timber and the actual supply-demand structure of the country.
As for the socio-economic environment, the evidence is mixed. On the one hand, both increased incomes in rural China and the higher agricultural productivity have led to an increase in incentives to start forestry activities. By stressing the importance of land quality and agricultural productivity in a country where arable land is a scarce resource, our results entail that in order to foster afforestation, emphasis should be put on a better maintenance of the irrigation system as well as on the improvement of agricultural productivity through technological progress
and mechanization. They also suggest that in regions where agricultural productivity is low, accompanying measures are needed to help farmers in diversifying their activities. The current Sloping Land Conversion Program (SLCP) supports this idea since both cash and grain subsidies are provided to peasants for each converted hectare over a period of 5 to 8 years12.
Lastly, our results show that the increase in the sources of income in rural areas had no strong impact on afforestation incentives: on average the substitution effect has been as large as the income effect. This result implies that along with the diversification of income sources in rural China, it might be important to target policies toward increasing incentives for farmers to keep on planting trees even though forest-related activities are getting less important. In this regard, the empirical evidence (Xu et al. 2002, Hyde et al. 2003) points out that highly unsecured property rights on trees discourage farmers to invest in this activity. Therefore, giving greater incentives for an efficient and sustainable forest management as well as relieving the pressure on forest certainly require to enforce stable property rights. This might be all the more important since in most rural areas in China, poverty is still persisting, and insurance and credit markets are absent or imperfect (Jalan and Ravallion, 2001). While facing substantial risks, rural households have limited access to mechanisms likely to reduce risks associated with production, but also to health, etc. In this perspective, allocating land to forest can be viewed as a risk-reducing mechanism at the household level.
References
Chen, H. (2000), The Institutional Transition of China’s Township and Village Enterprises: Market Liberalization, Contractual Form Innovation and Privatization, Aldershot: Ashgate.
Food and Agriculture Organization (2003), The State of the World’s Forests 2003, Rome: FAO.
12 The cash subsidy is 300 Yuan/ha per year. To account for differences in regional average yields, the annual grain subsidy varies between the Yangtze River Basin (2250 kg/ha) and the Yellow River Basin (1500 kg/ha). The subsidies timeline depends on the type of tree planted (ecological forests or economic forests).
Gurgand, M. (2003), ‘Farmer education and the weather: Evidence from Taiwan (1976-1992)’, Journal of Development Economics 71(1): 51-70.
Harkness, J. (1998), ‘Recent Trends in Forestry and Conservation of Biodiversity in China’, China Quarterly 156: 911-934.
Hyde W. F., B. Belcher and J. Xu (2003), China’s Forests: Global Lessons from Market Reforms, Washington D.C.: Resources for the Future Press.
Jalan, J. and M. Ravallion (2001), ‘Behavioral Responses to Risk in Rural China’, Journal of Development Economics 66(1): 23-49.
Lu, W., N. Landell-Mills, J. Liu, J. Xu and C. Liu (2002), Getting the private sector to work for the public good: Instruments for sustainable private sector forestry in China, London: International Institute for Environment and Development (IIED), Instruments for sustainable private sector forestry series.
National Bureau of Statistics (1985-2002), China Statistical Yearbook, Beijing: China Statistics Press.
Richardson, S. D. (1990), Forests and Forestry in China, Washington DC: Island Press.
Rozelle, S. D., V. Benziger and J. Huang (2004), ‘Forest Exploitation and Protection in Reform China: Assessing the Impacts of Policy and Economic Growth’, in W. F. Hyde, B. Belcher and J. Xu, (eds.), China’s Forests: Global Lessons from Market Reforms, Washington D.C.: Resources for the Future, pp. 109-133.
Rozelle, S. D., J. Huang, A. Husain and A. Zazueta (2000), China: From Afforestation to Poverty Alleviation and Natural Forest Management, Washington DC: the World Bank.
Shi, P. and J. Xu (2000), ‘Deforestation in China’, Mimeographed, Center for Chinese Agricultural Policy (CCAP), Beijing.
Smil, V. (1997), ‘China’s Environment and Natural Resources’, in C. Hudson, (ed.), The China Handbook, Chicago and London: Fitzroy Dearborn Publishers, pp. 188-197.
State Forestry Administration (1985a-2001a), China Forestry Statistical Yearbook, Beijing: China Forestry Publishing House.
State Forestry Administration (2000b), Forest Resources Statistics of China, 1994-1998, Beijing: State Forestry Administration.
Wang, S. and A. Hu (1999), The Political Economy of Uneven Development, The Case of China, Armonk, New York: M. E. Sharpe.
Wang, S., G. C. van Kooten and B. Wilson (2004), ‘Mosaic of reform: forest policy in post-1978 China’, Forest Policy and Economics 6(1): 71-83.
Xu, J., E. Katsigris and T. A. White (2002), Implementing the Natural Forest Protection Program and the Sloping Land Conversion Program: Lessons and Policy Recommendations, China Council for International Cooperation on Environment and Development (CCICED) Task Force on Forests and Grasslands, Beijing: China Forestry Publishing Housing.
Xu, J., R. Tao and G. S. Amacher (2004), ‘An empirical analysis of China's state-owned forests ’, Forest Policy and Economics 6(3-4): 379-390.
Yang, W. (2003), ‘Reforms, agricultural risks and agro-industrial diversification in rural China: Evidence from Chinese Provinces’, Etudes et Documents 2003-18, CERDI, Clermont-Ferrand. http://www.cerdi.org/Publi/ED_Detail.asp?Id=442.
Yin, R. (1994), ‘China’s Rural Forestry since 1949’, Journal of World Forest Resource Management 7: 73-100.
Yin, R. (1998), ‘Forestry and the Environment in China: the Current Situation and Strategic Choices’, World development 26(12): 2153-2167.
Yin, R. and D. H. Newman (1997), ‘Impacts of rural reforms: the case of the Chinese forest sector’, Environment and Development Economics 2: 291-305.
Zhang, Y. (2000), ‘Deforestation and Forest Transition: Theory and Evidence in China’, in M. Palo and H. Vanhanen, (eds.), World Forests from Deforestation to Forest Transition?, Dordrecht: Kluwer Academic Publishers, pp. 41-65.
Zhang, Y., G. Dai, H. Huang, F. Kong, Z. Tian, X. Wang and L. Zhang (1999), ‘The Forest Sector in China: Towards a Market Economy’, in M. Palo and J. Uusivuori, (eds.), World Forests, Society and Environment, Dordrecht: Kluwer Academic Publishers, pp 371-393. Zhang, Y., J. Uusivuori and J. Kuuluvainen (2000), ‘Econometric analysis of the causes of forest
Table 1 – Trends in forest resources in China
Forested land
(million hectares)
Forest cover (%) Standing timber stock*
(million cubic meters)
1934 86.25 9 1951-62 85.47 8.9 7 020.76 1973-76 (1st census) 121.86 12.7 9 532.27 1977-81 (2nd census) 115.28 12 10 260.6 1983-88 (3rd census) 124.65 13 10 572.5 1989-93 (4th census) 133.7 13.9 11 785.24 1994-98 (5th census) 158.9 16.6 12 487.86
Notes: The referred periods indicate the period during which censuses have been conducted. Taiwan is included (Taiwan forested area between 1977 and 1998 remained stable around 2 million hectares).
* Total timber stock volume of forest land (including open forest, bush, etc.)
Table 2 – Regional distribution of forest resources and afforestation effort
North-East
South-West South
“Three-North”
Dominant land tenure system State Both Collective
Total land area (1 000 km²) 1 802 2 177* 1 552 4 036
Population density (persons/km²), 1998 49 73** 301 128
Share of China’s forested area (%)1, 1998 26 20 38 16
Forest area variation
(million hectares, both open and closed forests)1, 2
- 1980-88 (3rd census) - 1989-93 (4th census) - 1994-98 (5th census) -0.28 +0.89 +2.85 +0.81 +0.74 +2.15 +1.3 +5.56 +12.36 +4.54
Share of timber inventory (%)1, 1998 32 37 18 13
Share of total timber production, in cubic meters (%, 2001)3
32.5 4 51 12.5
Share of state forest farms production, in RMB (%, 2001)3
49 5 34 12
Average afforestation (km²/1 000 km²), 1981-2001 6.1 5.4 11.7 9.8
Afforestation by forest type (%), 1991-2001***
Timber 35.4 37.3 59.2 23.3
Shelter 49.3 33.0 11.6 39.0
Fuelwood 2.2 2.5 3.3 3.4
Economic (non-timber) 12.4 26.9 25.6 34.0
Notes: forest regions include the following provinces: - North-East: Heilongjiang, Jilin and Inner Mongolia;
- South-West: Sichuan (Chongqing included), Yunnan and Tibet;
- South: Anhui, Zhejiang, Fujian, Jiangxi, Hunan, Hubei, Guangdong, Guangxi, Hainan, and Guizhou;
- Three-North: Liaoning, Hebei, Beijing, Tianjin, Shandong, Jiangsu, Shanghai, Shanxi, Henan, Shaanxi, Ningxia, Gansu, Qinghai, and Xinjiang.
* Among which 1 228 for Tibet province. ** Population density without Tibet is 165. *** The total is less than 100 % since “forests for special use” are not included.
Sources: 1) National forest resource censuses, 1989-93 and 1994-98, 2) Yin (1998), 3) State Forestry Administration (1985a-2001a) and National Bureau of Statistics (1985-2002).
Table 3 – Descriptive statistics (1986-2001)
North-East South-West South “Three-North” Average
Land allocation (afforested area / cultivated area)
Mean 4.22 8.50 7.90 4.54 6.03
S.D. 2.17 3.39 7.02 2.87 5.08
Relative prices
Mean 1.17 0.95 0.91 0.77 0.89
S.D. 0.30 0.19 0.34 0.32 0.34
Precipitation variation index
Mean 29.45 46.85 70.25 33.10 47.13
S.D. 12.38 16.24 26.03 24.73 29.45
Relative prices variation
Mean 0.12 0.07 0.08 0.06 0.08
S.D. 0.12 0.05 0.08 0.08 0.08
Multiple cropping index
Mean 0.89 1.52 1.97 1.19 1.47 S.D. 0.12 0.40 0.38 0.33 0.53 Irrigation (%) Mean 0.22 0.40 0.64 0.49 0.50 S.D. 0.08 0.08 0.18 0.23 0.23 Population density (%) Mean 2.76 12.15 15.15 6.94 9.81 S.D. 0.71 2.79 4.12 2.71 5.51 Diversification (%) Mean 0.31 0.13 0.24 0.26 0.25 S.D. 0.12 0.04 0.11 0.10 0.11
Rural households’ assets (composite index)
Mean 1.93 -0.97 -0.89 0.49 0.05
S.D. 0.88 1.06 0.69 1.21 1.38
Notes: “Land allocation” is measured as a ratio of afforested land during a given year over cultivated land (x 100); relative prices are measured by the ratio of agriculture to forestry implicit deflators of production; the precipitation variation index is defined in the text; relative price variation is measured in absolute terms; the multiple cropping index is calculated by dividing sown area by cultivated area; irrigation is measured as a ratio of irrigated land over cultivated land; population density is measured by the ratio of agricultural population over cultivated land; diversification is measured by the ratio of employment in TVEs over rural employment and rural households’ assets are computed from principal component analysis, as explained in the text.
Table 4 – Determinants of afforestation effort (1986-2001)
Dependent variable: Afforested land over cultivated land, per province, per year Land allocation
Relative prices level -4.53 (-4.05)
Weather 0.01 (1.44)
Relative prices variation 4.69 (1.62)
Multiple cropping index 3.06 (2.48)
Irrigation 22.18 (5.30)
Agricultural population density -0.71 (-2.89)
Diversification 2.04 (0.77)
Rural assets 0.95 (1.97)
Time trend -0.30 (-3.99)
Number of observations 400 [25 x 16]
Estimation method Fixed effects
LM test 145.49 [χ²(1)]
Hausman Test 76.06 [χ²(9)]
R² (within) 0.29
Notes: Due to missing observations, Beijing, Tianjin, Shanghai, Hainan and Tibet are not included in the data set. All explanatory variables are lagged one year. The values shown between brackets are the Student t values. The estimated standard deviations have been corrected using a White matrix.
Figure 1 – Annual total afforestation in China (1952-2001)
Sources: State Forestry Administration (1985a-2001a).
Figure 2 – Distribution of forestry plantings according to the forest type (1991-2001)
0 % 2 0 % 4 0 % 6 0 % 8 0 % 10 0 % 19 9 1 19 9 2 19 9 3 19 9 4 19 9 5 19 9 6 19 9 7 19 9 8 19 9 9 2 0 0 0 2 0 0 1
T imber Economic Shelt er Fuelwood
Notes: computed from provincial data. The fifth forest category (forests for special use) is not included in the figure since its share is always less than 1 % of total afforestation.
Sources: State Forestry Administration (1985a-2001a). 0 2 4 6 8 10 1952 1956 1960 1964 1968 1972 1976 1980 1984 1988 1992 1996 2000 M il li o n H e c ta r e s p la n te d
Figure 3 – Precipitation variation index for some Northern and Southern selected provinces
Sources: National Bureau of Statistics (1985-2002).
0 20 40 60 80 100 120 140 160 180 1984 1986 1988 1990 1992 1994 1996 1998 2000 Inner Mongolia Jilin Fujian Guangdong
Appendix 1 – Forest categories definition according to the Forest Law
(Adopted on 20 September 1984)
Article 4. The forest falls into the following five categories:
(1) Shelter forest: the forest, forest trees, and groves that are mainly used as shelter. They consist of forest for protecting headwaters of rivers, forest for conserving water and soil, windbreak and sand-fixation forest, farm and pastureland shelter forest, embankment protective belts, and road protection belts.
(2) Timber forest: it comprises timber-producing forest and forest trees as well as bamboo forest producing bamboo products.
(3) Economic forest: the forest trees that mainly produce fruits, edible oil, ingredients of drinks, condiments, industrial materials, medicinal herbs, etc.
(4) Fuel forest: the forest trees that are mainly used as fuel.
(5) Forest for special uses: the forest and forest trees that are mainly for defense, environmental protection, and scientific experiment purposes. They include forest for defense, forest for experiment, maternal forest, forest for environmental protection, scenic forest, as well as the forest trees in scenic and historical spots and places with historic significance in the Chinese revolution, and the forest in natural preservation zones.
Appendix 2 – Data sources and definitions
The database has been constructed from a number of different official Chinese sources, including the China Forestry Statistical Yearbook, the China Statistical Yearbook, the Township and Village Enterprises Yearbook of China, the Rural Statistical Yearbook of China, China Regional Economy: A Profile of 17 years of Reform and Opening-up and Comprehensive Statistical Data and Materials on 50 years of New China.
The list of indicators used in the empirical analysis is the following: - Land allocation: ratio of afforested area in a giving year over cultivated land.
- Relative prices: relative return indicator (capturing the changes in relative prices in real terms), measured by the ratio of the implicit deflator of agricultural production to that of forestry. Implicit deflators are calculated from the gross output value of farming (forestry) in current prices and indices of gross output value of farming (forestry) given in the China Statistical Yearbook. The relative prices variation is measured as the annual variation of the relative prices level in absolute terms.
- Precipitation variation index: agricultural risk indicator, see definition in the text.
- Multiple cropping index: agricultural land quality indicator, calculated by dividing sown area by cultivated land.
- Irrigation ratio: land quality indicator, measured as the share of irrigated land in total cultivated land.
- Population density: demographic pressure on land, measured by the ratio of agricultural population over cultivated land.
- Rural households’ assets: rural wealth indicator computed from principal component analysis, as explained in the text.
- Diversification index: the share of employment of rural enterprises in total rural employment.
Appendix 3 – Principal components analysis
Eigenvector and summary statistics for variables entering the computation of the first principal component for the households’ productive assets indicator:
Variable Eigenvector Mean Standard
deviation Number of large and medium tractors owned per
rural household
0.635 0.009 0.010
Number of mini and walking tractors owned per rural household
0.5461 0.113 0.120
Number of carts with rubber tires owned per rural household
0.547 0.104 0.116