HAL Id: tel-01488037
https://tel.archives-ouvertes.fr/tel-01488037
Submitted on 13 Mar 2017HAL is a multi-disciplinary open access archive for the deposit and dissemination of sci-entific research documents, whether they are pub-lished or not. The documents may come from teaching and research institutions in France or abroad, or from public or private research centers.
L’archive ouverte pluridisciplinaire HAL, est destinée au dépôt et à la diffusion de documents scientifiques de niveau recherche, publiés ou non, émanant des établissements d’enseignement et de recherche français ou étrangers, des laboratoires publics ou privés.
Development of a new resource consumption impact
assessment indicator : applied to extraction of materials
versus recycling.
Naeem Adibi
To cite this version:
Naeem Adibi. Development of a new resource consumption impact assessment indicator : applied to extraction of materials versus recycling.. Civil Engineering. Ecole Centrale de Lille, 2016. English. �NNT : 2016ECLI0013�. �tel-01488037�
N°d’ordre : 306
CENTRALE LILLE
Thèse
Présentée en vue d’obtenir le grade de Docteuren
Spécialité : Génie Civil
Par
Naeem ADIBI
DOCTORAT DELIVRE PAR CENTRALELILLE Titre de la thèse :
Développement d’un indicateur d’évaluation d’impacts de
la consommation des ressources : cas d’application à une
extraction des matériaux versus un recyclage
Soutenue le 1er Décembre 2016 devant le jury d’examen
Pr. Mohamed Al-Hussein Université de l'Alberta (Canada)
Président du jury
Dr. HDR. Anne VENTURA IFSTAAR Nantes Rapporteuse
Pr. Guido SONNEMANN Université de Bordeaux Rapporteur
Pr. Essaieb HAMDI ENIT (Tunisie) Examinateur
M. Christian TRAISNEL Directeur Plateforme [avniR] -cd2e Partenaire Entreprise Dr. Jérôme PAYET Pr. Zoubeir LAFHAJ EPFL Centrale Lille Co-Encadrant Directeur
Thèse préparée dans le Laboratoire de Mécanique de Lille, FRE, CNRS 3723 Ecole Doctorale SPI 072 (Lille I, Lille III, Artois, ULCO, UVHC, Centrale Lille)
Acknowledgements
I would like to express my deep gratitude to Professor Zoubeir LAFHAJ my research advisor and supervisor, for his incredible support, kind and patient guidance and useful critiques of this research work. I am very grateful for all of the things he has taught me (in research and personally). In particular, I should acknowledge Pr LAFHAJ self-control and ability to tolerate my moody and quick temper within the last four years!
I would like to thank deeply Doctor Jérome PAYET my co-advisor, who provided knowledge, guidance, and support, especially when I faced tough and challenging scientific and technical issues. His willingness to give his time so generously has been very much appreciated. I appreciate his continuous encouraging comments and discussions.
My very deep gratitude to my director in cd2e, Christian TRAISNEL. His incredible support to me is unforgettable! His guidance, knowledge, and enthusiastic encouragement is a source of inspiration and self-confidence for me.
Further I would like to acknowledge the president of jury Pr. Mohamed AL-HUSSEIN and the members of jury Dr. Anne VENTURA, Pr. Guido SONNEMANN, Pr. Essaieb HAMDI and Christian TRAISNEL to honor me to participate and provide very useful hints for improving this thesis manuscript, which I have delightedly embraced.
Three chapters of current dissertation are my peer-reviewed articles (where in I was the first author) which are either published or under review (at the time of printing this dissertation chapter 1 and 2 is published article while chapters 3 and 4 are submitted and an extra article under drafting). Hence, I should acknowledge all the co-authors whose contribution and support undoubtedly helped me to finish my PhD research work successfully.
I would like to acknowledge the helps from my colleagues and friends in Ecole Centrale de Lille within the last few years who supported me in different ways. Special
thanks to Dr Faycal EL FGAIER, who provided technical support and personal encouragements with an extraordinary patience and calm.
My special thanks go to my colleagues in [avniR] platform, Dr Vanessa PASQUET, Aubin ROY and Alice SALAMON who provided a friendly environment in the office. Our non-stop discussion in the office helped me to change my mind while I was upset or disappointed! I would like also to acknowledge the helps from my colleagues and friends in cd2e within the last few years who supported me in different ways.
I would like to thank Dr. Mehdi KESHAVARZ HEDAYATI, Pedram MASOUDI and Mehdi MAHMOUDYSEPEHR who partly involved in the proof-reading and provided feedback and support on the drafting phase of this work.
And last not the least I wish to express my immense gratitude, appreciation and acknowledge the not-ending support of my Family, especially my Father Professor Aliasghar ADIBI, my mother Dr. Zainab FAGHIHI and my sister Zahra ADIBI. Their endless encouragements, support, patience is unforgettable.
Naeem ADIBI Ecole Centrale de Lille Date 01/12/2016
Résumé
L’augmentation de la consommation de ressources suscite des préoccupations quant à leur disponibilité. Ces dernières années, les organisations nationales et internationales ont défini l’approvisionnement durable des ressources et la mise en place d’une économie circulaire comme des objectifs centraux de leurs stratégies à court et long termes. Dans ce contexte, différentes approches méthodologiques relevant de l’Analyse du Cycle de Vie (ACV) sont utilisées pour caractériser l'impact de l'épuisement des ressources. Les approches actuelles fournissent néanmoins des visions partielles, car dépendantes de données disponibles limitées, et ne reflètent pas les défis de la société en lien avec cette question des ressources.
Un premier problème est le manque, pour certaines ressources, de facteurs de caractérisation ; ce qui rend l'interprétation des résultats d’ACV difficile et peut, dans certains cas, être trompeur. Par exemple, le risque de pénurie élevé des terres rares, qui sont une des matières premières les plus critiques, n’est pas pris en compte dans les méthodes actuelles d’évaluation d’impact du cycle de vie.
Une seconde préoccupation majeure réside dans le cadre conceptuel des méthodes existantes d'évaluation de l’impact sur les ressources de l'ACV. Les défis auxquels est confrontée la société, ne se reflètent pas complètement de façon cohérente dans ces méthodes. Cette thèse propose un cadre pour évaluer les méthodes existantes d'épuisement des ressources dans l’ACV. Sur la base de cette évaluation, des développements visant à compléter les méthodologies actuelles sont proposés, en y ajoutant des paramètres importants (exemple : la recyclabilité) qui ne sont pas encore couverts par les présentes méthodes d'évaluation de l'impact du cycle de vie.
Afin d’apporter une solution à la première préoccupation concernant les méthodes actuelles d'évaluation du cycle de vie des ressources, la thèse aborde pour la première fois, la question des facteurs de caractérisation manquants des terres rares. Pour surmonter ce problème, les modèles de calcul de l’impact des ressources de CML et ReCiPe sont utilisés comme référence. Le présent travail nous a permis de calculer les facteurs de caractérisation pour les 15 terres rares ; ces facteurs seront utiles pour les mises à jour des méthodes mentionnées précédemment et permettrons in fine (via une mise en œuvre dans des logiciels d’ACV comme Simapro ou GaBi) de traiter de l'épuisement des ressources des terres rares.
Pour répondre à la seconde préoccupation, de nouveaux modèles de calcul des facteurs de caractérisation sont développés, prenant en compte différents critères influant sur la disponibilité des ressources à travers différents cycles de vie. L’indicateur ressource proposé dans cette thèse, le « Global Resource Indicator » intègre de nouveaux aspects
comme la recyclabilité et la criticité afin de mieux caractériser l’impact de la consommation de ressource.
Cette nouvelle méthode est capable d'évaluer tous les types de ressources, les renouvelables et les non renouvelables. Les résultats montrent que l'importance des différentes ressources est influencée par l'introduction de nouveaux indicateurs. La sensibilité des facteurs de caractérisation à l'égard de différents paramètres d'entrée est testée et discutée. Les résultats sont comparés avec la méthode CML et une analyse des différences est présentée.
Deux études de cas ont été menées durant ces travaux. La première est un essai de l'applicabilité des facteurs de caractérisation des terres rares issus des modèles CML et ReCiPe. L’application de ces facteurs dans l'ACV d’aimants au néodyme, a montré que la prise en compte des terres rares peut avoir un effet significatif sur l’impact ressource de l'ACV des produits. La seconde étude a permis de tester les nouveaux modèles de calcul des facteurs dans une étude de cas sur une éolienne. Enfin, l'applicabilité de ces facteurs est validée et des précautions d’utilisation sont fournies pour les futurs praticiens. La méthode et les facteurs nouvellement développés fournissent une vision plus exhaustive de la disponibilité des ressources et peuvent être utilisés dans des analyses du cycle de vie ou dans des approches d'économie circulaire. Ce travail fut produit en partenariat avec le cd2e et le pôle de compétitivité Team². Il a également été réalisé en collaboration avec le bureau d’études et d’expertise en ACV, Cycleco.
Contents
Table captions ... v Figure captions ... vii List of acronyms... ix 1. An introduction to Life Cycle Assessment and its application in the construction sector 1-1
1.1 Introduction ... 1-2 1.1.1 Theoretical evolution of LCA ... 1-3 1.1.2 Evolution of Standardization and Regulations of LCA ... 1-5 1.1.3 Evolution of LCA in building sector ... 1-6 1.2 Methodological framework of Life Cycle Assessment ... 1-8 1.2.1 Goal and scope definitions ... 1-8 1.2.2 Life Cycle Inventory ... 1-13 1.2.3 Life Cycle Impact Assessment (LCIA) ... 1-17 1.2.4 Interpretation of results ... 1-24 1.3 Context and aim of this work ... 1-25 2. Resource indicator in Life Cycle Assessment ... 2-26 2.1 Introduction ... 2-27 2.2 Classification of natural resources in LCA ... 2-28 2.3 Resource or reserve? ... 2-29 2.4 Recyclability ... 2-30 2.5 Resource assessment in Life Cycle Assessment versus Circular Economy .. 2-33
2.6 Introduction to resource Life Cycle Impact Assessment methods ... 2-36 2.6.1 Exergy Method ... 2-36 2.6.2 Depletion-based Methods ... 2-36 2.6.3 Surplus Energy Method... 2-37 2.6.4 Marginal Cost (ReCiPe) Method ... 2-37 2.6.5 Willingness to Pay (WTP) Methods ... 2-38 2.6.6 Distance to Target ... 2-38
ii | P a g e 2.6.7 Resource assessment methods in LCA ... 2-38 2.6.8 Critical review of resource assessment in LCA ... 2-39 2.7 Resource Criticality and LCA ... 2-41 2.8 Framework to assess the resource depletion Characterization Factors ... 2-43 2.8.1 A conceptual framework ... 2-43 2.8.2 The basic Assumptions ... 2-44 2.8.3 The input parameters ... 2-44 2.8.4 Availability and reliability of the CFs ... 2-44 2.9 The scope of the thesis ... 2-44 3. New Rare Earth Elements resource depletion indicators for CML and ReCiPe
3-46
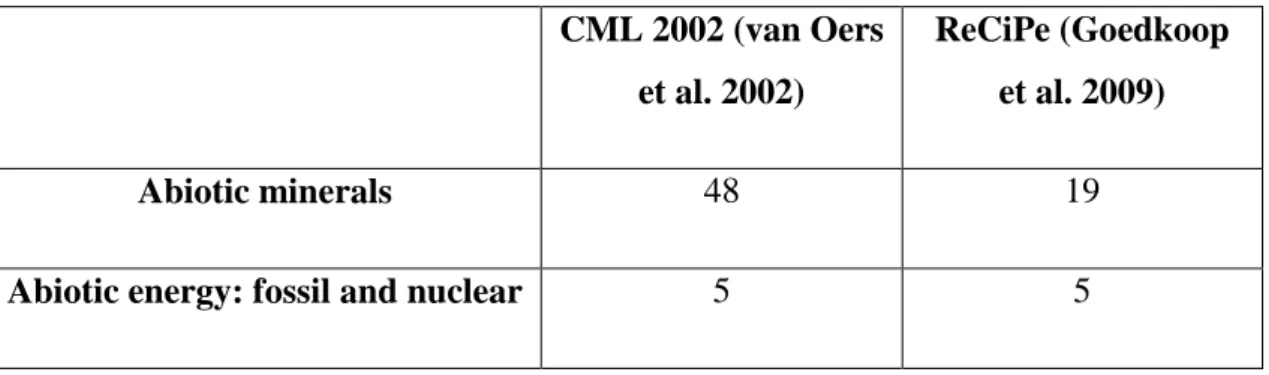
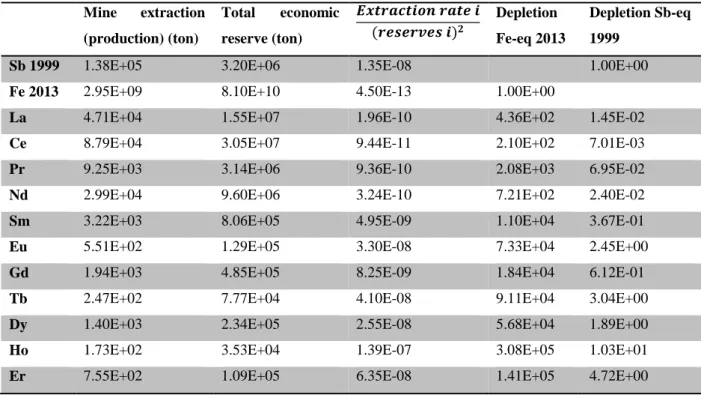
3.1 Introduction ... 3-47 3.2 Rare Earth Elements context ... 3-47 3.2.1 Rare Earth Elements resource depletion assessment in LCA ... 3-48 3.3 The Methods ... 3-49 3.3.1 The CML resource depletion potential ... 3-49 3.3.2 ReCiPe methodology ... 3-50 3.3.3 Existing characterization factors ... 3-51 3.4 Filling the gap of characterization factors for both the methods ... 3-52 3.4.1 Background data collected in this study ... 3-52 3.4.2 Characterization Factors of Rare Earth Elements by CML ... 3-55 3.4.3 Characterization Factors of Rare Earth Elements by ReCiPe ... 3-56 3.5 Discussion ... 3-61 3.5.1 Requirements of resource depletion Characterization Factors ... 3-61 3.5.2 Comparison of CFs, derived from CML and ReCiPe ... 3-64 3.6 Case study on NdFeB permanent magnets ... 3-66 3.6.1 NdFeB permanent magnet ... 3-66 3.6.2 NdFeB permanent magnet inventory ... 3-66 3.7 Conclusions ... 3-69
iii | P a g e 4. Global Resource Indicator for Life Cycle Impact Assessment: applied in wind turbine case study ... 4-72
4.1 Introduction ... 4-73 4.1.1 Resources Life Cycle Impact Assessment ... 4-73 4.2 Methods ... 4-75 4.2.1 Global Resource Indicator (GRI) ... 4-76 4.2.2 Scarcity “X” adapted from CML ... 4-77 4.2.3 Recyclability “Y” ... 4-80 4.2.4 Geopolitical availability “Z” of extractable resources ... 4-82 4.2.5 Sensitivity analysis on the GRI parameters ... 4-87 4.3 Results and Discussion ... 4-88 4.3.1 Short versus Long term vison ... 4-89 4.3.2 Technology changes and substitution ... 4-91 4.4 Application of CFs in the wind turbines and assessment of the results .... 4-91 4.5 Conclusion ... 4-94 5. Resource accessibility: a non-monetary value oriented approach for Life Cycle Assessment in Circular Economy context ... 5-96
5.1 Introduction ... 5-97 5.1.1 Resources in Life Cycle Impact Assessment ... 5-98 5.1.2 Resource assessment in Circular Economy ... 5-99 5.1.3 Resource Accessibility Indicator... 5-99 5.2 Methods ... 5-101 5.2.1 The Anthropogenic-based prediction algorithm ... 5-101 5.2.2 Assumptions and inputs of stability of production stock ... 5-108 5.3 Results ... 5-113 5.3.1 Anthropogenic-based predictor ... 5-113 5.3.2 Stable product ... 5-115 5.4 Case study: LCA of wind turbines ... 5-120 5.5 Discussions ... 5-122 5.6 Conclusion ... 5-123
iv | P a g e 6. Conclusions and outlook ... 6-125
6.1 Conclusions ... 6-125 6.2 Outlook ... 6-128 6.2.1 Resource prospective versus other approaches ... 6-128 6.2.2 Use of input-output tables... 6-128 A- Appendices ... 6-130 A1- The CFs of REEs for the CML and ReCiPe methods, based on the REEs prices in 2013, and the average price within five years from 2009 to 2013 in kg Fe-eq . 6-130
A2- NdFeB permanent magnet inventory ... 6-132 A3- ReCiPe End-point Characterization Factors (CFs) ... 6-134 A4- Substitutability of some resources. ... 6-135 A5- Substitution factor... 6-136 A6- Anthropogenic-based algorithm for predicting the indices for the future . 6-139 A7- Example of assessment of Cross coefficient of recyclable stock for Aluminum. ... 6-140 A8- Inaccessibility reserve versus accessibility recycling. ... 6-141 References ... 6-142
v | P a g e
Table captions
Table 1-1 A non-exhaustive list of scientific publications in building and construction, classified per topic... 1-7 Table 2-1 Recycling rates of some metals given by the appendices in the Supporting Information on the Web from [2], [71]–[73]... 2-32 Table 3-1 Number of natural resources, covered by CML and ReCiPe... 3-51 Table 3-2 Specifications of giant deposits, used in the case study... 3-53 Table 3-3 The availability of REEs in different commodities. ... 3-54 Table 3-4 The CFs of REEs, developed based on the CML method (Fe-eq / Sb-eq) ... 3-55 Table 3-5 ReCiPe Characterization Factors (CFs) of REEs, using 2013 prices. ... 3-60 Table 3-6 Inventory of resource inputs for 1 kg of the permanent magnet cradle to gate / impact of resource based in CML and ReCiPe methods... 3-67 Table 4-1 Dispersion rate of the studied resources [128] [129] [130]. ... 4-82 Table 4-2 Geopolitical stability index of main iron producing countries, considering iron (2013) price. ... 4-84 Table 4-3 Calculation of the geopolitical availability, using the three integral operators. ... 4-86 Table 4-4 calculation of Characterization Factors for short- and long-term resource assessments. ... 4-90 Table 4-5 Scenarios of different wind turbines studied. ... 4-92 Table 4-6 Composition of different types of wind turbines Crawford et al. [135]. *The copper is used as winding wires (recyclable). ... 4-92 Table 4-7 Application of CFs on different wind turbine types. ... 4-93 Table 5-1 Recovery rates and functional lifetime for different applications. ... 5-105 Table 5-2 Parameters of the algorithm, regarding recovery of used materials. ... 5-105 Table 5-3 Relations to calculate the Geopolitical Availability. ... 5-109 Table 5-4 Cross coefficients of the recyclable stock for Aluminium... 5-111 Table 5-5 Flow and Stock for the year of stability (2170) in ton. ... 5-111 Table 5-6 Substitution index for different possible situations. ... 5-113 Table 5-7 Specifications of each material, used in the predictor. * For the wood, the resource is mentioned for 2015 since re-plantation may improve it. ** Precious metal. ... 5-113 Table 5-8 Expert-based values for solving relation 2 for stable-state of production stock. ... 5-116 Table 5-9 Inaccessibility and Accessibility indices (short term). The output of steady-state solution. The units are converted all to equivalent to the production in ton. ... 5-118 Table 5-10 Scenarios of different wind turbines studied. ... 5-120 Table 5-11 Composition of different types of wind turbines. *copper is used as winding wires (so recyclable). ... 5-120 Table 5-12 Results of impact assessment based on CFs for different wind turbines. (Short- and long-term)... 5-121
vi | P a g e
Table A-1 Prices "Vc" are extracted from BCC research and metalprices.com. * Data not available, the average is considered as proxy. ... 6-130 Table A-2 The CFs of REEs for CML and the ReCiPe methods, based on the REEs prices in 2013, and the average price within five years (2009-2013), in kg Fe-eq. ... 6-131 Table A-3 Life Cycle Inventory inputs for 1 kg of NdFeB (32%/66%/1%) permanent magnet. . 6-133
Table A-4 ReCiPe End-point Characterization Factors (CFs) of REEs, using 2013 prices. .. 6-134 Table A-5 Substitutability of some resources. ... 6-135 Table A-6 Resources, used in different parts of building sector. ... 6-136 Table A-7 Substitution factors of resources in the building sector. ... 6-137 Table A-8 Inaccessibility reserve versus accessibility recycling in 1/mt. ... 6-141
vii | P a g e
Figure captions
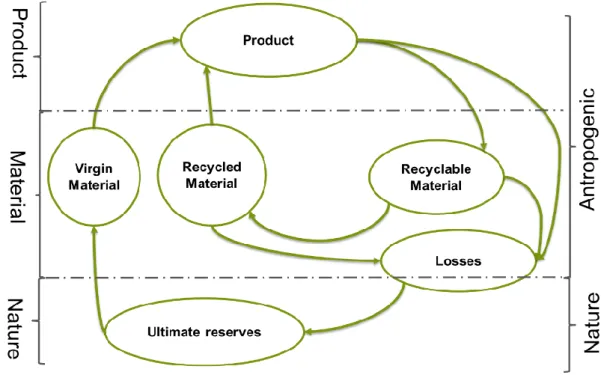
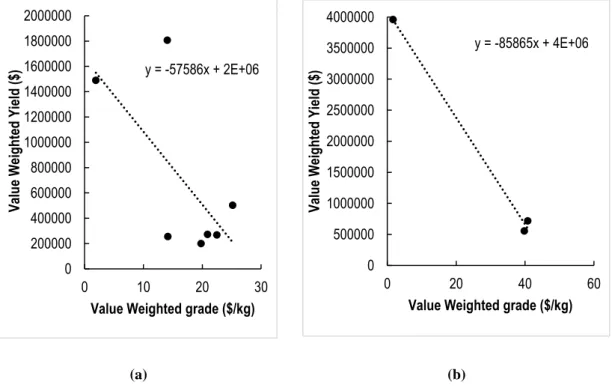
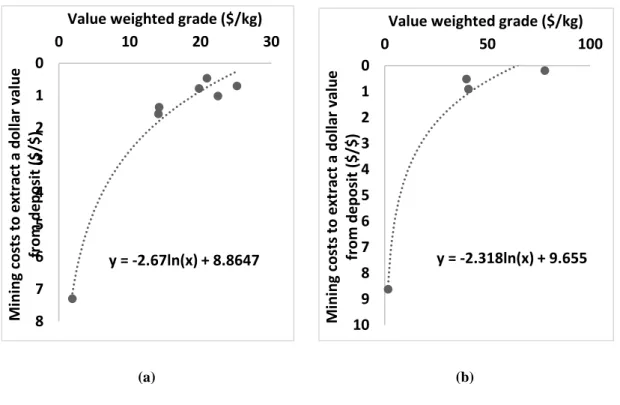
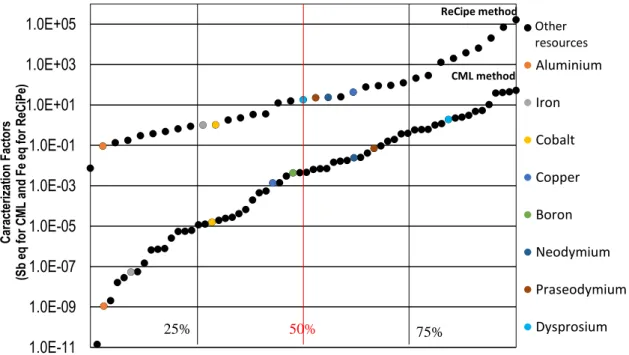
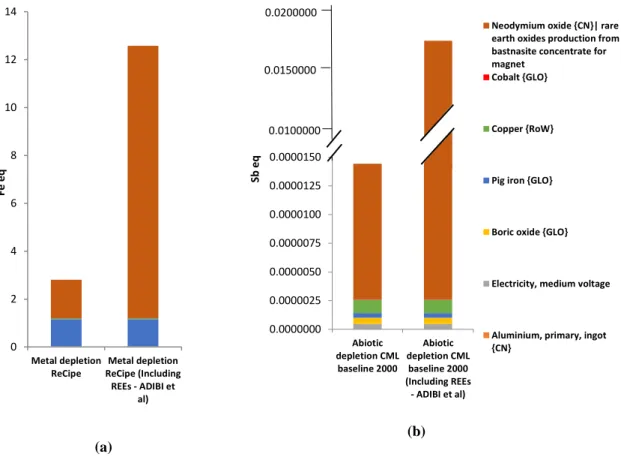
Figure 1-1 Framework of life cycle assessment (based on ISO 14040:2006). ... 1-8 Figure 1-2 Conversion of inventory in environmental impacts. ... 1-18 Figure 1-3 Example of conversion of emissions of greenhouse gases to global warming potential. ... 1-18 Figure 1-4 Example of the mapping inventory data to impact indicators. ... 1-21 Figure 1-5 Characterization modelling at midpoint and endpoint levels from LIME2 method [56]. ... 1-22 Figure 1-6 Timeline of the most common LCIA methods in LCA [58]. ... 1-24 Figure 2-1 Didactic representation of reserve versus resource (a) introduced by [NERC BGS] (b) by USGS ... 2-29 Figure 2-2 Flowchart of life cycle of a metal [73]. ... 2-31 Figure 2-3 The circular nature of the materials between three environments: nature, material and product. ... 2-33 Figure 2-4 Material flow between the stocks. ... 2-35 Figure 3-1 Cross-plots of weighted yield values and grade for a) carbonatites and b) alkali igneous rocks. ... 3-57 Figure 3-2 Grade-cost relation in mines for a) carbonatites and b) Alkali igneous. ... 3-58 Figure 3-3 The CFs, in CML and ReCiPe methods, using 2013 REEs prices, ranked from the lowest to the highest impacts for each method ... 3-65 Figure 3-4 Resource impact assessment contribution analysis for ReCiPe (right) and CML baseline (left) with and without REs CFs of 1 kg of permanent magnet NdFeB (32%/66%/1%) cradle to gate. ... 3-68 Figure 4-1 Resource assessment cause and effect chain, including groups of indicators in LCA, and overall methodology for development of Global Resource Indicator (GRI) current work. .. 4-74
Figure 4-2 Diagram of different aspects of Global Resource Indicator (GRI) (a), compared to the second group, i.e. scarcity resource indicators in LCA (b). ... 4-75 Figure 4-3 Sensitivity of the CFs with regard to subcategories. a) Dispersion rate b) Geopolitical availability (short or long) c) Recycling (short and long) ... 4-87 Figure 4-4 CFs variation in GRI compared to CML. ... 4-88 Figure 4-5 GRI results for the 4 wind turbines technologies at short term. ... 4-93 Figure 4-6 Comparison between four different types of wind turbines (i) CML baseline (ii) short term GRI and (iii) long term GRI in Fe-eq. ... 4-94 Figure 5-1 Overview of the two indicators (Inaccessibility reserve / Accessibility Recycling) within the impact assessment methods. ... 5-100 Figure 5-2 Linear regression between iron consumption and the population of the earth (1990-2015) [149]. ... 5-102 Figure 5-3 Moderate scenario of earth-population between 1950 and 2170 [149]. ... 5-103
viii | P a g e
Figure 5-4 Iron reserve assumptions: Part (i): historical data (1994-2015) from[99]. Part (ii): future extrapolated data. Part (iii): considering cut-off of iron earth reserve base, 230’000 mt. . 5-104
Figure 5-5 The curves of quality degradation, recovery and recycling rates for iron. ... 5-107 Figure 5-6 The stages of anthropogenic-based algorithm for predicting the indices for the future. ... 5-107 Figure 5-7 The output of anthropogenic predictor for the iron. a) The stocks of production, recyclability and reserve during the time. b) The prediction of the recycle content of the iron. .. 5-114
Figure 5-8 The output of anthropogenic predictor for the cobalt. a) The stocks of production, recyclability and reserve during the time. b) The prediction of the recycle content of the cobalt. ... 5-115 Figure 5-9 CFs variation in short -term Inaccessibility Reserve compared to CML. ... 5-117 Figure 5-10 The affecting ratio on reserve and recycling ((in) accessibility/Corresponding Flow). ... 5-119 Figure 5-11 Comparison between four different types of Wind turbines for a) Accessibility of recycling and b) inaccessibility of reserve and the contribution of different resources. ... 5-121 Figure 6-1 The increase of elements and their complexity by the technological progress [Adapted by Reuter from Achzet and Reller, 2011] [72]. ... 6-125 Figure A-1 System boundary for 1 kg of NdFeB (32%/66%/1%) permanent magnet. ... 6-133
ix | P a g e List of acronyms
CEN European Committee for Standardization CF Characterization Factor
CML Centrum voor Milieukunde Leiden DG Directorate-General
DG ENV Directorate General for Environment ELCD European Life Cycle Database
EN European Norm
EoL End of Life
EPD Environmental Product Declaration
EPLCA European Platform on Life Cycle Assessment
FU Functional Unit
GHG Greenhouse Gas
ILCD International Reference Life Cycle Data ISO International Organization for Standardization JRC Joint Research Center
LCA Life Cycle Assessment LCI Life Cycle Inventory
LCIA Life Cycle Impact Assessment LCT Life Cycle Thinking
PEF Product Environmental Footprint
PEFCR Product Environmental Footprint Category Rules REE Rare Earth Element
REPA Resource and Environmental Profile Analysis SD Sustainable Development
SETAC Society of Environmental Toxicology and Chemistry UNEP United Nations Environment Programme
1. An introduction to Life Cycle Assessment and its
application in the construction sector
Highlights:
Introduction to the Life Cycle Assessment method is provided. Application of LCA in building and construction is highlighted.
1-2 | P a g e
1.1 Introduction
Life Cycle Assessment (LCA) is based on the principles of sustainable development. LCA as a tool aims to assess environmental impacts associated with all the stages of a product's life from cradle to grave (i.e., from raw material extraction through materials processing, manufacture, distribution, use, repair and maintenance, and disposal or recycling). The effectiveness and efficiency of these methods lies within the fact that they take into account all life cycle stages of a product, from the extraction of raw materials to End-of-Life treatment through an assessment process, covering different impact categories such as climate change, human health, ecosystems and resources. Considering the stages of a product life cycle and different impact categories, LCA can be utilized as a decision-making tool to help innovating processes and avoid problem of shifting environmental impacts, also minimizing secondary effects. LCA methods have demonstrated their efficiency in systematic environmental assessment of a product, a service or a process [1].
In LCA, inputs and outputs as extracted resources and emissions from different stages of life cycle are assessed in terms of impacts called Life Cycle Impact Assessment (LCIA). Based on the principles of the Sustainable Development (SD), Life Cycle Assessment (LCA) contains a range of methods in assessing environmental, social1[2] and economic aspects of specific products, processes and services.
The aim of this chapter first of all is to introduce the LCA method based on reliable references. Some insights are also provided on historical background and different theoretical developments. The chapter highlights the missing or contradictory aspects to be discussed and further developed in the successive chapters. It includes also an
1 Social LCA is under development. The method intends to assess social implications or potential impacts.
1-3 | P a g e introductory discussion on the use of LCA within the building and construction sector with a focus on resource efficiency in construction.
1.1.1 Theoretical evolution of LCA
The concept of LCA was developed in the United States, late 1960s and early 1970s [3]. At the same time, the other almost identical approach was developed in Europe. Minor public attention was given to LCA, and limited written documents are available between 1970 and 1990. However, the history of LCA is well documented Since 1990 [4].
The complexity of environmental issues is observed primarily by the scientific communities in the 1960s. In 1969, the pattern that later LCA is founded based on, was first applied by Harry Teasley, the Coca-Cola Company [3]. "Resource and Environmental Profile Analysis" (REPA), is a frequent terminology, has been used since 1970, for environmental life cycle-based approaches [3]. In the following years, similar "cradle to grave" approaches, related to environmental assessment of products is developed in France and other parts of Europe.
The LCA, as known today, was partly presented by SETAC (Society of Environmental Toxicology and Chemistry). In 1990, the first document, under the same name and methodology (general structure), was reported by SETAC [4]. In the following years, from 1990 to 1993, various aspects of LCA were further studied and organized by SETAC.
In Europe, Leiden University, the Netherlands (Centrum voor Milieukunde Leiden: CML) played an important role in early 90s to establish the roadmap of further research on LCA. The LCA methodology published in 1993 by CML was one of major foundations of LCA in Europe [5].
The leadership was resumed by ISO from 1994 to 2001, in order to follow the path toward a unified methodology for LCA. Four standards (ISO 14040-43) were issued by delegates from 24 countries, where 16 countries sent observers [6]. The critical review
1-4 | P a g e and its importance in case of comparative assertion was introduced in 1SO 14041 for the first time.
In France, the development of ISO 14040 fixed pragmatic basis, and it was decided to use the term "Life Cycle Assessment" (LCA). From 1997, actions steadily improved and the results have also become more reliable while their communication was more formal. Cooperation between the United Nations Environment Programme (UNEP) and the SETAC was officially launched in 2002 [7], and engaged activities are followed until today. The major reason for this agreement was the requirement of UNEP to implement the sustainable development as the most important aim of humanity in the 21st century. Sustainability can be defined as the practice of maintaining processes of productivity indefinitely - natural or human made - by replacing resources used with resources of equal or greater value without degrading or endangering natural biotic systems [8]. Sustainability is not easy to be measured, but if a solution exists, that would be derived from life cycle thinking approaches based on LCA method.
Later, one of the major LCA events (2005), European Commission’s "Joint Research Center" (JRC) together with its Directorate General for Environment (DG ENV), jointly established European Platform on Life Cycle Assessment (EPLCA). Among other deliverables, European Platform on LCA is coordinating and supporting the development of the International Reference Life Cycle Data System (ILCD).
The ILCD primarily gathered the series of ILCD handbooks and most recently lunched Life Cycle Data Network. The ILCD is based on LCA current consensus best practices. It is developed by a broad consultation and is coordinated by European Commission to ensure the independence [9].
The most recent initiative called “Single Market for Green Products” was started by European Commission following the request of the Council to “develop a common methodology on the quantitative assessment of environmental impacts of products, throughout their life-cycle, in order to support the assessment and labelling of different
1-5 | P a g e products”. A three year pilot [10], started in 2013, to check the feasibility of applying Product Environmental Footprint (PEF) method (published by European Commission) in variety of sectors.
1.1.2 Evolution of Standardization and Regulations of LCA
The new standard ISO 14044 (Environmental management - Life cycle assessment - Requirements and guidelines), in addition to a new revision of ISO 14040, in 2006 [11], replaced ISO 14041:1999, ISO 14042:2000 and ISO 14043:2000. Publication of new international standards on life cycle assessment (ISO 14040 and ISO 14044) was done in 2006. It is recommended that new standards be used as the reference documents for LCA practitioners.
European Platform on LCA, developed by European Commission’s "Joint Research Center" (JRC) together with its Directorate General for Environment (DG ENV) realized research studies and provided numerous resources on LCA, including ILCD handbooks as major LCA reference documents. One of the most exhaustive handbooks, published by JRC called “General guide for Life Cycle Assessment - Detailed guidance” [12] is one of the mostly used LCA reference documents in Europe, these days.
To measure and communicate environmental footprint of products throughout their life cycle, in 2013 European Commission published the PEF/OEF method [13], and through a pilot phase, will test this method on different product groups for further potential policy making in LCA up to 2020.
In 2009, the North American Sustainability Consortium was founded by Jay Golden (ASU) and Jon Johnson (University of Arkansas), and continues to be jointly administered by the two universities today. More than 75 member companies participated in 2011 in the Consortium. The goal to develop the Consortium is to work collaboratively to build a scientific foundation that drives innovation to improve consuming product
1-6 | P a g e sustainability. The Transparency of methodologies, tools and strategies is the advantage of collaborative work in the North America.2
1.1.3 Evolution of LCA in building sector
Since 1990s, LCA has been applied to assess environmental impacts of products and materials in the building construction. Various standards have been developed so far in order to facilitate environmental evaluation based on LCA (ISO 14040 and ISO 14044), and more specifically for Type III environmental declarations (ISO 14025: 2006 the LCA based mechanism, more commonly known as Environmental Product Declarations (EPD)).
Beyond existing guidelines, norms and regulations, two methodologies are applied widely to the building and construction sectors in different countries and regions: Life Cycle Assessment (LCA) and Life Cycle Management (LCM). They cover a large scope from the products, to the building and beyond (e.g. city, district etc.[14]). Assessment in this sector also integrates social and economic aspects, related to this sector.
Although LCA is applied widely in building and construction, harmonization seems essential to mainstream LCA within construction sector. Some issues like, background life cycle inventory data, environmental impact indicators (e.g. resource assessment, which is subject of this work) and life cycle inventory modelling [15] are considered as three most important and significant elements, subject to development within LCA in the coming years.
1.1.3.1 Research in building and construction LCA
Construction industry, is one of leading sectors in LCA-development. The growing importance of LCA as a scientific and practical tool to evaluate sustainability aspects is a appositive trend. Nevertheless still many research opportunities and areas to improve
2 http://www.sustainabilityconsortium.org/
1-7 | P a g e current practice exist. The extended number of scientific studies in different building and construction related areas in different countries emphasize the application of LCA in this sector. A non-exhaustive list of the LCA studies and applications are classified and provided in Table 1-1.
Table 1-1 A non-exhaustive list of scientific publications in building and construction, classified per topic.
ID Topic Examples Authors and year of
publication References 1 LCA for Construction/ building products and materials Concrete, Brick, Wood,
Standards/labels and tools Etc.
(Gursel and Ostertag, 2016; Lasvaux et al., 2016, 2015; Maia de Souza et al., 2016; Mendoza et al., 2012; Rajagopalan et al., 2012; Vieira et al., 2016) [16]–[22] 2 Building Life Cycle Assessment Residential/commercial buildings,
Standards/labels and tools New methods, Etc. (Collinge et al., 2013; Federal et al., 2015; Kofoworola and Gheewala, 2008; Lasvaux et al., 2014; Paleari et al., 2016; Russell-Smith and Lepech, 2015) [15], [23]– [27] 3 LCA of construction related activities Road construction, Bridge construction, Tunnel construction, Etc. (Chowdhury et al., 2010; Du et al., 2014; Huang et al., 2015; Li and Chen, 2017; Takano et al., 2015)
[28]–[32]
4 LCA applied in sediments
LCA for dredged sediment placement strategies, LCA of contaminated sediments,
Etc.
(Bates et al., 2015; Blanck et al., 2016; Chowdhury et al., 2010; Sibley et al., 1997; Sparrevik et al., 2011) [28], [33]– [36] 5 Social and economic LCA Social LCA, Life Cycle Cost, Etc.
(Atmaca, 2016; Dong and Ng, 2015; Hosseinijou et al., 2014; Onat et al., 2014)
[37]–[40]
6 LCA for End of Life management / construction and demolition waste management
(Bovea and Powell, 2016; Butera et al., 2015; Mercante et al., 2011; Sandin et al., 2013) [41]–[44] 7 Urban and district LCA
(Fröling and Svanström, 2005; Jeong et al., 2015; Jian et al., 2003)
1-8 | P a g e
1.2 Methodological framework of Life Cycle Assessment
Based on ISO 14040:2006, LCA framework is designed based on four phases, (Figure 1-1):
1. Goal and scope definition (divided into two separate phases in ILCD handbook and PEF method)
2. Inventory analysis 3. Impact assessment 4. Interpretation
There are interactions between LCA phases as shown in Figure 1-1.
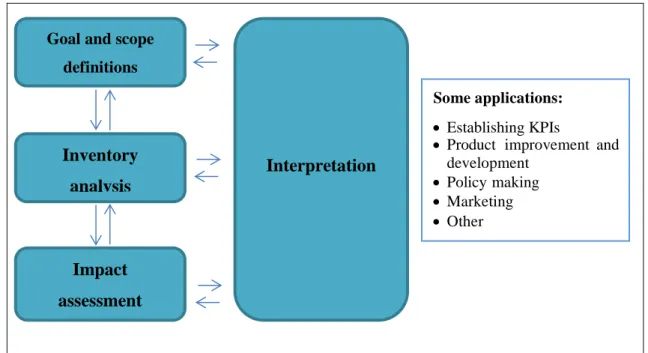
Figure 1-1 Framework of life cycle assessment (based on ISO 14040:2006).
1.2.1 Goal and scope definitions
1.2.1.1 Goals of the study
Goal definition is the first step of LCA, for both single-unit process and comparative LCA. This phase is the most decisive phase of the LCA and consists of defining the aims
Goal and scope definitions Inventory analysis Impact assessment Interpretation Some applications: Establishing KPIs
Product improvement and development
Policy making Marketing Other
1-9 | P a g e of the study. The verification protocols, outlines and quality requirements of the work define the following facts. A clear, initial goal definition avoids misleading conclusions from initial LCA study. It can also limit the use of complete or part of the LCA beyond the initial goal and scope. Based on ILCD handbook [48] the following list is needed to be answered for goal of the study:
Intended application(s) of the deliverables /results (IDEM ISO) Limitations due to the method, assumptions, and impact coverage Reasons for carrying out the study and decision-context (IDEM ISO) Target audience of the deliverables /results (IDEM ISO)
Comparative studies to be disclosed to the public (IDEM ISO) Commissioner of the study
Other influential actors
1.2.1.2 Scope of the study
In line with the goal of the study, details of objects of LCA study, includes life cycles stages and processes should be defined, too. So, the scope definition is to derive requirements on methodology, quality, reporting, and review in accordance with the goal of study. Bellow points on scope of the study should be defined based on ISO/ILCD handbook:
The product system to be studied (ISO)
The type(s) of the deliverable(s) of the LCI/LCA study, in line with the intended application(s)
The system or process that is studied; its function(s), functional unit, and reference flow(s) (IDEM ISO)
LCI modelling framework and handling multifunctional processes and products (called allocation in ISO)
System boundaries (IDEM ISO), completeness requirements and related cut-off rules
1-10 | P a g e LCIA impact categories to be covered and selection of specific LCIA methods
to be applied (IDEM ISO) as well as - if included - normalizing data and weight definition
Interpretation to be used (ISO)
Other LCI data and data quality requirements (IDEM ISO) regarding technological, geographical and time-related representativeness and appropriateness
Types, quality and sources of required data and information, and especially required precision and maximum permitted uncertainties (ISO) have to be defined here
Special requirements for making comparisons between systems identifying critical review needs (IDEM ISO)
Planning the report of results (called format of required report in ISO)
Assumptions, values and optional elements and limitations are also required in ISO 14044.
1.2.1.3 Function, functional unit, and reference flow
1.2.1.3.1 Function, functional unitIn order to compare (specially the products) in a meaningful and correct way, it is important to define function of the system (provided service) and to verify the unit measuring the function, called Functional Unit (FU). Detailed description of the function(s) provided by applied analyzed system is called functional unit in the LCA. The functional unit should be consistent with the goal and the scope of study.
Some questions like “what”, “how much”, “how well”, and “for how long” should be answered in order to define and precise the functional unit.
To make it further clear, following examples split four aspects: for example an insulation product applied in a building wall. A thermal insulation product is a product
1-11 | P a g e whose primary function is to reduce heat transfer3 through the building elements against which, or in which, it is installed.
"What" a wall insulated with an insulation product4 that reduces heat transfer
through the building element
"How much”: The amount of products needed to insulate 1 m² of building wall.
"How well": A thickness that gives an overall heat transfer coefficient5 of X
(Uc = X W/(m2.K)).
"How long" for a design life of 30 years.
The functional unit of the thermal insulation is defined then as:
“Thermal insulation of 1m² of a building wall, with an insulation thickness that gives an overall heat transfer coefficient of the wall equals to X (Uc = X W/(m2.K)), with a design life span of 30 years”.
1.2.1.3.2 Reference flow
Two similar definitions are used in the LCA to define a reference flow:
The first definition: Flow or flows that all inputs and outputs (Waste flow or
elementary flows) are quantitatively associated with fulfilling the function, i.e. functional
3 Heat is transmitted in three different ways – convection, conduction and radiation. Heat flows naturally from a warmer to a cooler medium. In winter, the heat moves from all heated indoor spaces to the outdoors and during summer, heat might move from outdoors to the interior of the building (when the outdoor temperature is higher than the indoor temperature).
4 Thermal insulation is identified based on thermal resistance, known as the R-value, which indicates the resistance to heat flow (heat transfer per unit area per unit time). The higher the R-value, the better the insulating effectiveness. The R-value of thermal insulation depends on the material’s thermal conductivity and its thickness and is equal to R=d/λ (expressed in m².K/W). (“d” represents the thickness and λ the thermal conductivity.)
5 The U-factor or "U-value", the overall heat transfer coefficient, is a measure of heat loss through a material or building element such as a wall, floor or roof U=1/RT (expressed in W/m²K). A low U value indicates high heat resistance.
1-12 | P a g e unit. It can also be directly expressed by functional unit. For example, in case of thermal insulation, the flow can be quantity of materials, in kg, used to cover a specific functional unit. The choice of reference flow depends first of all on type of products. For those products with several functions, a measured amount (e.g. mass in kg) with its technical specification might be more useful.
The location also is an important point to be defined in functional unit and reference flow, including transport and storage phase.
The second definition: Based on Jolliet et al. (2010), reference flow is a quantified
amount of a required product(s), purchased products included, to provide a functional unit [49].
The aim of reference flows is to translate functional unit into specific quantitative product flows for comparing systems.
1.2.1.4 System boundary
The system boundary is defined to describe a supply chain (processes) and scenarios (upstream, downstream and transport), to give an insight into life-cycle stages, processes or necessary data. All decision to include or not to include any life cycle stages or processes should be described in detail in the system boundary.
1.2.1.5 Life Cycle Inventory modelling framework
There are several decisions to be taken during scope definition for the inventory modeling and framework. System details like attributional or consequential modelling and allocation or system expansion / substitution approaches are some issues to be defined during this phase. The goal of study is a crucial point to consider in defining Life Cycle Inventory modelling framework.
1-13 | P a g e
1.2.1.6 Critical review
For controlling quality and credibility of LCA results, a critical review is done by an expert. Different types of critical reviews (panel, individual, etc.) are performed based on goals and scope of the study. There are several available documents that define the minimum requirements, review scope and documentation for an LCA critical review. The critical review should be performed by experts, not involved in the LCA study.
1.2.2 Life Cycle Inventory
1.2.2.1 Introduction
Life Cycle Inventory (LCI) consist of developing an inventory of flows from and to the nature for a product system. Inventory flows include raw materials and energy inputs, and emissions to the air (space), water, and land. The input and output data, needed for construction of a model are collected for all the activities within a system boundary, including a complete supply chain (referred to as inputs from the technosphere) [12].
Data must be related to the functional unit and reference flow, which were defined in the goal and scope phases. The results of inventory is an LCI, which provides information about all inputs and outputs in the form of elementary flow6 to and from the environment from all the unit processes, involved in the study.
The modelling in LCA is based on two specific approaches: attributional and consequential modelling. The processing procedures within the system boundaries differ considerably between two types of modelling in LCI phase.
6material or energy entering the system being studied that has been drawn from the environment without previous
human transformation, or material or energy leaving the system being studied that is released into the environment without subsequent human transformation (ISO 2006)
1-14 | P a g e
1.2.2.2 Data collection, acquisition, and modelling
Data collection and modelling of the system are done during the LCI analysis stage. Like all other phases, the goal and scope of the study should be carefully considered. The LCI phase provides results for all next LCA steps. In some cases, scope of the study can be readjusted during this stage.
Three main steps are done during LCI phase: data collection, acquisition, and modelling. The LCI is the main and the most important time and resource consuming phase in the LCA. For all additional non LCA indicators, separated inventory and interpretations might be provided in LCI phase.
1.2.2.2.1 Type of data
As mentioned previously, the inventory and data collection is one of the most time consuming stages in LCA. In order to reduce the costs one should be defined prior to data collection, the required data sources and the data types. It is suggested to collect specific industry data for production processes.
Two major data types are collected in the LCA: Generic data, which is representative of industry averages, and brand-specific level data. There are two data sources [50]:
Primary data: collected mainly from interviews, questionnaires or surveys, Bookkeeping or enterprise resource planning (ERP) system, data collection tools (online or offline) and onsite measurements.
Secondary data: collected in databases, statistics and through the literature review. Data can also be classified based on the way they are developed: site specific, modelled, calculated or estimated, non-site specific (i.e. surrogate data), non LCI data (used for other purposes) and vendor data.
1-15 | P a g e
1.2.2.3 Attributional and consequential modelling
1.2.2.3.1 Attributional modellingThe attributional life cycle inventory modelling describes the potential environmental impacts that can be attributed to a system over its life cycle: from material extraction, to its use and end-of-life. Attributional modelling is conducted using historical, fact-based, measureable data of known (or at least know-able) uncertainty, and includes all the processes that are identified to relevantly contribute to the system under study [12].
1.2.2.3.2 Consequential modelling
Consequential modelling is a modelling approach to define consequences of a decision for other components of economy processes or systems both internally on the system and on other external systems. In consequential modelling, a hypothetic value chain (not reflecting the actual or forecasted, specific or average situation) is modeled, including specific market mechanisms and potentially including political interactions and consumer behavior changes [12].
1.2.2.4 LCI method approaches for solving multi-functionality
In most cases, more than one input is needed to perform a process, alike a process may deliver several products. In case that a process or a facility provides more than one function, i.e. it delivers several goods and/or services (co-products) the system is considered as “multifunctional”. In these situations, all inputs and emissions, linked to the process, must partitioned between the product of interest and other co-products in a principled manner.
Regarding the multi-output processes the EN 15804 and PEF [13] draft method (Product Environmental Footprint) follow more or less the same decision hierarchy: Subdivision
System expansion (case of PEF method) Allocation based on
1-16 | P a g e 1. a relevant physical relationship
2. other relevant relationship
Allocation should be avoided as far as possible by dividing the unit process or by system expansion.
1.2.2.4.1 Subdivision of multifunctional processes
The only exact method to solve the multi functionality issues correctly, is using subdivision. This approach consists of solving the problem by dividing system and extracting the mono-functional processes that is related to the analyzed system. It is often possible to avoid allocation by subdivision.
The problem of multi-functionality is solved by subdivision if the subdivided processes are not still multifunctional. Even if all multifunctional processes are not divided into mono-functional processes, the quality of data and results are improved in case of partial subdivision.
Subdivision can be applied by both attributional and consequential modelling.
1.2.2.4.2 System expansion (including substitution)
The system expansion7 is done following two main steps: expanding the system boundaries
substituting the function with an alternative way of providing it
7 Example from ILCD handbook: Blast furnace slag is a joint co-product of steelmaking (typically in the range of 0.2 to 0.35 kg per kg hot metal). It is mainly used in cement making (superseding Portland cement) and in road building (superseding primary aggregates), while a smaller part is not used, i.e. deposited. If we want to obtain exclusively the life cycle inventory of producing blast furnace steel, the inventory of the co-function blast furnace slag will be eliminated from the process by subtracting the inventory of the superseded processes. In this way, we can obtain an LCI data set exclusively for the production of the steel from this process/plant. Here we have expanded the system's perspective by subtracting the not wanted function(s) via the life cycle inventory of alternative means to provide it.
1-17 | P a g e The other use of system expansion is when several multifunctional systems are to be compared in a comparative study. As an example, a cellphone with several applications: phoning, internet surfing, taking photos, etc. This would be done by expanding the system boundaries and adding for the given case missing functions and the inventories of the respective mono-functional products: For example, in case of cellphone an inventory of camera will be added to the initial modeling.
1.2.2.4.3 Allocation
Allocation is the last step in solving multi-functionality issue. It solves the problem by fragmenting the sum of all inputs and outputs between co-functions according to a defined criterion. As examples, mass, energy content, market value, etc. are some of allocation criteria, used in LCA.
First of all, allocation should be done based on fundamental physical, chemical and biological relations between different products or functions (According to ISO 14044).
When it is not possible to find clear common physical fundamental relationships between co-functions, ISO 14044 recommends performing allocation according to another link. This may be an economic or energy content.
1.2.3 Life Cycle Impact Assessment (LCIA)
1.2.3.1 Introduction
After grouping the emissions and resources in the phase of Life Cycle Inventory (LCI), impact assessment is then performed following different steps called Life Cycle Impact Assessment (LCIA). LCIA methods aim to connect, emissions and extractions of life cycle inventories (LCI-results) on the basis of impact pathways to their potential environmental damages [51].
Different impact categories like climate change, ozone depletion, eutrophication, acidification, human toxicity (cancer and non-cancer related), respiratory inorganics,
1-18 | P a g e ionizing radiation, eco-toxicity, photochemical ozone formation, land use, and resource depletion are included in LCIA. The emissions and resources derived from LCI are assigned to each of these impact categories based on different available impact assessment methods (Figure 1-2).
Figure 1-2 Conversion of inventory in environmental impacts.
They are then transformed into indicators using factors calculated by impact assessment models, called characterization factors. Weights per unit emission or resource consumed in the context of each impact category are reflected by these factors. An example of conversion of emissions of greenhouse gases to warming potential is provided in Figure 1-3. As illustrated in the figure, The Mass of CO2 and N2O is multiplied
respectively with the Global Warming Potential factor (FGWP) of each gas.
Figure 1-3 Example of conversion of emissions of greenhouse gases to global warming potential.
Two main aspects played a major role in development of Life Cycle Impact Assessment8:
8 It is important to note that the results of LCIA should be seen as environmentally relevant impact potential indicators, rather than predictions of actual environmental effects.
1-19 | P a g e – Decision making in product development and need for better environmental information.
– New knowledge and models based on the development of environmental sciences. Based on ISO, the LCIA stages consist of mandatory and optional steps which are listed below:
Selection of the impact categories (to be considered in the goal and scope phase of a LCA),
Assigning the inventory data to the chosen impact category(ies) (classification), Assessing impact category indicators using characterization factors
(characterization),
Normalization: calculation of category indicator results relative to reference values(s) (optional),
Weighting the results (optional),
Data quality analysis (highly suggested in comparative assertions).
1.2.3.1.1 Impact categories
LCIA methods can be grouped into two families [51]:
1- Classical methods (e.g. CML, EDIP and TRACI): They aim to determine impact category indicators at an intermediate position of the impact pathways (e.g. climate change, ozone depletion potentials, etc.); hence they are so called midpoint impact categories.
2- Damage-oriented methods (e.g. Ecoindicator 99: ReCiPe and EPS): They aim easier interpretable results in the form of damage indicators at the level of the ultimate societal concern (e.g. human health damage).
Midpoint indicators: A midpoint indicator can be defined as a level in a cause-effect
1-20 | P a g e common mechanism for a variety of substances within that specific impact category exists.
For example, Global Warming impacts involve a series of steps, starting with the release of greenhouse gases, and ending with impacts on humans and ecosystems. There is a point where greenhouse gases have an effect on radiative forcing. Greenhouse gas emissions have a pathway that is different before that point, but identic after it. Therefore, the radiative forcing provides a suitable indicator for the midpoint impact category of Global Warming [52].
Some of the LCA midpoint indicators are listed below: Climate change,
(stratospheric) ozone depletion, Human toxicity, Respiratory inorganics, Ionizing radiation, (Ground-level) Photochemical ozone formation, Acidification (land and water), Eutrophication (land and water), Eco-toxicity, Land use, Resource depletion (minerals, fossil and renewable energy resources and water).
Endpoint indicators: Endpoint indicators are calculated to reflect differences
between stressors at an endpoint in a cause-effect chain and may be of direct relevance to society's understanding (areas of protection) of the final effect. Availability of reliable data and robust models to support endpoint modeling remains too limited based a part LCA experts.
Below, a list of the suggested Areas of Protections (AoPs) in LCA: Human health,
Natural environment, Natural resources [53].
Another approach is the LIME [54], developed by LCA national project in Japan. LIME develops a damage-oriented approach. The damage assessment categories are catalogued into four areas of protection: human health, social welfare, biodiversity, and plant production. Two types of weighting methods are used:
1- Amount of monetary value for avoiding a unit amount of damage to a safeguard. 2- Weighting coefficient based on an annual amount of damage to a safeguard
1-21 | P a g e LCIA methods exist for midpoint and for endpoint level, and for both in integrated LCIA methodologies. Both levels have advantages and disadvantages. In general, on midpoint level higher number of impact categories is differentiated (typically around 10), and the results are more accurate and precise, compared to the three areas of protection at endpoint level that are commonly used for endpoint assessments.
1.2.3.2 Characterization of impacts and damages
In order to calculate LCIA results, elementary flows are linked to one or several impact categories to accomplish the impact assessment on the midpoint and endpoint level. We call this stage a “classification” Figure 1-4 give a simple example of the mapping inventory data to impact indicators.
Figure 1-4 Example of the mapping inventory data to impact indicators.
Then the inventory results for each elementary flows are usually multiplied with relevant impact factors (characterization factors) from the corresponding LCIA method; this step is called characterization in LCA. Impact characterization uses science-based conversion factors, called characterization factors (also referred to as equivalency factors), to convert and combine the LCI results into representative indicators of impacts to human and ecological health. Characterization provides a way to directly compare the LCI results within each impact category. In other words, characterization factors translate different inventory inputs into directly comparable impact indicators.
Best available characterization models are identified in the study done by JRC published in ILCD handbook series [55].
1-22 | P a g e Because of complexity of these steps, they are not done directly by practitioners. This part is done in research projects as a part of developing LCIA methods. However, one should check that all inventory elementary flows are correctly connected to the LCIA factors. In most of the cases a practitioner uses an LCA software to assure and simplify the correct connection between these components.
Figure 1-5 Characterization modelling at midpoint and endpoint levels from LIME2 method [56].
As different impact categories have different units, results cannot directly be compared and cannot be summed together. Classified and characterized elementary flows that are “linked” with the LCIA methods are normally available in LCA software.
1-23 | P a g e
1.2.3.3 Optional Elements: Normalization and Weighting
Two optional steps of LCIA under ISO 14044 are Normalization and Weighting. Normalization as the first step supports the interpretation of the impact profile and is the first step to aggregate result. In the next step, weighting transfer separate quantitative weights to all impact categories to express their relative importance.
Normalization is done to help the use of LCIA indicator results into a broader context and adjust results to common dimensions. To do so, the sum of each category indicator result is divided by a reference value.
For each impact on midpoint or endpoint level, normalized LCIA results give a relative share of the impact using overall indicator results, e.g. per average citizen or per country, etc. In this way when different normalized impact categories (midpoint and endpoint) are presented, one beside the other, so one can see the relative importance of each of them.
Like Normalization, different weighting methods are classified in different ways in LCA presented in detail in different publications [57].
1.2.3.4 LCIA methods
The collection of individual characterization models addressing separate impact categories is called LCIA method in LCA. Different LCIA methods are developed in the framework of LCA. These methods provide a framework to progress from inventory flow to the characterization factors. Some of them also provide a way to progress from midpoint to endpoint indicators by different concepts. The Figure 1-6 reveals a timeline on the development different LCIA methods.
1-24 | P a g e
Figure 1-6 Timeline of the most common LCIA methods in LCA [58].
1.2.4 Interpretation of results
In LCA, the phases are as important as the final result. The importance of interpretation is also because it evaluates results of all the LCA steps. The interpretation must also highlight the methods used and shall clearly state the limitations of the study. The interpretation is considered as the last phase of an LCA study; and helps answering the original question, defined in the goal of the study.
The interpretation seeks reliable conclusions from LCA study and seeks to define and study environmental hotspots of a product or a service. For this purpose, it is necessary to analyze the results, define the limits of the performed study. Interpretation can help improving the Life Cycle Inventory model to meet the needs derived from the study goal. Verification of the study is included to improve the confidence and reliability of results. For this step, three essential points should be evaluated: completeness and sensitivity analysis, as well as potentially uncertainty analysis for the determination of precision of results.
The sensitivity control contains the evaluation of the reliability of the final results. The completeness checks to ensure that relevant information and data, required for the interpretation, are provided completely.
1-25 | P a g e If information is missing or incomplete, they need to be analyzed. There are two possibilities: either life cycle inventory must be reviewed or definition of goal and scope of the study must be adjusted.
1.3 Context and aim of this work
Sustainable buildings and construction are the fabric of sustainable lifestyles. Whilst public and industry understand the importance of energy efficiency, the environmental impacts of the building and construction related activities, products, materials and their associated end of life are remained less known. For an energy-efficient house, the embodied energy in the construction represents more than 75 years of heating in equivalent energy [59]. To assess environmental impacts of a building and construction, it is necessary to consider the overall lifecycle (from design to the end-of-life) [60]. LCA appears to be an ideal approach to get this clear global view and helps in making decisions based on scientific facts [61]. All aspects considering natural environment, human health and resource depletion are taken into account. LCA avoids problem-shifting between different life cycle stages, between regions and between environmental problems.
From resource prospective, building and construction sector is responsible for more than third of global resource consumption, including 12% of the fresh water use and its generation of solid waste is estimated to be 40% of the total waste volume [62]. At European level, construction and demolition waste is the largest waste stream representing one third of all waste produced in EU [63]. Therefor the resource efficiency and management is crucial in building construction and beyond. The aim of this work is to propose reliable and applicable indicators in the framework of LCA and Circular Economy to assess the resource impacts and benefits (extraction and recycling).
2-26 | P a g e
2. Resource indicator in Life Cycle Assessment
Highlights:
Upstream and downstream key resource related concepts are defined.
Existing resource assessment approaches and developments in LCA are introduced. Missing or contradictory aspects, related to LCA resource impact assessment
methods are argued.
2-27 | P a g e
2.1 Introduction
Since development of LCA in the early 1990s, the impacts from resource use have been a part of LCA. However, even if a variety of life cycle impact assessment (LCIA) methods already assess resources depletion as an impact category, impact assessment of resources in general and metallic mineral in particular is one of the most controversial issue in LCIA.
First of all, the methods lack both in the number and types of covered resources. As an example, missing rare earth elements characterization factors [64], [65]. In addition, lacking consistency has hampered the development of widely acceptable indicators for the resource use [66]. This was also highlighted by the recent International Reference Life Cycle Data System (ILCD) handbook of the European Commission (EC) Joint Research Center (JRC) [67]. It suggests the need for methodological improvements. This lack of consensus on how resource depletion should be addressed urges - according to the EC - for the development of a harmonized LCIA method for the resource use [68].
The missing alignment among different LCIA methods for resource use impact comes not only from differences in the modeling nature, but also from the differences in definitions and understandings of what the resource problem is, what limits the access to resources and why there is a need to consider resources as an Area of Protection (AoP) as such. There is an obvious paradox compared to the existing resource assessment methods, as in theory all agree that what has to be protected is the access to a functional value of the resources. That means the services, provided by resources are what the society has to protect, not the resource for the sole value of its existence. However, in practice most LCIA methods are only based on geological and recently anthropogenic availability of resources without any consideration of their functionality or of the multiple barriers for their access.
LCA indicators are developed for evaluating criticality, economic and social aspects of the resources. The indicators, could be estimated at two levels: midpoint and endpoint.
2-28 | P a g e At midpoint level, the extraction of a particular resource (biotic or abiotic) is concerned, and indicators are usually based on mass. At endpoint level viewpoint, consequences of extraction, e.g. in environment, becomes important.
2.2 Classification of natural resources in LCA
Resource is a broad term that may encompass elements, including static material (e.g. minerals) and fluctuating phenomena (e.g. wind). Resources can be classified from different viewpoints: components (biotic or abiotic), origin (natural or anthropogenic), function (energy, mineral [metallic, non-metallic]), water, soil, plant or animal or renewability (renewable, non-renewable). Functional perspective of resources can be defined more precisely, using their intrinsic properties. For example, mineral resources are often characterized by concentration degree (or grade), while energy resources are often distinguished by their calorific value. Within the context of LCA, natural resources are generally categorized into: abiotic and biotic resources; renewable and non-renewable resources or stock; fund and flow resources. The following categorization and definitions are proposed by UNEP SETAC Life Cycle Initiative [69].
Abiotic resources are inorganic or non-living materials at the moment of extraction
(e.g. water, metals, also dead organic matter such as peat or coal; cf. UNEP 2010).
Biotic resources are living materials at least until the moment of extraction from the
nature (e.g. wood or fish). In addition, industrial biotic resources (e.g. fish from aquaculture, wood from plantation, agricultural crops, etc.).
Renewable resources are those resources that renewal rates are not much less than
the human rate of consumption.
Stock resources exist as finite, fixed amounts in the environment, with no possibility
of regrowth (e.g. rocks, metals). In other language, renewal rates are much larger compared to the human rate of consumption (e.g. oil).
![Figure 1-5 Characterization modelling at midpoint and endpoint levels from LIME2 method [56]](https://thumb-eu.123doks.com/thumbv2/123doknet/14676466.742505/40.892.115.738.347.817/figure-characterization-modelling-midpoint-endpoint-levels-lime-method.webp)
![Table 2-1 Recycling rates of some metals given by the appendices in the Supporting Information on the Web from [2], [71]–[73]](https://thumb-eu.123doks.com/thumbv2/123doknet/14676466.742505/50.892.108.770.750.1052/table-recycling-rates-metals-given-appendices-supporting-information.webp)