HAL Id: tel-02004524
https://tel.archives-ouvertes.fr/tel-02004524
Submitted on 1 Feb 2019HAL is a multi-disciplinary open access archive for the deposit and dissemination of sci-entific research documents, whether they are pub-lished or not. The documents may come from teaching and research institutions in France or abroad, or from public or private research centers.
L’archive ouverte pluridisciplinaire HAL, est destinée au dépôt et à la diffusion de documents scientifiques de niveau recherche, publiés ou non, émanant des établissements d’enseignement et de recherche français ou étrangers, des laboratoires publics ou privés.
translation
Antoine Faravelon
To cite this version:
Antoine Faravelon. Acceleration of memory accesses in dynamic binary translation. Operating Sys-tems [cs.OS]. Université Grenoble Alpes, 2018. English. �NNT : 2018GREAM050�. �tel-02004524�
THÈSE
Pour obtenir le grade de
DOCTEUR DE LA
COMMUNAUTÉ UNIVERSITÉ GRENOBLE ALPES
Spécialité : InformatiqueArrêté ministériel : 25 mai 2016
Présentée par
Antoine FARAVELON
Thèse dirigée par Frédéric PETROT (MSTII), Professeur Grenoble-INP, Grenoble INP
et codirigée par Olivier GRUBER
préparée au sein du Laboratoire Techniques de l'Informatique et de la Microélectronique pour l'Architecture des systèmes intégrés
dans l'École Doctorale Mathématiques, Sciences et technologies de l'information, Informatique
Accélération des accès mémoire dans la
traduction binaire dynamique
Acceleration of memory accesses in
dynamic binary translation
Thèse soutenue publiquement le 22 octobre 2018, devant le jury composé de :
Monsieur FREDERIC PETROT
PROFESSEUR, GRENOBLE INP, Directeur de thèse
Monsieur ERVEN ROHOU
DIRECTEUR DE RECHERCHE, INRIA CENTRE RENNES-BRETAGNE ATLANTIQUE, Rapporteur
Monsieur GAËL THOMAS
PROFESSEUR, TELECOM SUDPARIS, Rapporteur
Madame FLORENCE MARANINCHI
PROFESSEUR, GRENOBLE INP, Président
Monsieur ALAIN TCHANA
MAITRE DE CONFERENCES, INP TOULOUSE - ENSEEIHT, Examinateur
Monsieur OLIVIER GRUBER
PROFESSEUR, UNIVERSITE GRENOBLE ALPES, Co-directeur de thèse
Remerciements
J
Etiens tout d’abord à remercier mon directeur de thèse Frédéric Pétrot. Malgré son emploi du temps très chargé du à ses responsabilités, il a toujours été disponible pour discuter et m’accompagner tout du long de cette aventure. Et ce bien que je n’ai pas été le doctorant le plus simple à encadrer (on se contentera de citer ma tendance au travail nocturne). Je remercie aussi Olivier Gruber d’avoir co-encadré et largement participé à l’élaboration de cette thèse. Mais aussi d’avoir su me garder motivé avec sa version bien à lui de l’optimisme. Je remercie bien sûr Nicolas Fournel qui, non content de m’avoir donné goût pour les architectures matérielles, est également celui qui m’a permis de rejoindre le laboratoire TIMA pour mon magistère, ouvrant ainsi la voie à cette thèse.Je remercie ensuite mon Jury de thèse. Tout d’abord Florence Maraninchi pour avoir accepté de présidé ce jury. Erven Rohou et Gaël Thomas pour leur retours très intéressants et très positifs. Et aussi Alain Tchana pour avoir examiné cette thèse, et pour ses remarques et perspectives très intéressantes.
De manière plus étendue, je remercie tout ceux qui m’ont accompagné durant ces trois ans, ceux de SLS et de GreenSocs: Luc et Clément qui ont subis mes assauts de questions, Adrien P., Thomas et Olivier M. pour toutes les discussions que nous avons pu avoir, techniques ou non et avec lesquelles ont peut toujours refaire le monde, Adrien B. avec qui j’ai fais mes armes sur Qemu. À Martial et Arief qui ont vécu avec moi les derniers mois de thèses, préparation à l’oral et de rédaction. Et bien sûr un grand merci à Enzo qui a été un excellent public pour les répétitions de ma présentation. Finalement un grand merci à Laurence, avec laquelle l’enseignement à l’UGA et la fin de ma thèse ont été largement plus amusants !
Et je n’oublie pas l’essentiel, en remerciant ma femme, Danmei, que j’ai rencontré aussi dans l’équipe SLS. Merci de m’avoir donné l’envie de continuer et de m’avoir soutenu à tout moments. Sans elle, cette thèse n’aurai sans doute pas connu la même réussite.
Contents
1 Introduction 1
2 Problem statement 3
2.1 Instruction Set Simulation Techniques . . . 3
2.2 Full system simulation with DBT . . . 6
2.2.1 Dynamic Binary Translation principle . . . 6
2.2.2 Simulating complex instructions . . . 8
2.2.3 Emulating memory accesses . . . 9
2.3 Conclusion . . . 13
3 State of the art 15 3.1 Dynamic Binary Translation . . . 15
3.2 Accelerating Full System Dynamic Binary Translation . . . 17
3.2.1 Generated code optimizations techniques . . . 18
3.2.2 Multi Threading support . . . 20
3.3 Accelerating Memory Accesses Simulation . . . 22
3.3.1 TLB based solutions . . . 27
3.4 Conclusion and Remaining questions . . . 28
4 Accelerating DBT using hardware assisted virtualisation for cross-ISA simulation 31 4.1 Introduction . . . 31
4.2 Background . . . 32
4.2.1 Hardware Assisted Virtualization . . . 32
4.2.2 Dune framework . . . 34
4.3 Design . . . 36
4.4 Implementation . . . 38
4.5 Conclusion . . . 42
5 Cross-ISA simulation using a Linux kernel module and host page tables 45 5.1 Introduction . . . 45
5.2 Design of our Solution . . . 46
5.3 QEMU/Linux Implementation . . . 49
5.3.1 Kernel module . . . 50
5.3.2 Dynamic binary translation . . . 53
5.4 Handling Internal Faults at Kernel Level . . . 56
6 Experimentations 61
6.1 Introduction . . . 61
6.1.1 Benchmark set . . . 61
6.2 Breakdown of QEMUexecution time . . . 62
6.2.1 Ratio of time spent in subparts of QEMU . . . 62
6.2.2 Instruction breakdown: percentage of memory accesses in the benchmark 64 6.2.3 Efficiency of existing memory accesses simulation acceleration . . . . 65
6.3 Dune based solution . . . 66
6.3.1 Protocol . . . 66
6.3.2 Performance Analysis . . . 67
6.3.3 Communication costs . . . 69
6.4 Linux Kernel Module solution . . . 70
6.4.1 Performance Overview . . . 71
6.4.2 Hybrid solution analysis . . . 72
6.4.3 Address space mapping analysis . . . 73
6.4.4 Performances with in kernel fault handling . . . 76
6.5 Conclusion and comparison of both methods . . . 78
7 Conclusion 81 7.1 Prospective . . . 83
7.1.1 N privilege levels support . . . 83
7.1.2 QEMUMulti threading support . . . 85
7.1.3 64-bit targets support . . . 85
Chapter 1
Introduction
C
omputing systems are now ubiquitous in our daily life, be it under the form of a computer, or that of a device that performs computations unbeknownst to its user. These systems have taken a major place in modern society thanks to silicon integration that makes them smaller and smaller, and yet more and more feature full, leading to the advent of System on Chip (SoC), now and for some time already, the dominant way of selling silicon. The integration trend makes the design and programming of these chips more and more complicated. It is indeed nowadays fairly common for the ones that are relatively “general purpose” to feature 8 or more cores, gigabytes of RAM and advanced graphics units. To make matters worst, chip makers are producing dozens of different chips each year. Due to this, neither designers, which need to test their designs, nor developers which need their applications to be available as soon as possible for the new chips, can wait for the final tape out. A partial solution to these problems is the use of simulation. Instead of waiting for the chip to be available, a software model of it is conceived, and executed on top of a general purpose computer. Amongst the models, one is of particular interest to us, the model of the processor that executes the code of the operating system and applications.To model instruction set architectures, multiple techniques have been developed through-out time. Historically, the first and simplest one has been instruction per instruction interpre-tation. However, it has been shown to be very slow. To avoid this problem, more sophisticated techniques were developed. Amongst them we can find dynamic binary translation, static binary translation and native (or compiled) simulation. Although the fastest, static binary translation, and native simulation even more so, can not directly run any unmodified target code we might want.
On the other hand, dynamic binary translation is fairly balanced. It is relatively fast (from four to twenty times slower than native execution) and precise enough to run unmodified target software. It is at the base of many industrial grade simulators and in particular of QEMU, which is one of the most widely used simulators nowadays. QEMUitself is used in industrial grade products such as Android Emulator, it is also the official KVM frontend.
While dynamic binary translation already provides satisfying performances, it sill has multiple aspects that could be improved. Out of those, one important bottleneck is the memory subsystem. Each and every target memory access actually has to go through multiple intermediary steps to be executed. In particular, if the architecture we wish to simulate, called the target, uses virtual memory, the target memory management unit will have to be simulated. The result will be called a software MMU. As it is done in software, this simulation will automatically be much slower than target hardware.
context of cross-ISA dynamic binary translation. More precisely, we choose to implement our solution in QEMU. To do so, we offload the process of managing target memory accesses to host hardware, so as to obtain near native performance. This has been done through two methods, one based on HAV, and one based on a companion Linux kernel module for QEMU. In both cases, the goal is to give QEMUaccess to a fully controllable address space, which in turn can be used to provide the target with its own native like address space.
Our best performing solution currently yield a 78% speedup over baseline on average, with speedups of up to 6 times over baseline. It can manage multiple QEMUtargets, and runs full fledged OSes such a Linux. Very few modifications have been made to QEMUand the Linux module is fairly small and maintainable.
The manuscript is organized as follow. Chapter 2 details precisely the problems we identified. Chapter 3 explores solutions which have already been given to these problems, and details what we consider is left to be done. Chapters 4 and 5 present the solutions we designed and developed to address the remaining problems. In Chapter 6 we present the performance analysis we made, and use it to compare the two solutions we propose between each others, and with already existing solutions available in the literature. Finally, Chapter 7 concludes this thesis, and draws some research perspectives.
Chapter 2
Problem statement
I
Nthis chapter, we shall present the main problems faced by fast CPU simulation in the context of full system instruction set simulation (ISS). In particular, we shall talk about the main technologies used to face this problem and their limitations. We will more particularly focus on the limitations of dynamic binary translation (DBT), currently the most efficient and also probably the most widespread amongst these technologies. We will finally detail the problem behind the core of this work, simulating memory accesses in full system cross-ISA simulation using DBT.2.1
Instruction Set Simulation Techniques
In this section we will cover the most common instruction set simulation techniques that exist today. These techniques rely on translating the instruction set of a given architecture, called the target, onto that of another one on which the code will be executed, the host. Multiple techniques exist to reach that goal, each of those have their advantages and drawbacks. However, they tend to follow a simple rule: the faster the technique is, the less accurate it is. While accuracy, in term of estimating the time it takes to execute some program on the target for example, is not always an important concern, abstracting away too many details may leads to also losing the ability to simulate any type of code. We will now present those ordered from the slowest to the fastest in term of simulation speed, and thus, consequently, also from the most to the least accurate.
Interpretation
Interpretation is probably the oldest and the most accurate simulation technique.
The process is as follows. First we read the current instruction, whose address is given by the CPU program counter register, from the target memory model. Then this instruction is decoded so as to extract the type of operation to perform, its inputs, its outputs and its possible side effects. Once this is done, a corresponding piece of code modelling this operation will be executed. This principle is outlined in Algorithm 1. We first retrieve the instruction from the mem array which represents the memory. We then decode it, and two cases are presented. Either it is a simple register to register operation like the “ADD”, in which case we simply read all source registers concerned by the operation, effectuate the computation and store the result in the destination register. Or it is a memory access, as illustrated by the “LDR” case, and then we first read the src register that contains the virtual
while simulation is running do instruction ← mem[pc] dec ← decode(instruction) switch dec.opcode do . . . case ADD do
regs[dec.dest] ← regs[dec.src1] + regs[dec.src2]
end . . .
case LDR do
phys_addr ← softmmu_translate(regs[dec.src]) regs[dec.dest] ← mem[phys_addr]
end . . . end end
Algorithm 1:Typical interpretation based simulator algorithm
address at which the access should be performed. We then translate it, if needed, to a physical address by making a target page walk. And finally we store the result in the destination register.
The process has the advantage of being fairly accurate, as it progresses instruction after instruction. In term of simulation, it can even be cycle accurate. It is also able to run any type of target code, without modifications. Another big advantage is that it is fully portable, i.e. it does not depend on the host. A fairly popular i386/x64 simulator, often used for OS development, Bochs [MS08], still uses this process nowadays.
Its main disadvantage is that its speed is relatively limited. Works from [RBMD03, PGH+11] shows that each instruction execution is at least one hundred times slower than
native code execution. Some optimizations do exist, the main one, called predecoding, being to store instructions in their decoded form in some cache (usually the model of the instruction cache) and directly reusing this decoded form when the same program counter is reached and the cache hits [TGN95].
Dynamic binary translation
Dynamic binary translation, as its name implies, consists of dynamically translating target binary code into host binary code. Phases of simulation will then be interlaced with phases of code generation. It could in many ways be seen as a direct optimization of interpretation, where the result of decoding target instruction, instead of only being executed, is translated into host code and kept for later reuse. Its main advantage is that it remains relatively accurate, and is able to execute any type of target code, while being orders of magnitudes faster than raw interpretation. A precise description of this technique is given in section 2.2. Static Binary Translation
Static binary translation (SBT), as opposed to dynamic binary translation, aims at translating the whole target binary before actually executing the resulting code [CVERL02]. The main advantage of this technique is that since the translation is done offline, no side effects are
2.1. Instruction Set Simulation Techniques seen by the user at runtime. For example, in DBT, some latency might be seen at program launch, or even on user input due to the need of generating code dynamically. Also, more time on optimizing the translated code than in DBT may be spent. Its main disadvantage is that translating code when branches targets are not known statically is quite complex, and in quite a few situations even impossible. Simulating self modifying code, or dynamically loading executable code is also tedious. This usually induces the need of having, embedded in the generated code, an interpreter which, at runtime, interprets offending code. Simulating OS code also requires OS paravirtualization to detect the new code and interpret it. At the end of the day, this means that running unmodified target binaries is not always possible. Native Simulation
Native (or compiled) simulation is probably the fastest cross ISA simulation technique nowadays. At the difference of binary translation techniques, it relies on the target source code. This source code will be compiled directly for the host, with potentially code annotation to be able to reconstruct the execution on real target machine. The necessary accesses to devices will be interfaced with a Hardware Abstraction Layer (HAL), which somehow is a paravirtualization layer. The backend of the HAL can then interface with the device model, written in plain C or SystemC for example. The main limitations of this technique is that first the simulator needs the source code of the application, thus disqualifying proprietary and legacy code, which is often unacceptable. The second disadvantage of this method is that it is highly imprecise. Almost none of the target machine execution information may be retrieved without code instrumentation. The third and technically most restrictive limitation is that it can not easily be used to simulate an OS. In its standard form, this technique indeed relies on knowing in advance everything that will be executed and compile it so as to be able to execute it on the host. This makes it unadapted for full system simulation where no knowledge exists on what will be simulated.
Hardware assisted virtualization
Hardware assisted virtualization (HAV), although not directly targeted at simulation, can still be used to fill some of its roles [SHP12]. Its base principle is to partially duplicate the host CPU so that an unmodified target may run on the duplicated CPU. This duplicated CPU, called vCPU (for virtual CPU) has its own architected state, its own address space as well as its own view of every architectural register. With this method, the target can run at near native speed, unmodified and with the possibility for the host to monitor it. It can be used for example to develop a new OS, or debug an existing one, as well as for deeper performance evaluations with tools such as perf [DM10]. Its only real limit is that both the target and host must have the same ISA. This defeats the purpose of testing new CPU designs, and running legacy or in general binaries from other ISAs.
Summary
To summarize, multiple CPU simulation techniques exist, however only one of them is currently truly able to fit the needs of full system simulation while remaining relatively fast : dynamic binary translation. Other techniques, such as native simulation, may indeed be intrinsically faster, but they are severely limited in term of full system simulation. At best, they need heavy paravirtualization techniques to function, and are usually limited to applications. Hardware assisted virtualization could be used for same ISA simulation,
but can not, at least directly, be used for cross ISA simulation [HPF13]. As such, it seems reasonable to focus on dynamic binary translation for our goal of accelerating full system simulation.
2.2
Full system simulation with DBT
Let us now present how full system simulation using DBT functions. We will detail its current limitations, with a particular emphasis on what interests us the most in this work, the simulation of memory accesses.
2.2.1 Dynamic Binary Translation principle
Frontend
Backend
Target Binary alreadyPC seen ? Decode Fetch Branch ? Executionµop Code generation Translation
cache no
no yes
yes
Figure 2.1: Overview of the DBT process (taken and translated from [Mic14])
Let us first explain the base principles of retargetable dynamic binary translation. The DBT based simulator fetches, instruction per instruction, the code of the target program. This code is translated dynamically to first an intermediate representation (IR) used by the
2.2. Full system simulation with DBT simulator to decorrelate the target ISA from the host ISA. Then this IR is translated to host binary code. Finally, this code is executed directly on the host. A more precise view of the way DBT works is depicted in Figure 2.1. The process begins at the fetch phase. There, we fetch the target instruction located at the address corresponding to its current program counter (PC). Then, this instruction is decoded i.e. the target opcode is translated to a corresponding micro operation that is part of the IR used by the simulator. As long as the instruction is not a branch, we go back to the first step to fetch and translate the next instruction. When finally the currently decoded instruction is a branch, all the micro operations are translated to host binary code. This code is then cached into a translation cache containing translations for the code that has already been encountered. The block that is thus stored is called a translation block, and it is fairly similar in spirit to a basic block as defined in compilation. Finally, the code in the translation block is executed. When arriving at the end of the block, the simulator checks whether the program counter (PC) at which the last branch instruction points has already been seen. If yes, the execution will resume at the thus pointed translation block. Otherwise, it will go back to the fetch-decode phase.
An important point to remember is that the code cache size is not unlimited. Eventually, as we fill it with more and more code, it will be full. At this time, a choice will have to be made so as to evict some already translated code blocks to make room for new ones. A simple yet surprisingly efficient choice is to flush to whole translation cache.
The main advantage of this process is that it does not make any assumption on the target binary. Thus, whether we are simulating an operating system or application code, whether the code is self modifying or if it dynamically loads libraries or executables, nothing changes for the simulator, the fetch-decode-execute process continues. Thanks to using an IR, it is also usually fairly retargetable, i.e. it can support many (target, host) ISA couples. The simulation speed is also vastly superior to interpretation as has been shown in [CK94,WR96,AEGS01].
One limit of full system DBT is that the generated code is usually not much optimized. The reason for that comes from the nature of this code. In full system simulation, one OS and multiple processes will be simulated. At runtime, we have no informations on what we are executing, the result is that many pieces of code we generate might never be reused. Code will also tend to get modified or suppressed by the target resulting in translation blocks flushes. Jumps will happen in multiple places in a block, thus making multiple relatively small partial copies of it. The result is that the opportunities for optimization are limited, and the chances that an advanced optimization be really useful is limited. Moreover, advanced optimizations are time-consuming. Spending too much time optimizing will result in spending a long time to generate the translation blocks, and if the blocks are not reused in the end, this cost will not even be amortized. This issue is dealt with in great detail in the work from [DB00].
The way the code is generated, i.e. instruction per instruction and block by block, will also have an important impact on performance. Usually, existing optimizations will not concern more than a translation block at a time. This means that advanced techniques inspired from other just in time (JIT) compilers such as dynamic inlining and code specialization will be fairly rare in full system DBT. The code will also be marked by the need of keeping the architected state up to date, and in particular target registers. This means that for most instructions, a phase that loads the registers state will often precede the actual simulation code, which will then be followed by a phase that stores the modified registers. The resulting code for a target (Arm in this case) instruction translated to host (x64 here) can be seen in Figure 2.2. We can see that the target instruction, which made no memory accesses to begin with, has been converted to not a single one, but three instructions, with two of them being memory accesses. The first instruction loads the value of the target ip register into a host
add ip, ip, #20 ; 0x14
Generated Code
mov 0x30(%r14), %ebp
1
;Obtain current target register value ;Execute the computation
;Write back the result to target register
add 0x14, %ebp
mov %ebp, 0x30(%r14)
2
Figure 2.2: translation of a target add instruction
register. The second executes the actual computation. And the third one stores the new value of the register into the architected state. Just from sight, we can imagine the resulting code will be much slower than native code. The host add will probably execute in one cycle, but both the load and store may need several cycles to execute. And this example is for a simple instruction, complex instructions might result in much more host code to simulate them.
2.2.2 Simulating complex instructions
Another performance bottleneck of DBT is the simulation of complex instructions. What we call complex instructions are those that can not directly be translated from a target instruction to a near equivalent host instruction. Those come from three groups.
• The first group is architected state updates. Those are instructions that change the state of the CPU and not just of a standard architectural register. This could be a TLB flush instruction, or a switch to a different privilege level. These usually imply an important amount of checks and modifications to be done by the simulator and would be highly impractical to do directly in IR,
• The second group are the vectorized and floating points instruction sets. Those in-structions are usually fairly hard to map from one ISA to another as compliance to the standard and legacy are conflicting interest in floating-point unit designs. An extensive analysis of floating-point simulation can be found in [SBP16]. Regarding integer vectorized instruction, [MFP11] has proposed extensions of an IR to include SIMD instructions and demonstrated large speedups on applications extensively using these instructions.
• The final group is memory accesses. Those heavily depend on the architected state of the target, and in particular of its MMU for target virtual address to target physical addresses translation. Due to the code implied to make a target page walk, C code is almost unavoidable in current simulators. We will explain memory accesses emulation more precisely in 2.2.3.
From now on, we focus on memory accesses. The main solution to simulate those instructions is to call a C function, called a helper, that emulates the target instruction behaviour. Such a call is depicted in Figure 2.3. As we can see, a helper call induces an important overhead compared to standard generated code execution. It will induce at least an argument setup phase (we place arguments for the helper in the right registers or at the
2.2. Full system simulation with DBT
mov rdi, arg1 mov rsi, arg2
mov r10, helper_address call *r10 helper_address C all t o he lper re turn t o ne xt ins truc tion Helper code (C)
Qemu process
Figure 2.3: Call of a C code helper
appropriate position on the stack), a jump to the helper, register saving then restoring due to the call, and an indirect jump back to generated code. Just these phases, without simulation code, is already much more than say a memory access or a standard vector instruction in term of execution time. This makes helpers an important element of slowdown compared to the raw execution of generated code.
2.2.3 Emulating memory accesses
We will now detail more precisely the techniques currently used to simulate memory accesses. Emulating memory accesses in the context of DBT is actually fairly complex. This task consists in making an unmodified target binary believe that it executes in an address space that is the same as in real hardware. This implies simulating multiple key points of the target machine, including its MMU, all its memory instructions and memory related faults. All of this also brings a fairly large architected state, with the notions of privilege levels, page size, potentially page table format.
For the sake of clarity, in this section, we will consider that the target ISA is based on a 32-bit ARM processor with an MMU and that the host ISA is an Intel x64 machine.
ldr16 Rx,@
0x13
Guest Physical Memory
P(@31..12) Guest TLB @31..12 @31..12 @11..0 P(@31..12) TTB @31..20 L1 Master Page Table @19..12 Coarse L2 Page Table P(@31..12) TLB Update 0x37
Figure 2.4: Simplified view of the hardware support to address translation on the ARMv7 architecture
assembly instructions execute as expected on the guest hardware. So for instance, the ARM instructions for memory accesses, ldr and str, executes as expected, either manipulating physical or virtual addresses. If virtual, this means that the MMU has been set up and enabled. This guest perspective is depicted Figure 2.4, looking at a ldr instruction. In this picture, we assume pages of 4KB (the smallest granularity for ARMv7). We classically call virtual page number (VPN) the page number obtained by bit 32 to 12 of the virtual address, and physical frame number (PFN) the translation of these 20 bits into physically mapped pages. When executing the load, the hardware accesses the Translation Lookaside Buffer (TLB), a small fully-associative memory that caches the most recent virtual to physical translations, to obtain the page frame number, as depicted on the left-hand side of the figure. If the address translation is not cached (TLB miss), the page table structure that contains the OS defined VPN to PFN mappings for the current process (identified by the Translation Table Base register, TTB) is traversed. If the translation is found, the TLB is updated and the instruction finishes. If not, a page fault exception is raised, and it must be handled by the OS running on the guest.
On Figure 2.5, we take the host perspective, showing the architected state maintained by the emulator, focused on the emulation of the memory subsystem. The guest physical memory is composed of pages, so the emulator is managing corresponding pages in its own virtual memory. Indeed, the emulator executes as a regular process and can therefore allocate pages of memory. The emulator also needs to simulate the guest hardware MMU in software, this is the role of the software MMU tables. The first table translates guest virtual addresses to guest physical addresses while the second table translates guest physical addresses to host virtual addresses.
Still, on Figure 2.5, we can also see the guest instruction and its translation into the code cache. The guest ldr instruction can be found in one of the physical page of the architected state. Before being executed, it is translated into a snippet of x64 instructions to carry the call to the helper function, a C function available in the code of the emulator. The helper function navigates through the tables of the software MMU in order to translate the address at which the ldr instruction performs an access. If the guest MMU is enabled, the address is a guest
2.2. Full system simulation with DBT
ldr16 Rx,@
H(P(@))
Host Virtual Memory
Code Cache
Helper(Rx,@)
Trans
late
Shadow Page Table
Software MMU P(@31..12) Model of Guest TLB @31..12 @31..12 TTB @31..20 L1 Master Page Table @19..12 Coarse L2 Page Table P(@31..12)
Guest TLB Model Update
@11..0
0x13
P(@31..12) H(P(@31..12))
Host Traversal of Guest Page Table
0x37
Guest Physical Frame
Hash
Figure 2.5: Host view of the architected state of the guest
virtual address, first translated to a guest physical address, and finally translated to a host virtual address.
The software MMU is also responsible for emulating memory-related traps that may occur during the address translation or the actual memory access. The address translation may fail due to a missing mapping or an invalid access right. The translated address may also turn out to be an invalid address in the guest memory map. Overall, this means that the emulator must emulate the guest processor behavior for traps, emulating the jump through the vector of trap handlers.
While this emulation approach works, its performance can be improved. Helper calls and the software page walks induce an important overhead. Because the code of the software MMU is fairly large, the impact on the instruction caches is non negligible. Furthermore, the translation always happens, always walking the page tables, inducing memory accesses that may trash the data caches and therefore negatively impact the performance. These overheads have suggested an optimization in software, inspired by the hardware Translation Look-aside Buffer (TLB). It is organized as an inlined fast path and the slow path being the call to the helper function. The inlined fast path is just a few instructions and a few memory accesses, looking up in a small table that caches the latest translations, exactly like a hardware TLB would do. Unsurprisingly, this table is called the software TLB.
The code of the fast path can be seen in Figure 2.6. The first two instructions are not strictly part of the Virtual TLB code, but are in charge of retrieving the guest register value and add the offset of the target load instruction (4 here). The ten next instructions are the real Virtual TLB code. First we compute the index at which the guest address should reside within the Virtual TLB. This is a simple hash where we take the N first bits of the VPN, N being the base 2 logarithm of the size of the Virtual TLB. Obviously, just as with a hardware TLB, it is possible that the hash will collide, and thus that the address at the index will not be the right one. To check this we also compute a tag, which is the rest of the guest VPN. Those steps are covered between line 2 and line 7 of generated host code. Then, at line 8 we compare the computed tag with the one from the Virtual TLB entry. If it matches, the jump at line 10 is
return address
return address
slow_path_trampoline:
slow_path_trampoline:
helper_address
Figure 2.6: Qemu fast path code
not taken. Execution continue to line 11 where we retrieve the host address corresponding to this entry. And we execute the access at line 12. However, if the tags did not match, we now have to call the slow path. This is done by first calling a short trampoline code, always placed at the end of every translation block, which prepare the Soft MMU handler arguments, and then actually call it (line 0 to 4 in trampoline code). Once the handler returns, at line 5, the trampoline retrieves its return value and place it in the right register (to correspond to generated host code). Then, we jump at the next instruction in the code cache. So, even in the best case where we have a Virtual TLB hit, we will execute 11 instructions purely for the Virtual TLB, which includes three memory accesses and one jump. In the end, the software TLB improves performance, but it is not ideal. The code to access it contains much more than the original single guest instruction, either a ldr or a str instruction. Furthermore, whenever the fast path fails, the slow path is still a full call to the helper function, with a full address translation done in software.
2.3. Conclusion complex. A whole architected state has to be maintained so as to track the location of the target physical frame and the exact target MMU state. The code to access target memory then potentially includes a full walk of both the target page table and the simulator shadow page table. An acceleration do exist to avoid constantly doing this. However, this optimization is still far from the original code in term of size and performance.
2.3
Conclusion
Simulating an instruction set architecture is a task that dates back to the infancy of computer design. In this chapter, we have seen that multiple instruction set simulation techniques exist, with different speed of execution versus accuracy of non-functional properties (such as time or power) trade-offs. Also, among these techniques, not all have the ability to perform cross-ISA full system virtualization. For that goal, dynamic binary translation, thanks to its property, is the solution we select. It offers support for unmodified target programs, including OSes and binary only (legacy) code, as well as a decent speed. Its accuracy in term of estimation of non-functional properties can be made reasonable [GFP09]. Yet, it also faces its own performance problem. Amongst those, one has particularly caught our attention, target memory accesses simulation. We then ask ourselves the following questions:
1. What schemes may be devised so as to accelerate target memory accesses simulation in dynamic binary translation?
2. What is the most efficient method we can think of to implement those schemes? 3. Are the designs we choose to accelerate target memory accesses simulation
implemen-tation specific, i.e. tied to the underlying OS or framework we use, or can they be reused atop any of those?
Chapter 3
State of the art
I
Nour problem statement, we introduced dynamic binary translation as an efficient mean to perform efficient instruction set simulation. This technique spans far more than that, and in this chapter we briefly present an overview of other applications of DBT that demonstrates its interest. Indeed DBT, which relies on compiling dynamically a target binary machine code into a different binary machine code which will be executed on the host machine, is at the core of multiple other technologies. Those mainly are high level languages virtual machines, code instrumentation, host specific dynamic optimization, low energy consumption instruction level parallelism optimizations and fast CPU simulation.With this landscape settled, we present the various techniques that have already been used to optimize the speed and efficiency of dynamic binary translation. And finally, as this is the main scope of this work, we present techniques that were devised specifically to optimize target memory accesses simulation.
3.1
Dynamic Binary Translation
Dynamic binary translation, which is also sometimes references as Just In Time compilation (or JIT) in its general form is a technique used to translate, at runtime, a binary code to another one. It may be used either to translate machine code from different ISAs, as is the case in simulators, or high level languages bytecode to host machine code as is often the case in high level languages.
Virtual Machines
One of the very common use of dynamic binary translation is for high level languages virtual machines. The first use of DBT in general was actually the virtual machine made for the smalltalk language[DS84]. In this work, the authors try to obtain a fast implementation of the smalltalk-80 system. For this, they already use a bytecode as an intermediary representation of their program. However, instead of being interpreted, this bytecode is dynamically translated to host binary code. This in turn allows for the reuse of the generated code, and leads to important speedups compared to pure interpretation. Their inspiration came from [Rau78] which already exploited the fact of compiling a high level language to an intermediary one. Then this language is dynamically, or equivalently “just in time”, translated to host code. A cache, smaller than the overall program, is then set up to contain the most often used subset of the translated code.
One of nowadays most used programming language, Java, also uses DBT to speedup its execution. And in particular, in its server version [PVC01] which is a performance critical component. A difference with smalltalk is that, especially in the server version, many aggressive optimizations were added, such as code inlining or complex graph coloring based register allocation. This, in many ways, brought those languages closer in term of execution speed to compiled languages.
Legacy Code execution
Another popular use of dynamic binary translation has been the support for legacy code execution, or interoperability in general. The idea there is to execute a binary application, or potentially even an OS, made for an ISA that is not compatible with the current host. This can be used whether for compatibility with a legacy architecture, examples of those are Transmeta’s Crusoe [DGB+03] which is able to run any x86 binary unmodified on a custom
VLIW host and DAISY [EA97] which can do the same for PowerPC and potentially other architectures. These two solutions are able to simulate target OS code, or even bios. Other works, such as [BDE+03], aim at providing the capacity to run x86 unmodified appliactions
on IA64 CPUs, and Aries [ZT00] which does the same for PA-RISC ISA to IA64, only focus on application level compatibility. We cannot end this paragraph without mentioning Rosetta, from Transitive Technology (a spin-off of University of Manchester [RS97]), that ran applications compiled for PowerPC on x86 from 2006 to 2009 on Macintoshes.
Code Instrumentation and tests
Popular code instrumentation and test tools such as valgrind [NS07] or DynamoRIO[BZA12] also use dynamic binary translation to speed up their analysis. Usually the principle of those is to add, at some specific checkpoints in applications (memory accesses, memory allocations, memory deallocations), pieces of instrumentation code which allow to ensure the application behaves as expected. Valgrind can also be used to estimate program performance across various metrics such as cache utilisation and hit ratio or branch predictor misses. DynamoRio offers this possibilities plus other functionalities such as backward compatibility analysis. Recompilation, or binary optimization
One of the historical usages of DBT has been to improve applications performance. As an example DynamoRIO, before being used as an instrumentation tool was used as an optimizer [Gar03] for x86-IA32 code. DynamoRIO itself was based on dynamo [BDB11] which provided transparent optimization of HP-PA binaries on HP systems. The main hypothesis those optimizers based themselves on is that static analysis of compiler is no longer enough due to the late binding approach of newer executable[BDB11] (object oriented programming, dynamically loaded libraries). To improve performance, the idea is then to make optimizations that catch performance problems which could not be seen by the compiler. Example of those mainly being indirect branches, virtual function calls and redundant jumps and calls due to those.
Other works such as [KCB07] propose to cooperate more directly with the static compiler, with the static compiler preparing optimized code templates to be instantiated at runtime. Finally, works such as [ECC15] which is based on [CCL+14], continue on this trend of
cooperation but with the goal of improving program interoperability and performance. This can be particularly useful given the jungle of SIMD instructions that are available on different
3.1. Dynamic Binary Translation generations of processors. Basically, most of the program remains in standard C code, but performance critical sub parts which require host specific features are written in a RISC like intermediary language. At runtime, this intermediary language is translated to performance related host specific instructions.
Hardware optimization
Another optimization use of DBT is hardware co-designed DBT. This is a relatively new trend which aims at bringing DBT to native or superior performance in multiple scenarios. The principle of those solutions is to take care, in hardware, of various parts of the DBT. Those are typically used in an optimization context where we translate a RISC based ISA to VLIW based ISA so as to reach performance near to that of superscalar CPUs with a much lower energy footprint. An example of such works is [RRD17]. In this work, the authors are using a Mips target over a VLIW based host. What this work mainly aims at is to discover instruction level parallelism in the Mips target code, and schedule those instructions in parallel on the VLIW host. This solution obtains up to eight times speedup over a software implementation of the DBT while consuming eighteen times less energy. These kinds of approaches are also used in industry grade solution by NVIDIA[BBTV15], but with an ARM target.
Full System Virtualization
Finally, many tools used for full system virtualization are based on DBT. Amongst them, one that probably is the most used nowadays is QEMU [Bel05a]. It offers a full system simulation mode, with the capacities to simulate many types of devices. As of the time of this writing, its DBT engine is able to simulate 21 groups of ISA (with 32 and 64 bits variants), and it can simulate popular computing devices such as a PC board or a Raspberry Pi. The core of its technology relies on a front-middle-back end design. The frontend is mainly composed of target instructions decoders for each ISA, which decodes target instructions and translate them to the middle end intermediary representation. The middle end then makes an optimization pass on the IR and transmits it to the backend. The backend finally translates the IR to host binary code. This design allows to decouple frontend and backend completely. Thanks to this, the simulator is relatively easily retargetable both for new target and host architectures.
To give a more precise idea of this accomplishment, only Simics [MCE+02], which is
also a full system simulator, seems to be able to handle a comparable quantity of targets. And Simics, at the difference of QEMU, is based on interpretation, with its interpreters being generated from a high level description instead of being hand coded.
While it is the most widespread, QEMU is not the first tool of this kind. We can cite Mimic[May87] as probably the first one to use DBT for simulation, which was made to simulate a full System/370 based computer. Embra [WR96], which itself is based on Shade [CK94] then simulated a full MIPS based board with multiple CPUs and their caches. Even today, other simulators based on DBT still exist. An example is CAPTIVE [SWF16], which also gained the ability to leverage HAV in a cross ISA context. We will detail CAPTIVE more precisely in section 3.3.
3.2
Accelerating Full System Dynamic Binary Translation
We now interest ourselves in the techniques which have traditionally been used to accelerate dynamic binary translation. Those are first the optimization of generated code, with mainly the introduction of trace based generation. This is often done using another thread so as to avoid stalling execution. Then the support for mutli threading simulation itself has been fairly sought after as it allows to potentially multiply performance by the number of target cores.
3.2.1 Generated code optimizations techniques
Many of the optimizations techniques here were devised in works concerning runtime optimizers based on DBT, but those can also be applied to full system simulation.
A
B
D
C
a) CFG view b) Trace view
A B D A C D
Figure 3.1: Example of a simple CFG and its equivalent trace view
Before delving into these optimizations, it is important to explain the two main repre-sentations of the code a DBT code generator, or more generally any compiler, may have. Figure 3.1 supports this explanation.
On the left, we have the standard form that is used in compiler, the CFG (Control Flow Graph). This representation partitions a program according to its branch instructions. Basically, each rectangle in the figure represents a continuous sequence of instructions that does not contain any branch but the last instruction, that is a branch instruction. These rectangles are termed “basic blocks” in compiler writers parlance. A basic block points to its successor block or successors blocks, which themselves point to their successors, and so on. On the right, we have a trace based view of a program. In this case, there is still weak notion of block. However, the notion of successors disappears. A trace is a continuous flow of blocks, without any branching outside the trace. It is for example possible that a loop be
3.2. Accelerating Full System Dynamic Binary Translation one trace, with the end branching back to the beginning of the trace. On the other hand, if a block has two successors, then only one can be part of the trace. A different trace will then exist for the other successors.
One such example is optimization work made by DynamoRIO[Gar03]. The base idea in this work, and most others, is to go from the usual compilation CFG-basic block paradigm to a trace based approach. In its basic approach, DynamoRIO still relies on a basic block vision of the target code. It decodes the target binary instruction per instruction and stop whenever a branch happens. The problem with this approach is that at the end of every basic block, control must be transferred back to the DBT engine, which implies a full context save, a hashtable lookup and then state restoration.
To enhance performances of the optimizers, the authors changed this process with the aim of reducing the number of control transfers. The first level of optimization is to link generated blocks which use direct jumps to each other directly. This already allows to avoid control transfers in simple cases. However, the problem remains for indirect branches (branches with a register that contains a pointer to the target as an argument). Those can not be solved at generation time, as such the previous optimization can not be used on them. Also, while direct jumps are faster than a control transfer, the jumps can still potentially be avoided in a trace, and other performance metrics such as cache locality might suffer compared to target code original layout.
As a solution to these problems, the authors changed the code generation so that basic blocks which usually execute in sequence may be squashed together in a contiguous block. This block being called a trace. Then, if one of the basic blocks contained in the trace ends in an indirect branch, an in cache check is made to check whether the target remains (or not) in the trace. If yes then no control transfer will be made and we can expect a performance enhancement. To make the traces even more relevant, procedure calls are also inlined in full.
Overall, according to the authors’ analysis, the direct linking of basic blocks has an effect as dramatic as caching translated code (e.g going from interpretation to DBT). Traces and in cache indirect branch checking then add a significant performance boost.
Optimizations on the generated code itself were also applied, those mainly being redun-dant load removal, which as its name implies, removes load from memory to register when the value already is in a register. Architecture specific optimizations are also added. Those consist in choosing generated instruction according to the exact CPU architecture used by the host. Reusing the authors example, inc and dec are slower on a pentium 4 than add 1 and sub 1. However, those are faster on a Pentium 3. As such, the optimizer will choose which instruction to use at runtime, depending on the host CPU. Finally, the authors implemented indirect branch dispatch, which consists of replacing the indirect branch lookup with an inlined fast path for common target. This fast path is a sequence of compare and conditional branch, with at the end a hashtable lookup if none of the inlined targets were correct.
An improvement to the trace generation method was later done in [GF06], in the context of a Java VM. In this work, no basic blocks are ever generated. Whenever the VM tries to generate code, it only generates a trace. For this particular work, the span of traces was chosen to be loops; e.g the beginning of a trace is the entry of the loop, and its end, the exit of same loop. As traces are generated they begin to form a trace tree, which is a group of traces sharing the same root.
According to the authors, in addition to the benefits which could be expected according
to [Gar03], the main advantage of this method is that compilation is much faster. The authors
confirm their code generation is made in linear time. Even more, they manage to produce code that is in a specific optimization format, that is SSA (static single assignment). SSA
being a special set of constraints on the code allowing to perform optimizations and register allocation much faster than in the general case.
3.2.2 Multi Threading support
Similarly to many other types of applications, simulators can profit from the fact that modern CPUs possess multiple cores. To do so, the simulators must be rethought to parallelize subparts of their execution. Two main paths have been explored, one is to parallelize code generation so as to make it parallel to its actual execution. The other is to parallelize the simulation of multi core targets, with each target core having one corresponding host thread. Multi threaded code generation
A first approach to parallelism is to try to offload some of the complex tasks of DBT onto threads other than the main execution thread. One particularly complex operation is to generate high quality code.
Multiple works have tried to tackle this problem in multiple situations. Work from
[BEvKK+11], is the first we found concerning full system Simulation. This work tries to
heavily parallelize the code generation in the ArcSim[BFT10] cycle accurate simulator. This simulator is custom made for the ArCompact ISA and used LLVM[LA04] as its code genera-tor.
The idea in this work is to decouple fully the code generation process from execution. Execution, at first, is made by interpreting target code. Then, as hot paths (or traces) are discovered, those are compiled to host binary code. To do so, code generation itself is heavily parallelized with multiple threads waiting to generate traces. Whenever a trace is discovered, it is placed in a working queue. This queue is sorted in order of priority, with the hottest and most recent path having the highest priority.
HQEMU [HHY+12] is another work that aims at using multi-threading in order to provide
enhanced code generation in DBT, and in QEMUin particular. The authors’ motivation can be explained through three observations. First, code generation in DBT must have a negligible impact on runtime to avoid slowdowns. Second, fast code generation techniques, such as the ones used currently in QEMU mono threaded code generation, lead to poor code optimizations. Efficient code generation techniques (e.g. those that provide high quality code) are time-consuming, and therefore not directly suited to DBT. Coming from those three observations, the authors designed a new solution which would allow to have both negligible impact on runtime and good quality generated code.
To that aim, the authors decided to split code generation in two phases, but kept code generation coupled with execution (e.g. code has to be generated before being executed). The first phase is a fast code generation phase which allows to begin code execution as fast as possible. This also ensures that no code is interpreted, even if outside hot paths, potentially enhancing performance for those as well. Then, while execution of this generated code is happening, a second code generation phase will optimize this code through more advanced optimization techniques. This optimized generated code can then replace the non optimized one in the DBT code cache. The core idea of this work is that both of those processes run in parallel on multiple threads, thus delivering larger potential speedups without the risks of a slowdown due to the code generator making the execution stall for too long. Thanks to this, the second code generator can provide various modern optimizations, such as trace based generation, instruction scheduling and code vectorization without having a negative impact
3.2. Accelerating Full System Dynamic Binary Translation Target .elf PC BB #7 To code gen TCG Thread 0 (TCG+exec) Thread 1 (llvm) Code cache loosely optimized code generation (fast) Signal LLVM thread Exec BB #7
Basic block queue
BB #7 BB #2 LLVM Heavily optimized code generation (slow) BB #2
Figure 3.2: HQEMU threaded code generation
on runtime. In the end, this work provides moderate to large speedups on a varied set of benchmarks.
Another interesting part of this work is the performance analysis they made. There, they compared both their solution (with multi-threading), QEMUstandard solution and a solution purely based on LLVM[LA04] for high code quality generation. What they show, compared to works from the section 3.2.1, is that a single threaded approach that only relies on generating high quality code can indeed cause slowdowns in quite a few situations. On the other hand, their solution which offloads quality code generation on another thread does not indeed cause any slowdown compared to a single threaded fast code generation only solution.
One important remark to be made is that only the code generation is multi-threaded, target CPU execution is still single threaded. In other words, no matter how many cores the target has, target code execution will happen only on one thread, with the target CPUs sharing this thread’s execution time.
Multi threaded simulation
Another approach of parallelism, in particular in the case where the target has multiple cores, is to parallelise the simulation of target cores. A work which has aimed at doing so is
[DCHC11]. The idea is conceptually fairly straightforward. For each target core, a matching
simulation thread is created. These simulation threads will then be taking care of both code generation and execution on a core per core basis. The resulting execution, compared to a single threaded one is outlined by Figure 3.3. On the left part of the figure, we can see the standard single thread simulation. On one same thread, each CPU is executed alternately.
T ime CPU 1 CPU 2 CPU 3 CPU 4 CPU 1 CPU 2 Single threaded Solution multi threaded Solution
CPU 1 CPU 2 CPU 3 CPU 4 CPU 1 CPU 2
Figure 3.3: Example of a single threaded simulation execution versus a multi-threaded one While one executes, the others wait, this means that, potentially, performance relative to the native target may be divided by NP, where NP is the number of target cores. On the right side, we now have the model where each simulated core executes in its own host thread. The result is that all of those may then run concurrently. As such, for the given example, the multi-threaded execution ends in two units of time (CPU 1 and CPU 2 need two units of time for their respective workload) whereas the single threaded one ends in 6 units of time.
Without much surprise, the real performance gain is fairly high for multi-threaded guest programs. With the author’s benchmark, the average speedup is of 3.8 compared to baseline single threaded QEMUfor a quad core target. All the gain is due to maximizing simulation throughput thanks to simulating every CPU at the same time.
One problem with this work however, as exposed in [RSR16], is that it did not yet support atomic instructions in a target agnostic way. Indeed, atomic instructions are not the same on every architecture. In particular, two different models exist. One is CAS (compare and swap) and the other code is LL/SC (load-link, store conditional). Emulating LL/SC with CAS, such as is the case when emulating ARM targets on Intel hosts, is non-trivial and require helper functions. Helper do have an overhead, yet this solution does outperform upstream QEMU in multi core scenarios.
3.3
Accelerating Memory Accesses Simulation
Finally, we present here works which have been made specifically to solve the problems of accelerating memory accesses simulation, mainly in DBT. Just the software translation of target addresses to host addresses have indeed been known to take 40% of simulation runtime on average. An explanation of why memory accesses are slow to emulate can be seen in section 2.2.3. Furthermore, not only are each memory accesses slow to emulate, but according to [JRHC95] about one instruction over two on a RISC cpu is a memory access. Having this observation in mind, it becomes clear that accelerating the emulation of memory
3.3. Accelerating Memory Accesses Simulation accesses is of utmost importance.
ESPT/HSPT
Two first works, ESPT[CWH+14] and HSPT[WLW+15], have tried to solve the problem of
memory accesses simulation. They have mainly concentrated on embedding shadow page tables in the simulator process. The method is fairly similar between the two, so we will concentrate on the most recent one, HSPT, which relies on Unix mmap. Those two methods are using QEMUas their simulator, and modify it to fit their need. The main idea of the authors there is to have the fast path described in section 2.2.3 be reduced to one host memory access by embedding the target address space into the host one. This is done by reserving a part of the simulator address space and use a mmap syscall to map it on the same address space as the simulator (QEMUhere) view of the guest physical frames. This mapping can then be mapped lazily, as the target tries to access it.
The base process followed to manage this mapping can be seen in Figure 3.4. At the
Embedded target address space
Target Physical frames
Target Physical Memory
(Unix file)
target physical frame target virtual page
Target physical frame (host representation)
Simulator Virtual memory
Layout
Figure 3.4: Memory layout of the simulator in HSPT
physical frames and the embedded target memory mapping. The physical frames are at the position QEMUplaced them, but the embedded target memory mapping was placed by the authors, through the mmap syscall. On the right we see the file representing the target physical memory.
At first the embedded target memory mapping is mapped with the PROT_NONE flag, which means that any access will produce a page fault. Then, when the target tries to make a memory access it is redirected, through an offset, to the embedded mapping. During the first access, this will trigger a host fault, thanks to the PROT_NONE flag. This fault will then be forwarded by Linux to the simulator SIGSEGV handler. In this handler, a walk of the target MMU will be made, the corresponding target physical frame host address will be found, and the mapping will get updated through mmap to make it point to the right portion of the file representing target physical memory.
The embedded mapping then has to remain synchronized with the target mapping. To that aim, the chosen approach of this work is to track TLB flushes. Indeed, just as on a real CPU, the target CPU has to flush its TLB after any change made to its page table. To do so, the authors directly track the triggering of target instruction concerning those flushes, as well as changes to the registers holding pointers to the page table. With this, the part of the mapping which are to be updated can then be made unreadable and unwritable, thus triggering a fault again whenever an access happen. Then during this fault, the entry of the mapping will be filled with the correct mapping using the method we described in the previous paragraph.
This solution, which goes from a fairly simple idea, had to be slightly modified to remain efficient. The authors observed that flushing the whole mapping at every context switch was an important loss of performance, due to the fact that internal faults used to refill the mapping are fairly costly. To avoid this performance loss, the authors choose to retain one mapping per process. Thanks to this, when a context switch happens, the mapping is kept in memory, then when we context switch back to that process, we only have to use its offset in the fast path to access it, and internal faults number should be limited. The main limitation of this approach is that it relies on the presence of a Context Identifier in the target CPU (CID) which is a unique identifier for a given guest process. The second is that it can potentially lead to the use of a very important part of the simulator address space. For the second limitation, an optimization made by the authors is to only use a fixed amount of mappings, and when the number of process exceeds it, to reuse one (usually the least recently used one). The second limitation, which further worsen the previous one, is that the approach was not thought with extending to 64 bits guests in mind. Nowadays Linux on Aarch64 is usually configured to use 42-bit long virtual addresses, or 242bytes of address space. This means that clobbering more than four flat view of the target address space would be near impossible with the usual process layout on modern operating systems. As such, the approach of limiting the amount of saved mapping would most of the time result in sharing one address space for all target processes. Actually, with such an address space size, and with it being bound to get larger, even maintaining a flat view of the target address does not seem practical.
Finally, a few differences with their previous work, ESPT[CWH+14] do exist. In the first
work a Linux Kernel Module was used. However, it was only used as an augmented mmap. Basically, we can say that the module was never really used as a potential performance improvement in and out of itself. Faults were still communicated to the simulator through standard SIGSEGV handler, with all the technical and performance difficulties implied. A confirmation of this observation is that with the module, or with an mmap, the authors obtain roughly the same performances.
3.3. Accelerating Memory Accesses Simulation slower (it still contains a branch instruction). Yet, performance is still the same. This is a sign that the fast path performance in itself is not the only dominating performance factor. Quite probably, the cost of the page faults has an at least as large impact on performances.
This page fault cost should also be much larger nowadays, whether with mmap or a module. Indeed, the totally unrelated topic of OS vulnerability with the recent meltdown [LSG+18]
attack has lead to a change in the way OSes handle system calls and faults. OSes running on top of Intel CPUs now need to have two separate mapping for kernel space and user space [GLS+17]. What this means for us is that syscalls (mmap or custom for ESPT) now
require a context switch in addition to a mode switch whenever they are made. This is bound to have a negative effect on target code which causes many faults, such as IO bound code, or with many protection rights.
HAV based cross ISA full system Virtualisation
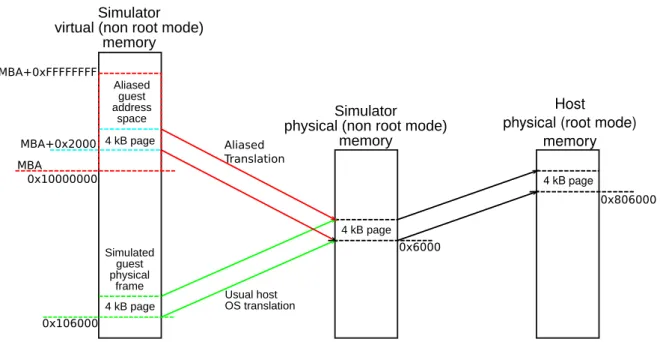
Another method, based on an ad-hoc simulator named CAPTIVE, as described in [SWF16] relies on using hardware assisted virtualisation to provide a platform for cross ISA simulation. The base idea is to isolate target code execution onto a virtual CPU where it can have its own address space, and thus avoid the usual runtime checks on every memory access. An overview of the resulting layout can be seen in Figure 3.5. As can be seen there, the overall
Target memory Area
0x0
0xFFFFFFFF Execution Engine
Virtual CPU Environment
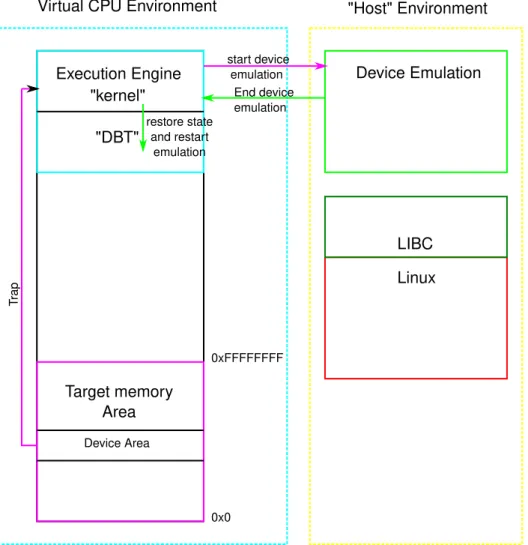
Device Emulation Linux "kernel" "DBT" LIBC "Host" Environment Device Area T rap start device emulation End device emulation restore state and restart emulation
principle is as follows: On the left, we can see the virtual CPU current memory layout. From address 0x0 to 0xFFFFFFFF the address space is reserved for the target address space. Just as in HSTP[WLW+15], this allows to make memory accesses with potentially only one host
instruction. But one limit that immediately comes to mind is the ability to scale to 64 bits targets. Indeed, in such cases, it seems highly complicated to map the target address space in such a way. In that case, the approach would quite likely require supplementary indirections in the code.
On the higher half of the memory layout lies the execution engine, which is an x64 kernel managing the simulation. Its rôle is to manage the overall simulation process. Basically, it contains the needed dynamic binary translator to translate code from the target ISA to the host ISA, plus all the DBT management code. That is, interruption simulation and communication with the host simulator code. On the right side of the figure, we can see the host simulator. Its main rôle is to perform device simulation. Usually, devices will be represented through the use of C code callbacks which emulate device behaviour while keeping a state automaton of the device.
Once again, the base principle is fairly simple, however its implementation is not. What seems like the main difficulty for the authors is to communicate with the out of HAV part of the simulator. Indeed, the authors choose to keep their device emulation thread on the host environment, and not with the execution on the virtual CPU environment. The problem is that one of the main performance costs in the case where HAV is used is to exit from the virtual CPU to the normal host process. According to work from [SFGP15] which implemented similar approach for native simulation, this can cost in average ten thousand cycles. The authors from [SWF16] confirmed the problem and devised another strategy to implement communication with their device thread on the host environment. First, every part of the address space which are device related are filled in the virtual CPU page table so as to trigger a trap in the execution engine (which acts as a kernel here). This is the “device area” part in Figure 3.5. Then, the simulator and the device emulation running on the host
/Device_Ready
Sim_Running /Sim_Running
Device_Ready /Device_Ready
Device_Ready
Figure 3.6: Handshake between simulator thread running on virtual CPU and device emula-tion thread on host.
part of the simulator will basically make a handshake, as described in figure Figure 3.6. The execution engine will interpret the trap as the signal “device_ready”, and order the device emulation to start by entering a barrier. It will then sleep as long as it does not receive the inverse signal from the device emulator. At the same time, the simulator thread on the host part will begin to emulate the device access. Finally, it will signal the execution engine that the device emulation is done, and then enter a barrier itself to sleep until next device emulation is needed. The execution engine will then restore target state and resume generated code execution.
This principle seems fairly efficient for the monocore board simulated in this work. However, [SFGP15] has shown that in the case of multiprocessors, keeping the simulation synchronized leads to important simulation slowdowns. As such, going back to VM exits in
![Figure 2.1: Overview of the DBT process (taken and translated from [Mic14])](https://thumb-eu.123doks.com/thumbv2/123doknet/14590685.730096/13.892.107.764.416.1001/figure-overview-dbt-process-taken-translated-mic.webp)