HAL Id: hal-00615462
https://hal.archives-ouvertes.fr/hal-00615462
Submitted on 19 Aug 2011HAL is a multi-disciplinary open access
archive for the deposit and dissemination of sci-entific research documents, whether they are pub-lished or not. The documents may come from teaching and research institutions in France or abroad, or from public or private research centers.
L’archive ouverte pluridisciplinaire HAL, est destinée au dépôt et à la diffusion de documents scientifiques de niveau recherche, publiés ou non, émanant des établissements d’enseignement et de recherche français ou étrangers, des laboratoires publics ou privés.
Comparison of a systemic modelling of farm
vulnerability and classical methods to appraise flood
damage on agricultural activities
P. Brémond, F. Grelot
To cite this version:
P. Brémond, F. Grelot. Comparison of a systemic modelling of farm vulnerability and classical methods to appraise flood damage on agricultural activities. 11th Biennal Conference of the International Society for Ecological Economics (ISEE) Advancing Sustainability in a Time of Crisis, Aug 2010, Bremen, Germany. 20 p. �hal-00615462�
Comparison of a systemic modelling of farm vulnerability and
classical methods to appraise flood damage on agricultural activities
Pauline Brémond1, Frédéric Grelot
Contributed Paper prepared for the 11th biennal conference of the International Society for Ecological Economics (ISEE)
ADVANCING SUSTAINABILITY IN A TIME OF CRISIS 22 – 25 August 2010
OLDENBURG AND BREMEN, GERMANY
Abstract
In Europe, economic appraisals of flood management projects, generally Cost-Benefit Analysis, become a commonly used decision tool. At the same time, new flood management policies that may have strong impacts on farms, are promoted, i.e. floodplain restoration and vulnerability mitigation. Since damage must be estimated to estimate the benefits in a CBA, flood damage estimation on agricultural areas becomes an issue to tackle.
In this paper, firstly, a review of existing methods to appraise flood damage on agricultural areas shows the gap between qualitative approaches that underline the complexity of flood damage on farm and the simplification made in flood damage appraisal methods. It confirms that the majority only take into account crop loss, simplification that may be irrelevant to appraise new policies. Moreover, modelling assumptions are often implicit and hardly questionable. Secondly, EVA model which has been designed to estimate and monetize damage categories, that were not taken into account before, is presented and assumptions modelling have been described as explicitly as possible. Third, a test bench of EVA model on a farm type is proposed to simulate damage distribution and when possible, to compare the results with existing methods. More than the figures, the interesting part of our work is to point and try to explain differences. Finally, the outlooks concerning the use of the model at a larger scale are discussed.
The main contribution is to open the black boxes that are usually used to appraise flood damage in order to make modelling assumptions more explicit and questionable by experts and decision-makers.
Keywords : : Cost-Benefit Analysis, flood, damage modelling, agriculture,
1 Corresponding author. Tel: +334 67 166 406 E-mail address: pauline.bremond@cemagref.fr
UMR G-EAU, Cemagref 361 RUE J.F. BRETON BP 5095 34196 MONTPELLIER CEDEX 5
1 Introduction
1.1. Flood management and economic valuation
Floods interact with societies in many ways that are partially reflected by the diversity of flood management options. Those options can be attached to three main synthetic strategies: adapt flood hazard to societies (by hydraulic infrastructures such as dykes, dams, channelled rivers, flood retention areas etc.); adapt societies to flood hazard (by regulating presence of stakes on flood prone area, by adapting structurally stakes at risk, by enhancing organisational responses to flood events including alert and reparation); transfer flood consequences on (by insurance, either public or private, or recovery funds).
The first two strategies, which we will refer as “hazard strategy” and “vulnerability strategy”, have direct impact on flood consequences on societies. This may explain why, despite Krutilla (1966) advices that flood management policies should aim at allowing the most efficient use of territories, under the constraint of the flood hazard, this normative goal, whereas sometime repeated in practical literature (US Water Resources Council, 1983), is very often reduced to reducing harmful impact of flood on people, environment and economy (Bouma, et al., 2005).
The question of the “good” aim for flood management policies is not only a subject of differentiation between economists and practitioners. As often mentioned, this reduction may lead to non optimal policies. For policies linked to “hazard strategy”, especially because it is often implicitly assumed that present stakes in flood-prone area are legitimate, they often aimed at reducing damage without changing land occupation, neither anticipating the fact that lowering hazard exposure may surely lead to land use being denser. This may even lead to the consequence that, some years after policy is implemented, potential damage is strengthened in the supposed protected flood-prone area.
Cost-benefit analysis is the most common tool used to appraise flood management policies. Its application depends critically on the economic valuation of benefit expected from those policies. Worldwide, the benefits implied by alteration of flood exposure is based on the so-called “damage avoided” method, other methods such as hedonic prices, contingent valuation, use of direct elicitation vote being more used by researchers (see (Bouma, et al., 2005) or (Shabman and Stephenson, 1996), for a more detailed discussion).
Conceptually, for a given flood event, avoided damage are the monetization of the difference of consequences between the situation with and without implementation of the evaluated flood management policy. Procedurally, they include all the consequences that may be quantified and monetized: avoided cost of reparation of damaged stakes, avoided cost of replacement of destroyed stakes, avoided loss of indirect consequences such as activity disruption (with an attention paid to transfers); integration of intangible consequences (such as psychological effects) being less easy to take into account. Those avoided damage, weighted by the likelihood of the flood event in a year, summed over all possible floods raise to the annual expected damage avoided. The present value of the expected annual benefits, computed at the project discount rate, is the total benefit to the property.
For this proxy being a good indicator of benefit, two important assumptions are made. First, this technique is hypothetical since no post-flood repair choices are observed and that is why we will propose a set of decision rules which depend on farmer profiles. Second, it is assumed that the property owner would make such repairs (Shabman and Stephenson, 1996) and as a consequence that the amount of damage is evaluated by the cost needed to return to the previous (normal) status.
3
1.2. Need to improve flood stage damage functions
Two different uses of Cost-Benefit Analysis can be distinguished. Firstly, Cost Benefit Analysis can be used as a method for identifying a “decision rule” or as a component of a comprehensive policy analysis with an heuristic purpose (Turner, et al., 2007). This first use is often controversial because Cost Benefit Analysis fails in integrating and monetizing all the effects induced by a project. In particular, social and environmental effects are very tough to estimate and monetize (Bouma, et al., 2005) and the lack of understanding of asset vulnerability remains a real issue .
Secondly, the use of CBA as a comprehensive method could be, according to Shabman and Stephenson (1996), used to help decision-participants to appraise what is and is not measuring the assessment process.
But, actually, damage functions are often black boxes and it is quite difficult to know which kinds of damage are taken into account and which assumptions have been made. However, it is true that this method could allow an explicit description of damage categories taken into account and of the assumptions made on damage estimation and monetization. That is what we aim at doing at farm level.
1.3. Why do we focus on agricultural sector?
Some efforts have been carried to develop and improve flood damage evaluation methodology in particular in United Kingdom (Ministry of Agriculture Fisheries and Food, 1999, Penning-Roswell, et al., 2005) or in United States where the US army Corps of
Engineers have been required to evaluate the cost and benefits of all water resource projects since the flood control Act of 1936 (Hanley and Spash, 1993).
In Europe and specifically in UK where economic appraisal was mandatory, projects concerning agriculture have long been drainage or flood protection projects. They aimed at increasing agricultural yield by improving field drainage conditions to help to meet food supply policy objectives (Morris, 1992). These projects had globally positive impacts on agriculture and they could be easily appraised by the increase in revenue due to yield increase. By the 80’s, concern about over-production, burgeoning costs of support, and environmental damage associated with intensive farming, questioned the validity of continuing this predominantly productivist regime in Europe (Posthumus, et al., 2010). At the same time, environmental and sustainable concepts arise in flood management policy due to the failure of classical hard engineered flood protection (dyke failure). It induced a shift towards new paradigms of flood management policies based mainly on a “making place for water” policy (restoring the pre-existing floodplain) and a “living with flood” policy (Johnson, et al., 2007) which both involve adapting assets. Agricultural areas are closely concerned by these policies and some may increase flood impacts on them. First, floodplain restoring generally implies that agricultural land will be more exposed to flooding in order to protect urban areas. Second, living with flood implies that some areas will not be protected but they will get adapted by mitigating their vulnerability. Historically, floodplains have attracted agricultural activities because of their fertile soils and it is generally considered that protection level for agricultural areas is lower than for urban areas. As a consequence, floodplain restoring and living with flood policies means that agricultural areas will be more exposed to flood than before the 80’s. Vulnerability mitigation policy could be associated to these policies to reduce flood damage by enhancing assets capacity to endure and recover after flooding. In the case of agriculture, these measures have few direct effects on crop yield. They mainly consist in enhancing equipment and stock protection or evacuation and recovering after flooding. The effects of vulnerability mitigation measures are not appraisable using a flood damage function expressing crop loss. As effects on farm structure and organization are expected, the flood
damage function used to appraise benefits (avoided damage) should allow us their evaluation which requires a systemic modelling of vulnerability at farm scale.
This background analysis highlights three research questions we will tackle in this article. - Which are the strength and weakness of existing methods to appraise agricultural flood
damage?
- Why a systemic approach would be interesting and which are the damage indicators? - Which are the differences in quantitative monetary terms between the existing methods
and the systemic approach we propose?
2 Review of existing methods to appraise flood damage on agricultural areas
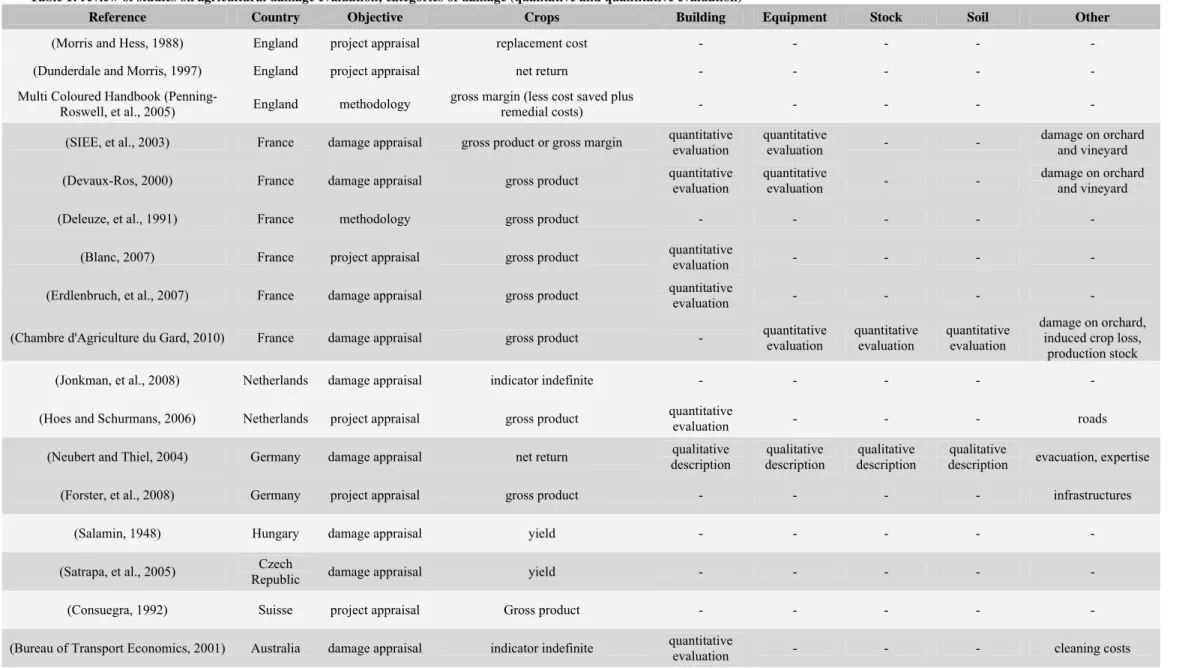
A review of existing methods to estimate damage on agricultural areas was carried out to identify which kind of damage is considered and how it is estimated. Twenty four studies (Table 1) have been identified and analysed.
2.1. Categories of damage and hazard parameters considered
As shown in Table 1, all the methods to appraise agricultural damage, propose a quantitative assessment, more or less precise, of crop damage. But, few take into account other damage categories. Eight among the twenty four studies listed, consider the damage on buildings and even less, consider damage to equipment. Only one study (Chambre d'Agriculture du Gard, 2010) proposes a quantitative assessment of damage to soil and stocks. Cleaning costs, additional production costs or damage to orchards are sometimes mentioned as others flood related damage but they are rarely integrated in applications.
For all categories, two steps are required to appraise flood damage. First, damage must be estimated in quantitative terms in function of hazard parameters and second the quantity of damage must be monetized to get a single unity. The avoided damage method generally relies on the assumption that the cost of damage is the cost needed to return to the normal state.
2.2. Crop damage evaluation
Crop damage can not be assessed by the cost of the action to return to normal state because crop damage is irreversible. First, a loss of production must be estimated thanks to a damage function. Generally, these damage functions rely on expertise and take into account one or several hazard parameters (season, depth, duration). Second, the monetary damage related to crop loss can be expressed using several indicators depending on the way production costs are taken into account and the scale of evaluation. The main indicators used are:
- gross product (yield multiplied by price), - net revenue,
- progressive indicator depending on the season and the production cycle on the crop considered.
Most of the studies use a single indicator which is the most frequently, the gross product. As an example of the effort to improve flood related damage, Lacewell et al (1972) first proposed to assess flood damage on agriculture by the net revenue. This measure did not include production costs. Then, in 2006, they proposed an updated method in which the net return is still used as the basis to estimate benefits but the additional costs due to flood as delayed harvesting, extra field operations have also been taken into account and estimated by enquiries (Lacewell, et al., 2006).
An in-depth characterisation of flood damage on crop has been carried in United Kingdom (Penning-Roswell, et al., 2005) and United States (US Army Corps of Engineers, 1985). The way the production costs should be integrated in crop damage evaluation in function of the production cycle, is accurately described. If these studies have focused on crop damage this is
5 because they mainly aimed at appraising drainage or protection projects that improve field drainage conditions and as a consequence crop yield.
2.3. Non crop damage
Meyer and Messner (2005) in their review of flood damage evaluation methods used in four European countries show that agricultural damage are generally not considered as the main stake for flood damage evaluation and crop damage is often the proxy used for damage evaluation. However, some studies take into account non crop damage. Generally, it consists in damage to buildings and infrastructures evaluation (fences, road…) but damage functions used are often not clearly explained. For instance, in Australia, some studies (Bureau of Transport Economics, 2001, Yeo, 2002) point the fact that besides crop losses, damage to pasture, fences, livestock and cleaning cost can reach a considerable amount of damage.
Among the eight studies which mention damage to buildings, six propose a quantitative assessment but only two of them (Devaux-Ros, 2000, SIEE, et al., 2003) were specifically developed for agricultural buildings.
2.4. Damage propagation on farm activity
No methods that take into account damage propagation after flooding were found; mainly because in these studies, farms are not considered as activities. However, when flood damage on other economic activities are appraised, it is a well known fact that business interruption and limitation can cause a large share of the total amount (Kreibich, et al., 2007)
2.5. Conclusions on existing methods
Some investigations have been carried out on crop damage evaluation because protecting agricultural areas and improve crop yield had long been one of the main goals of flood management projects. To appraise these projects, using crop damage as a simplistic proxy of the total damage on agricultural areas is acceptable. However, when considering projects that have more complex consequences such as vulnerability mitigation, the proxy used to appraise damage of agricultural area must take into account other flood related consequences. But, the review of literature reveals the lack of methods to appraise flood consequences on farm physical components (building, equipment, stock…) and even more to appraise flood consequences on farm activity after flooding.
2.6. Review of existing methods: objectives and damage indicators
Table 1: review of studies on agricultural damage evaluation; categories of damage (qualitative and quantitative evaluation)
Reference Country Objective Crops Building Equipment Stock Soil Other
(Morris and Hess, 1988) England project appraisal replacement cost - - - - - (Dunderdale and Morris, 1997) England project appraisal net return - - - - - Multi Coloured Handbook
(Penning-Roswell, et al., 2005) England methodology gross margin (less cost saved plus remedial costs) - - - - - (SIEE, et al., 2003) France damage appraisal gross product or gross margin quantitative evaluation quantitative evaluation - - damage on orchard and vineyard (Devaux-Ros, 2000) France damage appraisal gross product quantitative evaluation quantitative evaluation - - damage on orchard and vineyard (Deleuze, et al., 1991) France methodology gross product - - - - -
(Blanc, 2007) France project appraisal gross product quantitative evaluation - - - - (Erdlenbruch, et al., 2007) France damage appraisal gross product quantitative evaluation - - - -
(Chambre d'Agriculture du Gard, 2010) France damage appraisal gross product - quantitative evaluation quantitative evaluation quantitative evaluation damage on orchard, induced crop loss, production stock (Jonkman, et al., 2008) Netherlands damage appraisal indicator indefinite - - - - - (Hoes and Schurmans, 2006) Netherlands project appraisal gross product quantitative evaluation - - - roads
(Neubert and Thiel, 2004) Germany damage appraisal net return description qualitative description qualitative description qualitative description qualitative evacuation, expertise (Forster, et al., 2008) Germany project appraisal gross product - - - - infrastructures
(Salamin, 1948) Hungary damage appraisal yield - - - - - (Satrapa, et al., 2005) Republic Czech damage appraisal yield - - - - - (Consuegra, 1992) Suisse project appraisal Gross product - - - - - (Bureau of Transport Economics, 2001) Australia damage appraisal indicator indefinite quantitative evaluation - - - cleaning costs
7
(Goulter and Morgan, 1983) Canada project appraisal gross product - - - - - (Lacewell and Eidman, 1972) USA project appraisal net return - - - - -
(Lacewell, et al., 2006) USA project appraisal net return plus additional production costs - - - - additional production costs (US Army Corps of Engineers, 1985) USA Methodology progressive indicator (gross product until net return) - - - - -
(McDonald, 1970) USA project appraisal gross product - - - - - (Dutta, et al., 2003) Japan damage appraisal gross product description qualitative description qualitative - - - (Ministry of Construction, 2005) Japan methodology indicator indefinite - - - - -
3 Framework of flood damage evaluation with a systemic approach
3.1. Conceptual model
To appraise flood damage on agricultural areas, we first developed a conceptual model of farm vulnerability and resilience to flood (for more detail concerning model description see (Bremond, et al., 2010)). It aims at taking into account on the one hand, direct damage due to flooding on farm physical components which depends on farm vulnerability and on the other hand, damage propagation during recovery after flooding which is conditional on farm resilience. Thereafter, the term “vulnerability evaluation” includes vulnerability and resilience evaluation. To conceptualize farm vulnerability, the farm is considered as a system composed of four dimensions (Figure 1).
Figure 1: Farm dimensions integrated in our modelling
The physical dimension represents the structure of the farm as a collection of physical components (plots, production, buildings, equipment…). The organizational dimension of the farm is linked to the tasks that must be done at farm level (production and recovery).
The modelling of decision making is based on interviews with farmers and experts so that post flooding recovery can be analysed and modelled. Lastly, the financial dimension is represented by cash flow and determines whether the farm own resources are sufficient to remain solvent.
Alert Flood Recession Flood temporality
End Production cycle
Beginning n production cycles
Standard mgmt
Flood management
(accessibility constraints)
Short term post flood management
(production factors availability constraints)
Mid and long term post flood management (structural modifications) Standard mgmt Crisis mgmt Farm temporality Management temporality
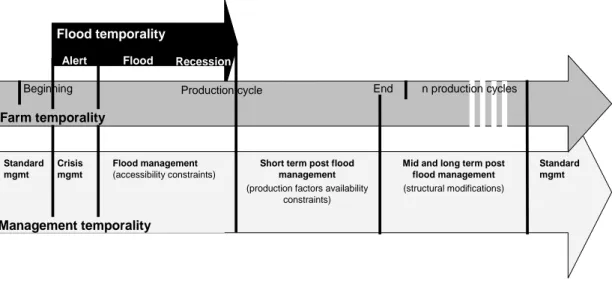
Figure 2: temporal representation of farm vulnerability
The conceptual model of farm vulnerability also enables us to take into account damage propagation on farm after flooding. Figure 2 shows that three temporalities are in interaction during the phenomenon: the farm one, the flood one and the crisis management one. Farm temporality is related to crop management sequence and work organization. Flood temporality
9 determines the degree of damage endured by the physical components depending on the moment the flood occurs, the depth of water, the speed, and duration of the flood. The temporality of the post flood management results from the crossing between flood temporality and farm recovery evolution and depends on management decisions the farmer take after flooding.
Based upon this conceptual model, we designed a methodology to appraise flood damage on farms by estimating direct damage (section 3.2) and damage propagation or induced damage after flooding (section3.3). The consequences of farmer’s decision-making are also taken into account by identifying different recovery strategies in function of farmer’s profile and associating economic and financial cost to them.
3.2. Estimation of damage on physical components (cost of return to a normal status)
Figure 3: estimation of direct damage on farm physical components
We collected and built damage functions for each physical component of the farm based upon literature and interviews. Due to the lack of data based on feedback experience, most of the damage functions collected rely on expertise. Seventeen local experts specialised in several crop production were interviewed.
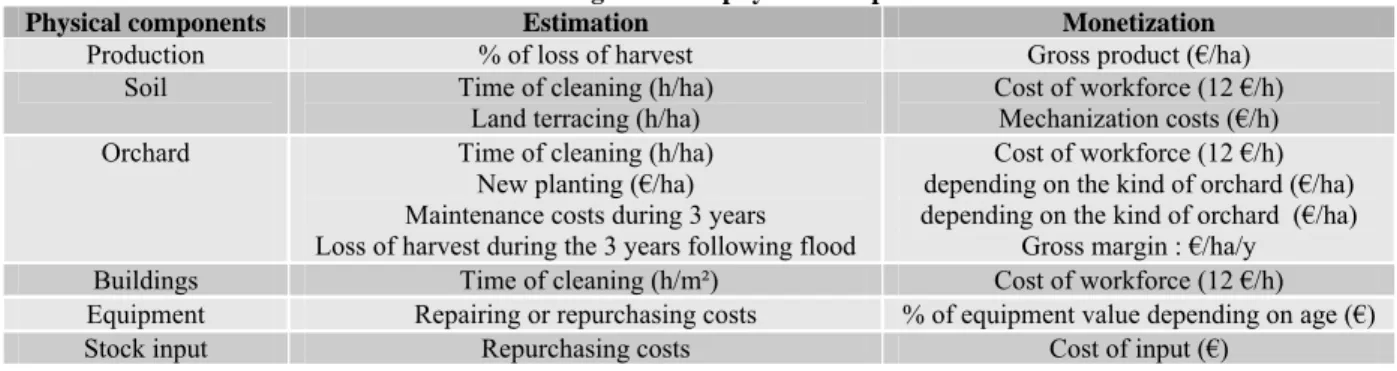
These damage functions enabled us to estimated direct damage associated to several flood scenarios for each farm physical components (Figure 3). The assumptions made for estimation and monetization are specified for each component in the Table 2. According to the avoided damage method, the cost of direct damage is estimated by the cost to return to a normal status, except for the crop which is destroyed.
Table 2: estimation and monetization of damage on farm physical components
Physical components Estimation Monetization
Production % of loss of harvest Gross product (€/ha)
Soil Time of cleaning (h/ha)
Land terracing (h/ha)
Cost of workforce (12 €/h) Mechanization costs (€/h)
Orchard Time of cleaning (h/ha)
New planting (€/ha) Maintenance costs during 3 years Loss of harvest during the 3 years following flood
Cost of workforce (12 €/h) depending on the kind of orchard (€/ha) depending on the kind of orchard (€/ha)
Gross margin : €/ha/y
Buildings Time of cleaning (h/m²) Cost of workforce (12 €/h)
Equipment Repairing or repurchasing costs % of equipment value depending on age (€)
Stock input Repurchasing costs Cost of input (€)
3.3. Estimation of induced damage (cost of alternatives required after flooding because of physical component damage)
After flooding, several constraints can disturb farm functioning (Table 3) and may lead to economic or financial damage. The economic damage is defined as the cost of the option for the society when the financial cost is farmer oriented and represents the cost of the option for him.
The first constraint, “plot inaccessibility” depends on flood scenario and drainage capacity of the plot. No alternative are possible and the consequence is a loss of yield if some production tasks can not be done.
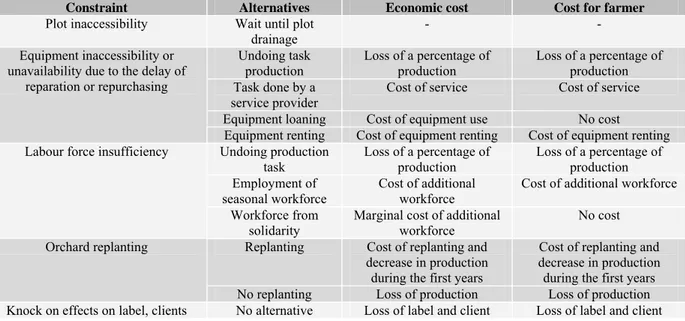
Moreover, in addition to production tasks on crops, farmers have to deal with recovery tasks (cleaning, repairing…). The recovery tasks must be done to make each component regaining their normal state. They have two main consequences on farm functioning. Firstly, until some tasks are not done, the farm can not function as in the standard situation. For instance, until the equipment remains damaged or destroyed, it is unavailable to carry on production tasks. Secondly, recovery tasks such as plot and building cleaning, require labour force and may involve an insufficiency of labour force available on farm to face recovery and production tasks. For each of these constraints several alternatives are possible and their economic and financial costs have been estimated. Therefore, the economic cost of an option is considered as an induced damage and can be taken into account in CBA.
Table 3 : induced damage for the society (economic cost) and for the farmer (financial cost) associated to alternatives defined to face constraints to farm functioning after flooding
Constraint Alternatives Economic cost Cost for farmer
Plot inaccessibility Wait until plot
drainage - - Undoing task production Loss of a percentage of production Loss of a percentage of production Task done by a service provider
Cost of service Cost of service
Equipment loaning Cost of equipment use No cost
Equipment inaccessibility or unavailability due to the delay of
reparation or repurchasing
Equipment renting Cost of equipment renting Cost of equipment renting
Undoing production task Loss of a percentage of production Loss of a percentage of production Employment of seasonal workforce Cost of additional workforce
Cost of additional workforce Labour force insufficiency
Workforce from
solidarity Marginal cost of additional workforce No cost
Replanting Cost of replanting and
decrease in production during the first years
Cost of replanting and decrease in production during the first years Orchard replanting
No replanting Loss of production Loss of production
Knock on effects on label, clients No alternative Loss of label and client Loss of label and client
3.4. Farmer’s decisions between alternatives and associated damage
To choose between the alternatives proposed in Table 3, farmer decision has to be explained. Fifteen farmers were interviewed on the studied area, in order to identify which management decisions after flooding were taken and their determinants. The enquiries revealed that farmer strategy mainly depends on resources available for recovery.
At farm scale, capital types that influence recovery strategy can be defined. Physical capital corresponds to the farm physical components, namely plots, orchard, production, building, equipment and stocks. Financial capital corresponds to all financial resources available to finance farm’s activity (production and recovery). They can be endogenous (farm and personal savings) or exogenous (loan, subsidises, compensation). Human capital is associated with workforce resource and with the learning level and experience of farmers. The awareness and the flood risk experience an important factor in human capital but it is not yet
11 integrated in our modelling. Finally, social capital represents the social network and the opportunities resulting from this in terms of labour force and equipment opportunity.
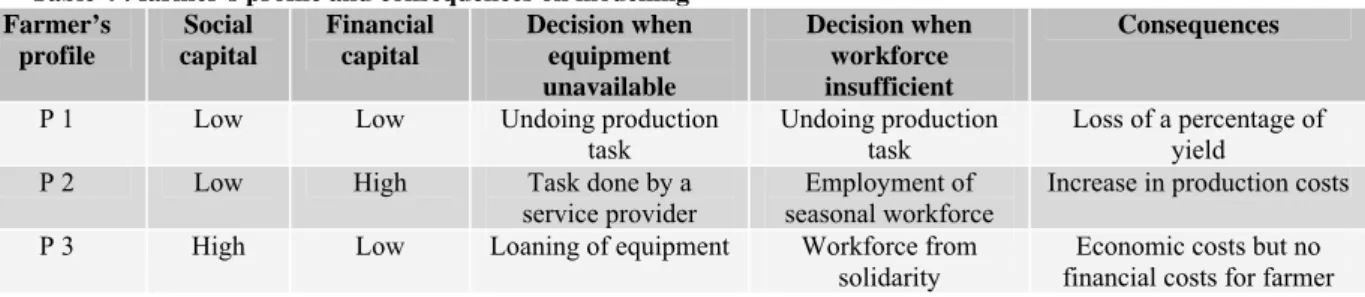
Just after flooding, as already explained, physical capital is damaged. Activities at farm scale (recovery and production tasks) require human (workforce), physical (equipment) and financial (reparation cost) capitals. Financial capital has a specific status since it is substitutable to physical capital and partly to human capital. For instance, a farmer can rent equipment or employ more labour force by paying it. Nevertheless, our enquiries revealed that social capital was also frequently used as a substitute for human and physical capital. Actually, some farmers have benefited from solidarity resulting in labour force and equipment lending. When neither financial nor social capital is available, the farmer can not keep on activities. Based upon this analysis and on the enquiries we carried out, we defined three farmer’s profiles (Table 4) and their associated strategies to recover after flooding.
Table 4 : farmer’s profile and consequences on modelling Farmer’s profile Social capital Financial capital Decision when equipment unavailable Decision when workforce insufficient Consequences
P 1 Low Low Undoing production
task
Undoing production task
Loss of a percentage of yield
P 2 Low High Task done by a
service provider
Employment of seasonal workforce
Increase in production costs
P 3 High Low Loaning of equipment Workforce from
solidarity
Economic costs but no financial costs for farmer
To simplify the results, the farmer’s profile use to simulate results in the case study is the profile 2. Then, we assume that in case of equipment unavailability, the tasks will be done by a service provider and in case of workforce insufficiency, seasonal workforce will be employed.
4 Implementation of the systemic model in a case study and comparison with classical methods
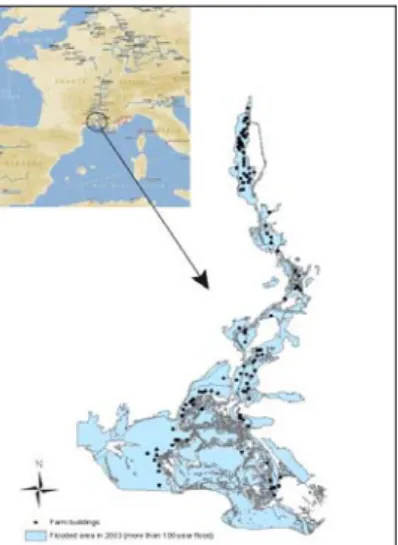
4.1. Study site
Our study site is located on the Rhône River downstream as shown on the Figure 4. Three thousand farms have been identified as potentially exposed to flood. On this area, agriculture is an important activity and the productions are diversified. They can be grouped in five categories which are arboriculture, market gardening, viticulture, cereals, grassland and livestock. Farms specialized in arboriculture are the most represented in numbers on the studied area (Figure 5). Within this category, small familial farms are supposed to have smaller financing capacities and as a consequence should be the first that benefit from the subsidies to implement efficient measures to mitigate their vulnerability to flooding. We chose this type of farm as an implementation test bench to simulate flood damage with our model and compare them to exiting methods. The name EVA (Evaluation of Agricultural Vulnerability) is used to make reference to our model in the following sections.
Figure 4: study site and flooded area during the flood of the Rhone River in 2003
Figure 5: reparation of the number of farms by categories of production
4.2. Presentation of the farm type: familial structure specialized in arboriculture
According to French national data on farm structure (2000), in the five departments of our study zone, 4300 farms can be related to the group of arboriculture production. These farms were split in two groups (less than 15 hectares and more than 15 hectares). As specified above, we focused on small farms. Table 5 presents the characteristics of the farm type used from damage simulation.
Table 5: characteristics of the farm type specialized in arboriculture with an area of less than 15 ha Type of production Average area (ha) Average workforce (men/farm) Average yield (kg/ha) Average price (€/kg) Gross product (€/ha) Costs of production (€ /ha) Gross margin (€/ha) Apple (Royal Gala) 8 2 43000 0.5 20300 12600 7700
Sources: RGA 2000 and “technical and economic references of arboriculture in Vaucluse” (CA84, 2005)
A crop management sequence has to be defined to estimate induced effects and we focused on an apple production (Royal gala) which is the most spread production in this area.
4.3. Flood scenario tested
Flood scenarios have been defined to test the systemic model of flood damage (EVA). Three occurrence periods of the flood have been set based on hydrological data on Rhône River. The whole farm is assumed to be flooded and the depth of water varies by stage between 0 and more than one meter. The flood is assumed, for this simulation, to last seven days and to have medium flow speed, based on the feedback experience of local experts. The parameters of the flood scenarios used the simulation presented in this paper, are presented in the Table 6.
13 Table 6 : Flood scenario parameters
Scenario parameters Chosen levels
Period of occurrence May, September, December
% SAU flooded 100
Height of flooding on land plot and buildings ]0,20] ;[20,50[ ;[50,100[ ;[100,∞[
Duration 10 days
Speed Medium
4.4. Comparison of crop damage
Few damage evaluation methods propose damage function for arboriculture. Most of damage functions concern cereals (Deleuze, et al., 1991, Salamin, 1948, Satrapa, et al., 2005) or livestock and grazing (Morris and Hess, 1988). Some methods do not even take into account the crop type (Forster, et al., 2008, Goulter and Morgan, 1983, Jonkman, et al., 2008). As a consequence, we compared the result of our simulation with another French study carried out on Rhône River (SIEE, et al., 2003).
In EVA method, the crop damage was appraised by the gross product because for the three occurrence periods tested, either there is no crop loss because apples orchard have already been harvested (September, December), or when the crop loss occur, all the production expenses have already been incurred (May). To estimate the crop loss in function of flood parameters crop damage function was adapted from a recent study developed by technical experts (Chambre d'Agriculture du Gard, 2010).
Some damage evaluation methods consider harvest costs should be subtracted to gross product (Penning-Roswell, et al., 2005, SIEE, et al., 2003). However, feedback experience gathered during interviews with farmers on Rhône River reveal that product must be harvested even if they have been flooded to avoid pest and disease development the year after flooding.
Comparision of crop damage in EGR and EVA studies
0 5 10 15 20 25 0 50 150 0 50 150 0 50 150 0 50 150 0 50 150 0 50 150 15 25 15 25 15 25
december may september
1
Flood parameters
Da
mage (
k€/ha)
Figure 6: Crop damage comparison
The Figure 6 compares the crop damage simulations obtained with the crop damage function with used in our model (EVA model) and the method used in EGR study (SIEE, et al., 2003), on three occurrence periods chosen and in function of the depth of water. The same
Crop damage simulated (EVA model) Crop damage simulated (EGR method)
cm
value of the gross product was used for the comparison (20 300€/ha). The crop damage can vary between 0 and more than 20 k€ per hectare. For a flood in September, EGR method simulations estimate a loss of harvest whereas EVA method does not. This can be explained by the assumption made on the harvesting period which has been set on August with local experts.
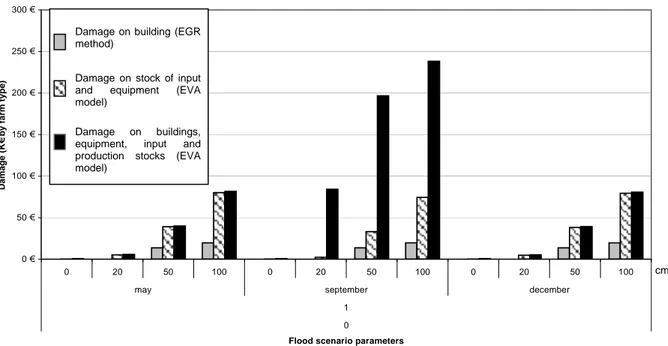
4.5. Comparison of damage on building, equipment and stocks 4.5.1. Damage to buildings
Most of the methods that take into account damage to buildings, also implicitly comprise damage to equipment and stocks without giving precisions on damage estimation and monetization (Devaux-Ros, 2000, Hoes and Schurmans, 2006, SIEE, 2005). Some methods also consider agricultural buildings as domestic one (Blanc, 2007, Erdlenbruch, et al., 2007). In our modelling framework, we distinguished damage to each physical component of the farm, in particular, buildings, equipment and stocks. Then, direct damage was estimated by the cost required to return to a normal state. For the farm type, first, the damage on equipment was estimated based on data from the study carried by local experts (Chambre d'Agriculture du Gard, 2010) which gave us the list of equipment (type and age), the damage function and the value. Second, we estimated the damage on stocks of input and product by defining stock flows on farm and damage functions with local agricultural experts. Simulations of damage on building resulting from EVA model were compared with damage simulated by EGR method (SIEE, et al., 2003). EGR method does not specify clearly which kind of damage includes the cost of damage on building. However, it is at least supposed to take into account damage to equipment. The damage is proposed to be evaluated by unitary cost per agricultural buildings whatever is the production type.
Comparision of damage on farm building in EGR method and EVA model
0 € 50 € 100 € 150 € 200 € 250 € 300 € 0 20 50 100 0 20 50 100 0 20 50 100
may september december
1 0
Flood scenario parameters
Damage (K€ by f a rm ty p e )
Figure 7: comparison of flood damage on agricultural buildings (EGR method and EVA model)
Figure 7 shows damage on building estimated by EVA model is clearly higher than the one simulated by EGR method.
These results must be interpreted with caution because they all rely on expertise and they refer to different levels of evaluation. EGR method has a meso scale approach (Rhône river downstream area) when the simulations using EVA model is applied at a farm type.
cm Damage on stock of input
and equipment (EVA model)
Damage on building (EGR method)
Damage on buildings, equipment, input and production stocks (EVA model)
15 However, these results suggest some discussions. First, the farm type chosen for the simulation is specialised in arboriculture but EGR method estimation do not take this particularity into account to estimate flood damage on buildings and uses an average damage. However, another study carried out on Loire River (Devaux-Ros, 2000) specifies that among agricultural buildings, those from farms specialised in arboriculture incur the higher damage.
Second, using EVA model, damage on building was simulated on the farm type, taking into account building, stock of input and equipment. Then, , in a second simulation, another farm component was added, i.e. the stock of product. The damage on stock of product can make damage to buildings increasing in more than 100%. Even if the amount of damage can not be presented as validated, these results highlight the lack in damage estimation and point the need to clarify damage functions usually used in economic appraisal.
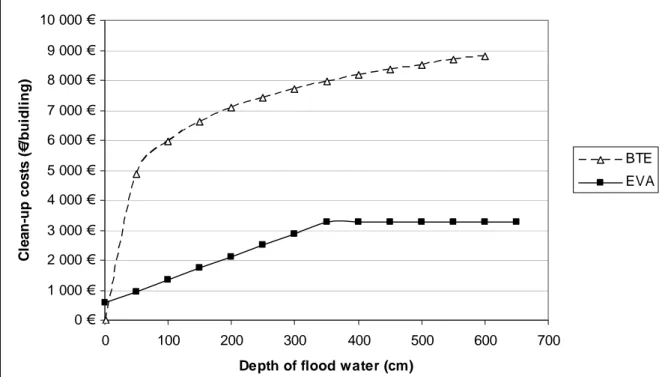
4.5.2. Clean-up cost on building
Flood damage on building was estimated by the clean-up cost and it was assumed no damage to building structure. Studies that take into account damage to building often refer to domestic buildings. Even if some of the reviewed methods recommend to take into account clean up costs (Bureau of Transport Economics, 2001, Neubert and Thiel, 2004, Penning-Roswell, et al., 2005), we found no damage function giving clean-up time specifically designed for agricultural buildings. However, in Figure 8, clean-up cost simulated with EVA method and an estimation of clean up cost applied to household proposed by the Bureau of Transport Economics of Australia (Bureau of Transport Economics, 2001), are compared.
In the Australian methodological guide the time of clean-up cost is expressed in person-day per house. The same workforce cost (12€/h) for the two simulations was set.
The time of clean-up cost in EVA method has been defined based on interviews and feedback experience of farmers.
0 € 1 000 € 2 000 € 3 000 € 4 000 € 5 000 € 6 000 € 7 000 € 8 000 € 9 000 € 10 000 € 0 100 200 300 400 500 600 700
Depth of flood water (cm)
C le a n-up c os ts ( € /bui dl ing) BTE EVA
Figure 8: Comparison of clean-up costs (BTE estimation / EVA model)
The clean up costs simulated with EVA method are clearly lower than those estimated by the Bureau of Transport Economics. As the damage function used in EVA method is based on feedback experience and interviews, these results highlight the need to gather more feedback from farmers and local experts in order to tend to more reliability.
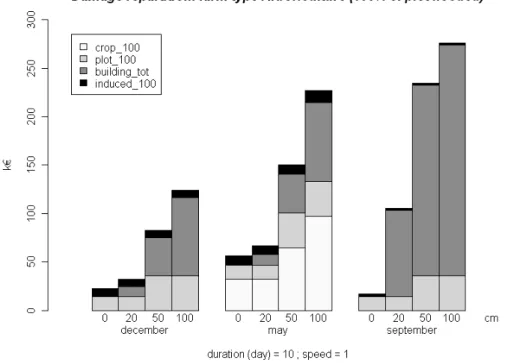
4.6. Damage distribution for some flood scenarios applying EVA method to the farm type2
Figure 9: damage distribution with EVA model (plantation damage included)
The first striking result confirmed by Figure 9 is that considering crop loss only is clearly not representative of the damage incurred at farm scale. Crop losses are only significantly high in May and there are no crop losses in December and September.
Second, we can also observe that not only crop damage is seasonal but also damage on buildings resulting from flow variation in input and product stocks.
Figure 10: damage distribution with EVA model (plantation damage excluded)
2 In the following charts, crop damage is represented in white. “Plot_100” includes damage on soil and orchard (light grey). “Building_tot” includes damage on building, equipment, input and product stocks (dark grey). Finally, induced damage due to workforce or equipment unavailability are represented in black.
17 Third, considering Figure 9, induced damage resulting from lack of workforce or equipment appears proportionally very low. However, an in-depth focus on damage resulting from small flooding (less than 50 cm) in December reveals that a lack of workforce occurs on farm and the resulting damage estimated in terms of workforce employment can represent until 20 % of the total amount of damage for small flooding. These results corroborate the feedback collected with farmers and can be explained by the fact that pruning must be done before the end of February and require a large part of available workforce. As a consequence, when recovery tasks are added to the farm planning, it overpasses the availability threshold.
5 Discussion and conclusions
In this paper, a methodology to appraise flood damage on farms, named EVA model, is proposed. Based upon a conceptual modelling, this methodology takes into account damage on farm components and organisation, by considering the temporal dimension of damage propagation. The main contribution is to open the black boxes that are usually used to appraise flood damage and to make the modelling assumptions more explicit and questionable by experts and decision-makers.
The review of existing methods to appraise damage on agricultural areas points a gap between qualitative studies that insist on the complexity of flood damage on farms (Pivot and Martin, 2002, Posthumus, et al., 2009) and the simplification often made in flood damage estimation. Moreover, it raises issues on underlying assumptions of these estimations.
The methodology designed enabled us to estimate and monetize damage categories that were not taken into account before. On the one hand, direct damage on farm components including crop, soil, orchard, buildings, equipment and stocks were estimated and monetized when existing methods often focus on crop damage only. On the other hand, induced damage on farm functioning that is not considered in exiting methods, was estimated by the cost of an alternative that is implemented to keep on the activity and which depends on farmer’s resource.
Finally, a test bench of EVA model on a farm type is proposed to simulate damage distribution and when it was possible, to compare the results with existing methods. More than the figures, the interesting part of our work is to point and try to explain differences. This analysis reveals the variability of damage resulting from some modelling assumptions and corroborates the need to make more explicit the assumptions and damage functions in the of cost-benefit analysis process in order to help decision making.
Even if figures must be considered with caution due to uncertainty on data, the test bench on a farm type exemplifies and points some interesting problems in damage evaluation.
First, they corroborates qualitative results of some authors (Pivot and Martin, 2002, Posthumus, et al., 2009) that flood effects on farm are more complex than crop loss estimation. We clearly showed that damage on other farm components can represent a large share of the total damage.
Second, even if few comparisons could be done because of the lack of data and figures must be consider with caution, this paper proves that modelling assumptions can make the amount of damage varying in huge proportions. Moreover, some assumptions, such as the date of harvesting for crop loss estimation, imply thresholds in damage estimation whereas this date can vary depending on the crop variety and the climate of the year.
Third, considering the total damage simulated on a farm type, induced damage after flooding due to lack of workforce or equipment appeared low. A first reaction could be to propose to neglect this damage to make easier the application of the model in large scale evaluations. However, the damage simulations on the farm type with EVA model demonstrate that for high probability – low impact flooding, the share of induced damage specifically due
to workforce unavailability can be high and this point can be particularly relevant to consider for project appraisal. Actually, some flood management such as floodplain restoration have few impacts on low probability flooding but increase the probability of low impact flooding. In this case, induced damage may have significant weight in project appraisal.
The EVA model is still under construction and the next step will be an application to a regional area. Serious caveats must be addressed to a future larger application of EVA model and bear out the need to further research. First, the damage functions and monetization assumptions were built based upon interviews and expertise gathering. These parameters are not expected to be set and must be adjusted in function of the scale and the area of application. Moreover, at this point of the approach, an estimation of uncertainty on the results appears crucial. To do so, a sensitivity analysis could be carried out. The first step would be to identify with experts confidence intervals concerning damage functions and then to analyse thanks to the sensitivity analysis which variables explain the uncertainty. For instance, among the numerous assumptions, we saw that the harvesting date is crucial to estimate crop loss and can vary in function of crop variety and climatic conditions.
Acknowledgements:
We acknowledge financial support from both the Plan Rhône program, funded by FEDER and the French Ministry of Environment's (MEEDDM), and the "Risque Décision Territoire" research program, funded by the MEEDDM (PUCA department).
19 References
Blanc, C. "Analyse coût-bénéfice des aménagements pour lutter contre les inondations : Application au cas de la Touloubre aval ". Cemagref.
Bouma, J. J., D. François, and P. Troch. "Risk assessment and water management." Environmental
Modelling & Software 20, no. 2(2005): 141-151.
Bremond, P., F. Grelot, and G. Abrami (2010) Modelling farm vulnerability to flooding at farm level: a systemic approach, Cemagref.
Bureau of Transport Economics. Economic costs of natural disasters in Australia. Edited by P. Printers. Canberra, Australia,, 2001.
Chambre d'Agriculture du Gard. "Etude des Enjeux Agricoles Plaine de Bellegarde/Fourques et Couloir de Saint-Gilles dans le cadre de l’étude de renforcement de la digue du Rhône rive droite entre Beaucaire et Fourques." Symadrem.
Consuegra, D. Z. "Concept de gestion des eaux de surface : aspects méthodologiques et application au bassin versant de la Broye en Suisse." Ecole Polytechnique fédérale de Lausanne, 1992. Deleuze, C., et al. "Evaluation de fonctions de coûts économiques des dommages aux cultures dus aux
inondations." ENGREF.
Devaux-Ros, C. "Evaluation des enjeux et des dommages potentiels liés aux inondations en Loire moyenne : Méthodes et principaux résultats." Equipe Plurisdisciplinaire "Plan Loire Grandeur Nature".
Dunderdale, J. A. L., and J. Morris. "Agricultural Impacts of River Maintenance Activities: A Method of Assessment." Journal of Agricultural Engineering Research 68, no. 4(1997): 317-327. Dutta, D., S. Herath, and K. Musiake. "A mathematical model for flood loss estimation." Journal of
Hydrology 277, no. 1-2(2003): 24-49.
Erdlenbruch, K., et al. "Etude socio-économique des inondations sur le bassin versant de l’Orb." Conseil général de l'Hérault (Pôle environnement, eau, cadre de vie et aménagement rural) Forster, S., et al. "Assessing flood risk for a rural detention area." Natural Hazards and Earth System
Sciences 8(2008): 311-322.
Goulter, I. C., and D. R. Morgan. "Analyzing Alternative Flood Damage reduction Measures on Small Watersheds Using Multiple return Period Floods." Water Resources research 19, no. 6(1983): 1376-1382.
Hanley, N., and C. L. Spash. Cost - benefit analysis and the environnement. Northampton: Edward Elgar, 1993.
Hoes, O., and W. Schurmans. "Flood standards or risk analyses for polder management in the Netherlands." Irrigation and Drainage 55, no. S1(2006): S113-S119.
Johnson, C., E. Penning-Rowsell, and S. Tapsell. "Aspiration and reality: flood policy, economic damages and the appraisal process." Area 39, no. 2(2007): 214-223.
Jonkman, S. N., et al. "Integrated hydrodynamic and economic modelling of flood damage in the Netherlands." Ecological Economics 66, no. 1(2008): 77-90.
Kreibich, H., et al. "Flood precaution of companies and their ability to cope with the flood in August 2002 in Saxony, Germany." Water Resources Research 43(2007).
Krutilla, J. V. "An economic approach to coping with flood damage." Water Resources Research 2, no. 2(1966): 183-190.
Lacewell, R. D., and V. R. Eidman. "A General Model for Evaluating Agricultural Flood Plains."
American Journal of Agricultural Economics 54, no. 1(1972): 92-101.
Lacewell, R. D., et al. "Update of estimated agricultural benefits attributable to drainage and flood control in Willacy County, Texas ". Texas Water Resources Institute.
McDonald, G. T. "Agricultural Flood Damage Assessment: A Review and Investigation of a Simulation Method " Review of Marketing and Agricultural Economics 38, no. 03(1970): 105-120
Meyer, V., and F. Messner. "National flood damage evaluation methods : A review of applied methods in England, the Netherlands, the Czech republic and Germany." UFZ Department of economics.
Ministry of Agriculture Fisheries and Food. "Flood and coastal defence project - Appraisal guidance." Flood and coastal defence with emergencies division.
Ministry of Construction. "Manual on flood economy assessment."
Morris, J. "Agricultural land drainage, land use change and economic performance; experience in the UK." Land Use Policy 185-198(1992).
Morris, J., and T. M. Hess. "Agricultural flood alleviation benefit assessment: a case study." Journal
of Agricultural Economics 39, no. 3(1988): 402-412.
Neubert, G., and R. Thiel (2004) Schadenpotentiale in der Landwirtschaft, ed. A. Bronstert. Postdam, Universität Potsdam, pp. 117-140.
Penning-Roswell, E., et al. The benefits of flood and coastal risk management: a handbook of
assessment techniques. Multi Coloured Handbook: Middlesex University Press, 2005.
Pivot, J.-M., and P. Martin. "Farms adaptation to changes in flood risk: a management approach."
Journal of Hydrology 267, no. 1-2(2002): 12-25.
Posthumus, H., et al. "Impacts of the summer 2007 floods on agriculture in England." Journal of
Flood Risk Management 2, no. 3(2009): 182-189.
Posthumus, H., et al. "A framework for the assessment of ecosystem goods and services; a case study on lowland floodplains in England." Ecological Economics In Press, Corrected Proof(2010). Salamin, P. "Les recherches hydrologiques en Hongrie." Revue générale de l'hydraulique 44(1948). Satrapa, L., P. Fosumpaur, and M. Horsky (2005) Methods of flood damage evaluation, ed. V. Meyer,
and F. Messner. UFZ Leipzig.
Shabman, L., and K. Stephenson. "Searching for the Correct Benefit Estimate: Empirical Evidence for an Alternative Perspective." Land Economics 72, no. 4(1996): 433-449.
SIEE. "Inondations du Rhône et de ses principaux affluents de Décembre 2003 en aval de Viviers dans les départements de la Drôme, de l'Ardèche, du Gard, du Vaucluse et des Bouches du Rhône." DIREN de bassin / DIREN Languedoc Roussillon.
SIEE, et al. "Etude globale pour une stratégie de réduction des risques dus aux crues du Rhône - Rapport d'étape n°3 : Identification des enjeux exposés aux crues et définition et analyse des casiers stratégiques." EPTB Territoire Rhône.
Turner, R. K., et al. "A cost-benefit appraisal of coastal managed realignment policy." Global
Environmental Change 17, no. 3-4(2007): 397-407.
US Army Corps of Engineers. "AGDAM (Agricultural Flood Damage Analysis) - Users Manual." Yeo, S. W. "Flooding in Australia: A Review of Events in 1998 " Natural Hazards 25, no. 2(2002):