HAL Id: inria-00471251
https://hal.inria.fr/inria-00471251v2
Submitted on 13 Apr 2010
HAL is a multi-disciplinary open access
archive for the deposit and dissemination of
sci-entific research documents, whether they are
pub-lished or not. The documents may come from
teaching and research institutions in France or
L’archive ouverte pluridisciplinaire HAL, est
destinée au dépôt et à la diffusion de documents
scientifiques de niveau recherche, publiés ou non,
émanant des établissements d’enseignement et de
recherche français ou étrangers, des laboratoires
BBOB 2009: Comparison Tables of All Algorithms on
All Noiseless Functions
Anne Auger, Steffen Finck, Nikolaus Hansen, Raymond Ros
To cite this version:
Anne Auger, Steffen Finck, Nikolaus Hansen, Raymond Ros. BBOB 2009: Comparison Tables of All
Algorithms on All Noiseless Functions. [Technical Report] RT-0383, INRIA. 2010. �inria-00471251v2�
a p p o r t
t e c h n i q u e
S N 0 2 4 9 -0 8 0 3 IS R N IN R IA /R T --0 3 8 3 --F R + E N GDomaine 1
BBOB 2009: Comparison Tables of All Algorithms
on All Noiseless Functions
Anne Auger — Steffen Finck — Nikolaus Hansen — Raymond Ros
N° 0383
Centre de recherche INRIA Saclay – Île-de-France
Parc Orsay Université
4, rue Jacques Monod, 91893 ORSAY Cedex
BBOB 2009: Comparison Tables of All
Algorithms on All Noiseless Functions
Anne Auger , Steffen Finck , Nikolaus Hansen , Raymond Ros
Domaine : Math´ematiques appliqu´ees, calcul et simulation
´
Equipe-Projet TAO
Rapport technique n° 0383 — April 2010 —
153
pages
Abstract: This document presents the results from the BBOB Black-Box
Op-timization Benchmarking workshop of the GECCO Genetic and Evolutionary
Computation Conference 2009 in tables. Each table presents the performance
of each algorithm submitted to BBOB 2009 on one function and dimension from
the noiseless testbed.
Key-words: continuous optimization, benchmarking
Anne Auger, Nikolaus Hansen and Raymond Ros are affiliated to the TAO team-project, INRIA Saclay – Ile-de-France, Universit´e Paris Sud, LRI, F-91405 Orsay Cedex, France.
Steffen Finck is affiliated to the Research Center PPE, University of Applied Science Vorarlberg, Hochschulstrasse 1, 6850 Dornbirn, Austria.
BBOB 2009: Tables de comparaison de tous les
algorithmes sur toutes les fonctions non-bruit´
ees
R´
esum´
e : Ce document pr´esente les r´esultats sous forme de table du
work-shop Black-Box Optimization Benchmarking (BBOB) de la conf´erence Genetic
and Evolutionary Computation Conference (GECCO), Montr´eal Canada, 2009.
Chaque table pr´esente les performances des algorithmes soumis `a BBOB 2009
pour un probl`eme de la suite de fonctions tests.
BBOB 2009: Comparison Tables of All Algorithms on All Noiseless Functions3
This document provides tabular results of the workshop for Black-Box
Op-timization Benchmarking (BBOB) at GECCO 2009
1. Thirty-one algorithms
have been tested on 24 benchmark functions in dimensions between 2 and 40.
A description of the used objective functions can be found in [
14
,
9
]. The
ex-perimental set-up is described in [
13
].
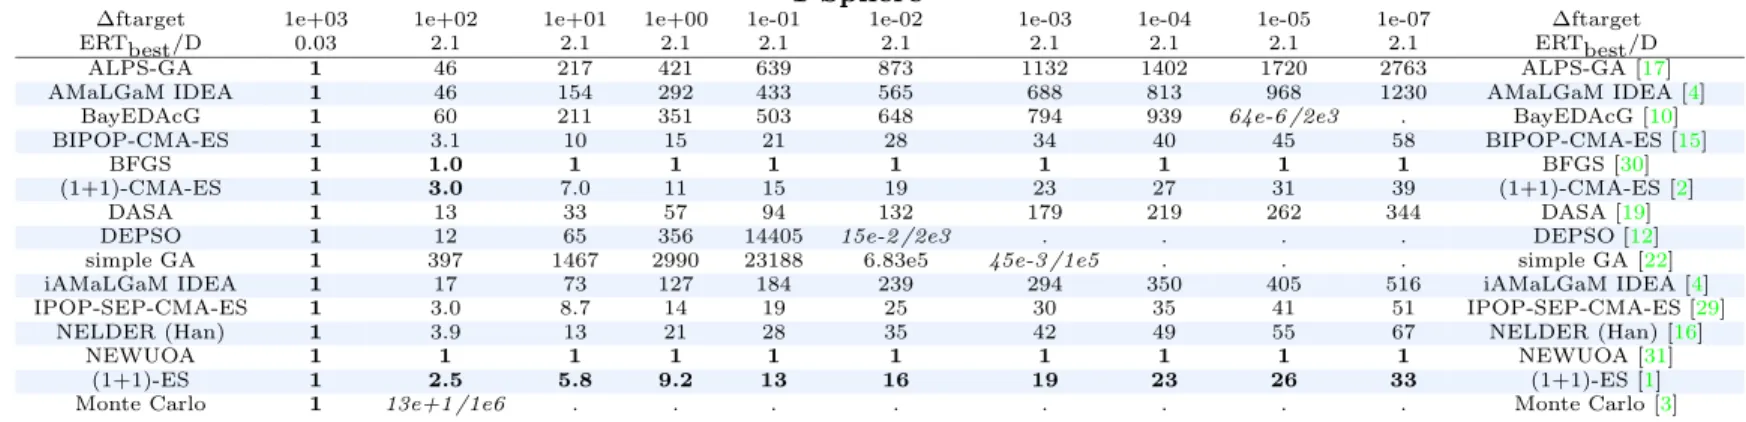
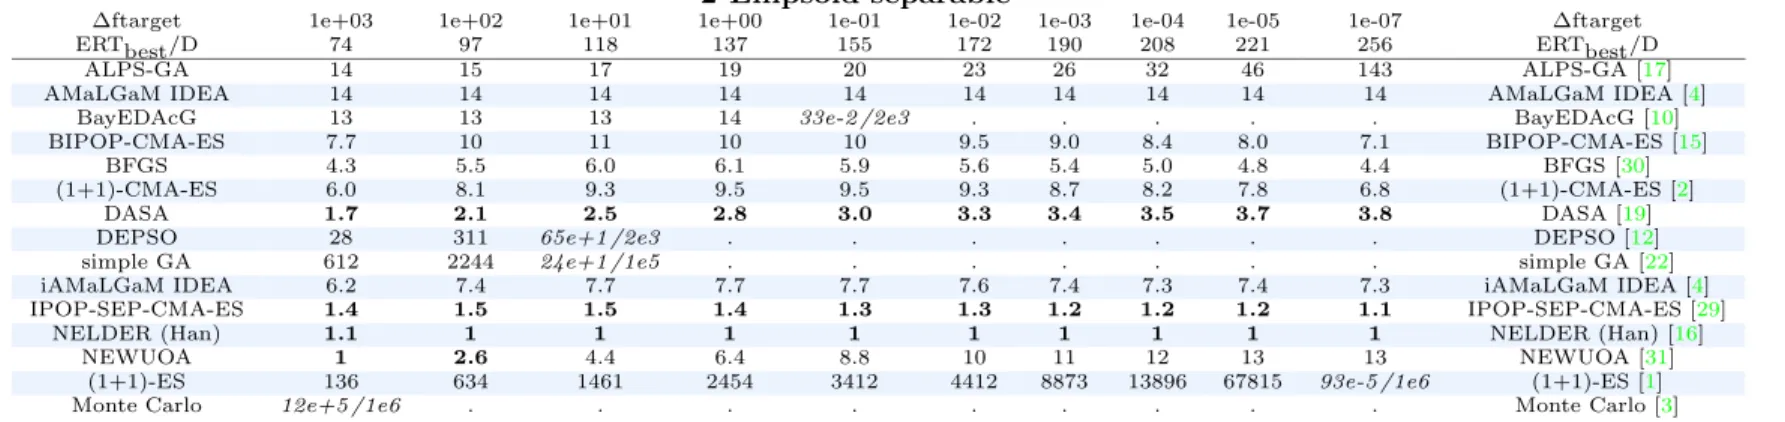
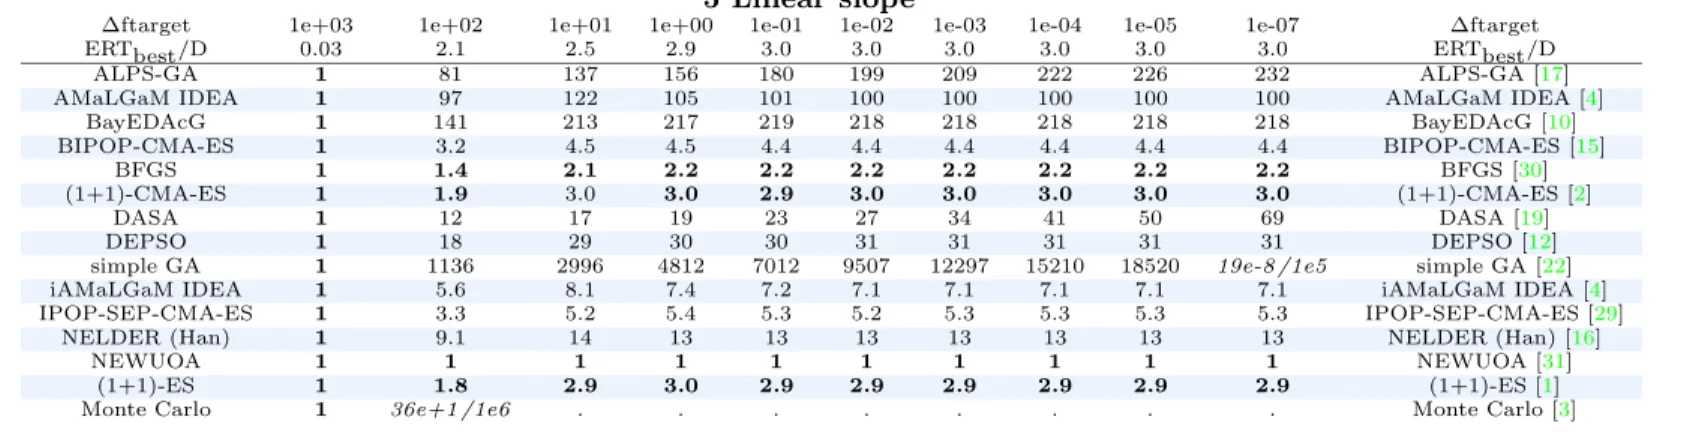
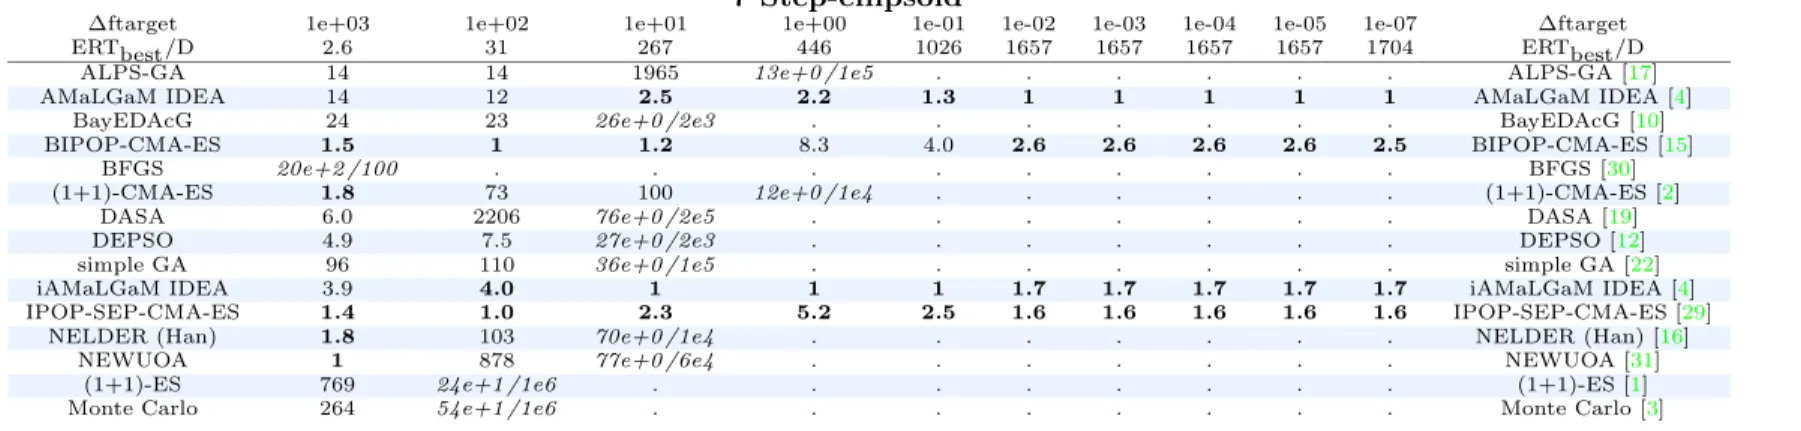
The performance measure provided in the following tables is the expected
number of objective function evaluations to reach a given target function value
(ERT, expected running time), divided by the respective value for the best
algorithm. Consequently, the best (smallest) value is 1 and the value 1 appears
in each column at least once. If the target was never reached, the median over
all trials of the best function value is shown. See [
13
] for details on how ERT is
obtained.
List of Tables
1
f
1in dimension 2 . . . .
7
2
f
2in dimension 2 . . . .
8
3
f
3in dimension 2 . . . .
9
4
f
4in dimension 2 . . . .
10
5
f
5in dimension 2 . . . .
11
6
f
6in dimension 2 . . . .
12
7
f
7in dimension 2 . . . .
13
8
f
8in dimension 2 . . . .
14
9
f
9in dimension 2 . . . .
15
10
f
10in dimension 2 . . . .
16
11
f
11in dimension 2 . . . .
17
12
f
12in dimension 2 . . . .
18
13
f
13in dimension 2 . . . .
19
14
f
14in dimension 2 . . . .
20
15
f
15in dimension 2 . . . .
21
16
f
16in dimension 2 . . . .
22
17
f
17in dimension 2 . . . .
23
18
f
18in dimension 2 . . . .
24
19
f
19in dimension 2 . . . .
25
20
f
20in dimension 2 . . . .
26
21
f
21in dimension 2 . . . .
27
22
f
22in dimension 2 . . . .
28
23
f
23in dimension 2 . . . .
29
24
f
24in dimension 2 . . . .
30
25
f
1in dimension 3 . . . .
31
26
f
2in dimension 3 . . . .
32
27
f
3in dimension 3 . . . .
33
28
f
4in dimension 3 . . . .
34
29
f
5in dimension 3 . . . .
35
30
f
6in dimension 3 . . . .
36
31
f
7in dimension 3 . . . .
37
32
f
8in dimension 3 . . . .
38
1seehttp://coco.gforge.inria.fr/doku.php?id=bbob-2009BBOB 2009: Comparison Tables of All Algorithms on All Noiseless Functions4
33
f
9in dimension 3 . . . .
39
34
f
10in dimension 3 . . . .
40
35
f
11in dimension 3 . . . .
41
36
f
12in dimension 3 . . . .
42
37
f
13in dimension 3 . . . .
43
38
f
14in dimension 3 . . . .
44
39
f
15in dimension 3 . . . .
45
40
f
16in dimension 3 . . . .
46
41
f
17in dimension 3 . . . .
47
42
f
18in dimension 3 . . . .
48
43
f
19in dimension 3 . . . .
49
44
f
20in dimension 3 . . . .
50
45
f
21in dimension 3 . . . .
51
46
f
22in dimension 3 . . . .
52
47
f
23in dimension 3 . . . .
53
48
f
24in dimension 3 . . . .
54
49
f
1in dimension 5 . . . .
55
50
f
2in dimension 5 . . . .
56
51
f
3in dimension 5 . . . .
57
52
f
4in dimension 5 . . . .
58
53
f
5in dimension 5 . . . .
59
54
f
6in dimension 5 . . . .
60
55
f
7in dimension 5 . . . .
61
56
f
8in dimension 5 . . . .
62
57
f
9in dimension 5 . . . .
63
58
f
10in dimension 5 . . . .
64
59
f
11in dimension 5 . . . .
65
60
f
12in dimension 5 . . . .
66
61
f
13in dimension 5 . . . .
67
62
f
14in dimension 5 . . . .
68
63
f
15in dimension 5 . . . .
69
64
f
16in dimension 5 . . . .
70
65
f
17in dimension 5 . . . .
71
66
f
18in dimension 5 . . . .
72
67
f
19in dimension 5 . . . .
73
68
f
20in dimension 5 . . . .
74
69
f
21in dimension 5 . . . .
75
70
f
22in dimension 5 . . . .
76
71
f
23in dimension 5 . . . .
77
72
f
24in dimension 5 . . . .
78
73
f
1in dimension 10 . . . .
79
74
f
2in dimension 10 . . . .
80
75
f
3in dimension 10 . . . .
81
76
f
4in dimension 10 . . . .
82
77
f
5in dimension 10 . . . .
83
78
f
6in dimension 10 . . . .
84
79
f
7in dimension 10 . . . .
85
80
f
8in dimension 10 . . . .
86
81
f
9in dimension 10 . . . .
87
82
f
10in dimension 10 . . . .
88
BBOB 2009: Comparison Tables of All Algorithms on All Noiseless Functions5
83
f
11in dimension 10 . . . .
89
84
f
12in dimension 10 . . . .
90
85
f
13in dimension 10 . . . .
91
86
f
14in dimension 10 . . . .
92
87
f
15in dimension 10 . . . .
93
88
f
16in dimension 10 . . . .
94
89
f
17in dimension 10 . . . .
95
90
f
18in dimension 10 . . . .
96
91
f
19in dimension 10 . . . .
97
92
f
20in dimension 10 . . . .
98
93
f
21in dimension 10 . . . .
99
94
f
22in dimension 10 . . . .
100
95
f
23in dimension 10 . . . .
101
96
f
24in dimension 10 . . . .
102
97
f
1in dimension 20 . . . .
103
98
f
2in dimension 20 . . . .
104
99
f
3in dimension 20 . . . .
105
100 f
4in dimension 20 . . . .
106
101 f
5in dimension 20 . . . .
107
102 f
6in dimension 20 . . . .
108
103 f
7in dimension 20 . . . .
109
104 f
8in dimension 20 . . . .
110
105 f
9in dimension 20 . . . .
111
106 f
10in dimension 20 . . . .
112
107 f
11in dimension 20 . . . .
113
108 f
12in dimension 20 . . . .
114
109 f
13in dimension 20 . . . .
115
110 f
14in dimension 20 . . . .
116
111 f
15in dimension 20 . . . .
117
112 f
16in dimension 20 . . . .
118
113 f
17in dimension 20 . . . .
119
114 f
18in dimension 20 . . . .
120
115 f
19in dimension 20 . . . .
121
116 f
20in dimension 20 . . . .
122
117 f
21in dimension 20 . . . .
123
118 f
22in dimension 20 . . . .
124
119 f
23in dimension 20 . . . .
125
120 f
24in dimension 20 . . . .
126
121 f
1in dimension 40 . . . .
127
122 f
2in dimension 40 . . . .
128
123 f
3in dimension 40 . . . .
129
124 f
4in dimension 40 . . . .
130
125 f
5in dimension 40 . . . .
131
126 f
6in dimension 40 . . . .
132
127 f
7in dimension 40 . . . .
133
128 f
8in dimension 40 . . . .
134
129 f
9in dimension 40 . . . .
135
130 f
10in dimension 40 . . . .
136
131 f
11in dimension 40 . . . .
137
132 f
12in dimension 40 . . . .
138
BBOB 2009: Comparison Tables of All Algorithms on All Noiseless Functions6
133 f
13in dimension 40 . . . .
139
134 f
14in dimension 40 . . . .
140
135 f
15in dimension 40 . . . .
141
136 f
16in dimension 40 . . . .
142
137 f
17in dimension 40 . . . .
143
138 f
18in dimension 40 . . . .
144
139 f
19in dimension 40 . . . .
145
140 f
20in dimension 40 . . . .
146
141 f
21in dimension 40 . . . .
147
142 f
22in dimension 40 . . . .
148
143 f
23in dimension 40 . . . .
149
144 f
24in dimension 40 . . . .
150
B
O
B
2
0
0
9
:
C
o
m
pa
ri
so
n
T
a
bl
es
o
f
A
ll
A
lg
o
ri
th
m
s
o
n
A
ll
N
o
is
el
es
s
F
u
n
ct
io
n
Table 1: Running time excess ERT/ERTbest on f
1in 2-D, in italics is given the median final function value and the median number of
function evaluations to reach this value divided by dimension
1 Sphere
∆ftarget 1e+03 1e+02 1e+01 1e+00 1e-01 1e-02 1e-03 1e-04 1e-05 1e-07 ∆ftarget
ERTbest/D 0.50 0.50 0.90 2.8 2.8 3.1 3.1 3.1 3.1 3.1 ERTbest/D
ALPS-GA 1 1 2.8 10 56 165 280 427 615 938 ALPS-GA [17]
AMaLGaM IDEA 1 1.1 2.1 4.4 11 13 22 27 31 45 AMaLGaM IDEA [4]
BayEDAcG 1 1 1.9 4.2 18 76 103 138 153 201 BayEDAcG [10]
BIPOP-CMA-ES 1 1 3.3 3.8 8.5 13 19 23 28 38 BIPOP-CMA-ES [15]
BFGS 1 1 3.3 1.2 1.2 1.1 1.1 1.1 1.1 1.1 BFGS [30]
Cauchy EDA 1 1 19 15 27 38 49 61 73 98 Cauchy EDA [24]
(1+1)-CMA-ES 1 1 3.3 3.6 7.6 10 14 18 21 28 (1+1)-CMA-ES [2]
DASA 1 1 39 23 44 50 60 74 92 120 DASA [19]
DEPSO 1 1 2.1 12 27 45 49 93 121 162 DEPSO [12]
DIRECT 1 1 1 1.4 2.5 9.1 15 20 31 54 DIRECT [25]
EDA-PSO 1 1 1.9 5.0 20 32 52 78 107 205 EDA-PSO [6]
full NEWUOA 1 1 2.7 1.2 1.2 1.1 1.1 1.1 1.1 1.1 full NEWUOA [31]
G3-PCX 1 1 1.9 6.0 17 18 23 28 33 45 G3-PCX [26]
simple GA 1 1 2.7 7.2 62 300 1042 1755 2516 4316 simple GA [22]
GLOBAL 1 1 1.9 5.7 39 49 52 53 54 56 GLOBAL [23]
iAMaLGaM IDEA 1 1 2.3 3.8 6.7 11 14 19 22 30 iAMaLGaM IDEA [4]
IPOP-SEP-CMA-ES 1 1 3.9 5.9 10 14 18 23 27 37 IPOP-SEP-CMA-ES [29]
LSfminbnd 1 1 7.8 3.2 3.6 4.0 4.0 4.0 4.0 4.0 LSfminbnd [28]
LSstep 1 1 46 34 62 61 66 66 66 67 LSstep [28]
MA-LS-Chain 1 1 2.4 7.4 26 39 65 83 89 98 MA-LS-Chain [21]
MCS 1 1 1 1.5 2.2 2.5 2.5 2.5 2.5 2.5 MCS [18]
NELDER (Han) 1 1 2.1 1.3 3.0 3.8 4.9 6.1 7.2 9.5 NELDER (Han) [16]
NELDER (Doe) 1 1 1.0 1.5 2.9 4.0 5.1 6.3 7.4 10 NELDER (Doe) [5]
NEWUOA 1 1 2.8 1 1 1 1 1 1 1 NEWUOA [31]
(1+1)-ES 1 1 3.5 2.8 6.7 10 14 18 22 29 (1+1)-ES [1]
POEMS 1 1 173 80 113 383 657 1051 1279 2002 POEMS [20]
PSO 1 1 2.1 5.3 20 57 115 190 246 457 PSO [7]
PSO Bounds 1 1.1 2.4 6.0 26 86 262 441 749 1183 PSO Bounds [8]
Monte Carlo 1 1 1.5 10 49 522 5751 46299 6.55e5 11e-6 /1e6 Monte Carlo [3]
Rosenbrock 1 1 5.6 3.1 3.9 4.7 6.0 7.3 8.5 10 Rosenbrock [27] VNS (Garcia) 1 1 2.6 8.9 25 32 36 42 47 58 VNS (Garcia) [11] T n ° 0 3 8 3
B
O
B
2
0
0
9
:
C
o
m
pa
ri
so
n
T
a
bl
es
o
f
A
ll
A
lg
o
ri
th
m
s
o
n
A
ll
N
o
is
el
es
s
F
u
n
ct
io
n
Table 2: Running time excess ERT/ERTbest on f
2in 2-D, in italics is given the median final function value and the median number of
function evaluations to reach this value divided by dimension
2 Ellipsoid separable
∆ftarget 1e+03 1e+02 1e+01 1e+00 1e-01 1e-02 1e-03 1e-04 1e-05 1e-07 ∆ftarget
ERTbest/D 4.9 6.2 8.2 9.5 12 13 13 14 14 14 ERTbest/D
ALPS-GA 11 24 58 123 129 162 204 231 258 330 ALPS-GA [17]
AMaLGaM IDEA 4.9 4.8 6.2 7.6 7.5 9.1 10 11 13 16 AMaLGaM IDEA [4]
BayEDAcG 37 62 80 78 82 87 112 111 139 143 BayEDAcG [10]
BIPOP-CMA-ES 4.0 5.4 13 19 18 18 20 20 20 22 BIPOP-CMA-ES [15]
BFGS 1.7 1.6 2.5 4.0 3.7 3.9 4.1 4.1 4.1 4.4 BFGS [30]
Cauchy EDA 13 17 18 18 18 20 23 24 25 29 Cauchy EDA [24]
(1+1)-CMA-ES 4.1 5.1 10 13 13 13 14 14 15 16 (1+1)-CMA-ES [2]
DASA 21 19 19 22 21 21 23 25 26 31 DASA [19]
DEPSO 10 16 18 26 27 31 35 40 45 53 DEPSO [12]
DIRECT 5.9 5.1 7.5 8.0 7.1 8.5 9.4 12 13 46 DIRECT [25]
EDA-PSO 8.8 11 13 19 20 26 39 49 65 88 EDA-PSO [6]
full NEWUOA 1.2 1.2 2.4 5.8 8.3 10 13 15 18 23 full NEWUOA [31]
G3-PCX 8.6 8.4 14 64 69 76 83 82 82 82 G3-PCX [26]
simple GA 11 44 133 325 422 540 782 994 1260 1894 simple GA [22]
GLOBAL 11 19 19 17 13 13 13 13 13 13 GLOBAL [23]
iAMaLGaM IDEA 2.6 3.8 5.1 9.2 9.1 10 11 12 12 14 iAMaLGaM IDEA [4]
IPOP-SEP-CMA-ES 4.5 5.4 14 19 16 17 18 18 18 20 IPOP-SEP-CMA-ES [29]
LSfminbnd 1.4 1.2 1 1 1 1 1 1 1 1 LSfminbnd [28]
LSstep 14 12 10 10 7.9 7.9 7.8 7.5 7.3 7.3 LSstep [28]
MA-LS-Chain 12 14 17 22 20 24 28 28 29 34 MA-LS-Chain [21]
MCS 1.5 1.6 1.4 1.8 1.7 2.6 3.2 3.3 3.7 23 MCS [18]
NELDER (Han) 1.9 1.8 1.7 1.8 1.8 2.0 2.2 2.4 2.6 3.0 NELDER (Han) [16]
NELDER (Doe) 1.6 1.7 1.6 1.9 1.7 1.9 2.2 2.3 2.5 3.0 NELDER (Doe) [5]
NEWUOA 1 1 2.2 8.8 12 15 19 23 26 35 NEWUOA [31]
(1+1)-ES 3.2 2407 8656 46584 1.23e5 3.76e5 74e-3 /1e6 . . . (1+1)-ES [1]
POEMS 138 248 376 421 396 465 514 572 631 780 POEMS [20]
PSO 7.5 14 56 83 83 98 118 132 156 195 PSO [7]
PSO Bounds 6.9 24 54 174 307 356 403 442 531 785 PSO Bounds [8]
Monte Carlo 21 50 244 1216 5649 1.00e5 94e-4 /1e6 . . . Monte Carlo [3]
Rosenbrock 2.6 3.1 2.5 3.7 4.4 5.4 6.3 6.5 6.9 7.9 Rosenbrock [27] VNS (Garcia) 8.4 15 22 27 24 25 26 26 26 29 VNS (Garcia) [11] T n ° 0 3 8 3
B
O
B
2
0
0
9
:
C
o
m
pa
ri
so
n
T
a
bl
es
o
f
A
ll
A
lg
o
ri
th
m
s
o
n
A
ll
N
o
is
el
es
s
F
u
n
ct
io
n
Table 3: Running time excess ERT/ERTbest on f
3in 2-D, in italics is given the median final function value and the median number of
function evaluations to reach this value divided by dimension
3 Rastrigin separable
∆ftarget 1e+03 1e+02 1e+01 1e+00 1e-01 1e-02 1e-03 1e-04 1e-05 1e-07 ∆ftarget
ERTbest/D 0.50 0.70 7.3 135 222 223 225 226 227 232 ERTbest/D
ALPS-GA 1.1 1.6 9.2 6.7 6.4 11 12 15 19 23 ALPS-GA [17]
AMaLGaM IDEA 1.1 1.1 3.7 4.6 12 12 12 12 13 13 AMaLGaM IDEA [4]
BayEDAcG 1.1 1.2 4.4 4.0 10 18 41 65 65 64 BayEDAcG [10]
BIPOP-CMA-ES 1 2.2 3.5 3.5 5.2 6.2 6.4 6.5 6.5 6.7 BIPOP-CMA-ES [15]
BFGS 1.2 18 14 3.1 10 10 10 10 10 10 BFGS [30]
Cauchy EDA 1.1 10 10 3.3 8.4 33 43 43 43 43 Cauchy EDA [24]
(1+1)-CMA-ES 1.0 1.9 6.9 3.8 7.9 7.9 7.9 7.9 7.9 7.8 (1+1)-CMA-ES [2]
DASA 6.3 22 18 1.8 6.9 7.0 7.1 7.2 7.4 7.6 DASA [19]
DEPSO 1.8 2.0 5.7 2.3 2.7 4.0 4.5 5.0 5.4 6.4 DEPSO [12]
DIRECT 1 1.1 2.7 1.0 2.4 2.4 2.5 2.6 2.7 3.0 DIRECT [25]
EDA-PSO 1.2 1.4 4.8 6.4 14 19 20 20 21 22 EDA-PSO [6]
full NEWUOA 1 4.0 2.3 1.8 2.2 2.2 2.2 2.1 2.1 2.1 full NEWUOA [31]
G3-PCX 1.1 2.0 4.1 7.8 40 40 39 39 39 39 G3-PCX [26]
simple GA 1 2.0 8.3 13 19 27 40 55 70 108 simple GA [22]
GLOBAL 1.1 1.6 7.0 1.8 3.1 3.1 3.1 3.1 3.1 3.1 GLOBAL [23]
iAMaLGaM IDEA 1.1 1.4 1.8 6.3 17 17 17 17 17 17 iAMaLGaM IDEA [4]
IPOP-SEP-CMA-ES 1 1.5 2.3 3.4 7.6 8.4 9.2 9.4 10 10 IPOP-SEP-CMA-ES [29]
LSfminbnd 2.1 4.7 17 32 43 64 63 63 63 61 LSfminbnd [28]
LSstep 28 116 24 1.5 1 1 1 1 1 1 LSstep [28]
MA-LS-Chain 1 1.5 5.7 1.7 2.5 2.6 2.7 2.7 2.8 2.9 MA-LS-Chain [21]
MCS 1 1.1 1.5 1.1 1.5 1.6 1.6 2.6 2.6 2.6 MCS [18]
NELDER (Han) 1.2 1.8 1.4 4.0 13 13 13 13 12 12 NELDER (Han) [16]
NELDER (Doe) 1 1 1 1 1.7 1.8 1.8 1.8 1.8 1.8 NELDER (Doe) [5]
NEWUOA 1.5 2.4 4.8 1.5 4.2 4.2 4.2 4.1 4.1 4.1 NEWUOA [31]
(1+1)-ES 1.1 2.4 12 5.0 15 15 15 15 15 14 (1+1)-ES [1]
POEMS 31 205 42 11 14 20 24 29 32 41 POEMS [20]
PSO 1.1 1.6 5.1 3.3 3.4 4.7 6.0 7.2 8.8 11 PSO [7]
PSO Bounds 1.1 1.8 4.8 5.3 8.3 14 18 22 26 34 PSO Bounds [8]
Monte Carlo 1.1 1.5 14 67 464 3098 20592 39e-4 /1e6 . . Monte Carlo [3]
Rosenbrock 1 16 45 15 26 26 26 26 26 25 Rosenbrock [27] VNS (Garcia) 1 1.9 8.8 2.9 4.1 4.2 4.2 4.5 4.7 7.7 VNS (Garcia) [11] T n ° 0 3 8 3
B
O
B
2
0
0
9
:
C
o
m
pa
ri
so
n
T
a
bl
es
o
f
A
ll
A
lg
o
ri
th
m
s
o
n
A
ll
N
o
is
el
es
s
F
u
n
ct
io
n
s1
Table 4: Running time excess ERT/ERTbest on f
4in 2-D, in italics is given the median final function value and the median number of
function evaluations to reach this value divided by dimension
4 Skew Rastrigin-Bueche separable
∆ftarget 1e+03 1e+02 1e+01 1e+00 1e-01 1e-02 1e-03 1e-04 1e-05 1e-07 ∆ftarget
ERTbest/D 0.50 0.50 11 172 230 248 261 270 272 283 ERTbest/D
ALPS-GA 1 2.5 9.0 7.1 8.3 10 12 15 17 20 ALPS-GA [17]
AMaLGaM IDEA 1 2.2 2.6 5.6 51 48 48 46 47 45 AMaLGaM IDEA [4]
BayEDAcG 1 2.3 4.5 13 62 117 112 10e-1 /2e3 . . BayEDAcG [10]
BIPOP-CMA-ES 1 3.8 2.6 6.9 55 97 99 98 99 106 BIPOP-CMA-ES [15]
BFGS 1 13 11 5.7 12 11 11 10 10 10 BFGS [30]
Cauchy EDA 1 19 6.8 13 75 405 468 454 450 433 Cauchy EDA [24]
(1+1)-CMA-ES 1 2.4 5.2 5.5 27 25 24 23 23 22 (1+1)-CMA-ES [2]
DASA 1 82 15 2.0 3.6 3.4 3.3 3.3 3.4 3.4 DASA [19]
DEPSO 1 2.4 7.2 4.2 6.5 11 17 17 17 35 DEPSO [12]
DIRECT 1 1 1.8 1.8 6.6 6.1 14 14 16 16 DIRECT [25]
EDA-PSO 1 2.6 4.2 10 18 19 19 19 19 20 EDA-PSO [6]
full NEWUOA 1 3.8 5.4 3.9 15 14 13 13 13 12 full NEWUOA [31]
G3-PCX 1 2.1 20 17 76 70 67 65 64 62 G3-PCX [26]
simple GA 1 2.6 10 16 22 28 37 49 60 105 simple GA [22]
GLOBAL 1 2.4 8.5 1.2 5.2 4.8 4.6 4.5 4.5 4.3 GLOBAL [23]
iAMaLGaM IDEA 1 3.8 2.5 9.5 61 57 56 55 55 54 iAMaLGaM IDEA [4]
IPOP-SEP-CMA-ES 1 3.5 3.0 8.7 75 178 267 259 258 249 IPOP-SEP-CMA-ES [29]
LSfminbnd 1 4.6 1 45 119 226 10e-1 /4e3 . . . LSfminbnd [28]
LSstep 1 216 19 1.3 1 1 1 1 1 1 LSstep [28]
MA-LS-Chain 1 2.3 5.6 1.8 4.4 4.2 4.1 4.0 4.1 4.1 MA-LS-Chain [21]
MCS 1 1 2.0 1 2.9 2.7 2.7 2.7 2.7 2.6 MCS [18]
NELDER (Han) 1 3.1 5.0 5.3 27 25 24 23 23 22 NELDER (Han) [16]
NELDER (Doe) 1 2.1 1.9 1.4 3.5 3.2 3.1 3.0 3.0 3.0 NELDER (Doe) [5]
NEWUOA 1 3.0 5.0 4.5 18 16 16 15 15 14 NEWUOA [31]
(1+1)-ES 1 3.1 4.5 5.5 23 21 20 20 20 19 (1+1)-ES [1]
POEMS 1 237 36 10 22 23 29 32 35 41 POEMS [20]
PSO 1.1 3.2 4.0 3.3 4.6 5.6 6.4 7.4 8.7 11 PSO [7]
PSO Bounds 1 3.3 4.4 6.3 10 17 21 24 27 33 PSO Bounds [8]
Monte Carlo 1 3.3 8.6 67 617 8200 27936 54724 11e-3 /1e6 . Monte Carlo [3]
Rosenbrock 1 71 27 15 52 48 46 44 44 42 Rosenbrock [27] VNS (Garcia) 1 2.6 5.1 4.1 8.8 8.2 7.9 8.3 8.8 17 VNS (Garcia) [11] T n ° 0 3 8 3
B
O
B
2
0
0
9
:
C
o
m
pa
ri
so
n
T
a
bl
es
o
f
A
ll
A
lg
o
ri
th
m
s
o
n
A
ll
N
o
is
el
es
s
F
u
n
ct
io
n
s1
Table 5: Running time excess ERT/ERTbest on f
5in 2-D, in italics is given the median final function value and the median number of
function evaluations to reach this value divided by dimension
5 Linear slope
∆ftarget 1e+03 1e+02 1e+01 1e+00 1e-01 1e-02 1e-03 1e-04 1e-05 1e-07 ∆ftarget
ERTbest/D 0.50 0.50 1.8 2.2 2.2 2.2 2.2 2.2 2.2 2.2 ERTbest/D
ALPS-GA 1 1.1 8.8 76 100 104 104 104 104 104 ALPS-GA [17]
AMaLGaM IDEA 1 1.1 5.3 16 18 18 18 18 18 18 AMaLGaM IDEA [4]
BayEDAcG 1 1 3.3 92 102 103 103 103 103 103 BayEDAcG [10]
BIPOP-CMA-ES 1 1 3.4 5.3 5.7 5.8 5.8 5.8 5.8 5.8 BIPOP-CMA-ES [15]
BFGS 1 1 1.5 2.8 2.8 2.9 2.9 2.9 2.9 2.9 BFGS [30]
Cauchy EDA 1 1 16 17 17 17 17 17 17 17 Cauchy EDA [24]
(1+1)-CMA-ES 1 1 1.9 3.1 3.4 3.4 3.4 3.4 3.4 3.4 (1+1)-CMA-ES [2]
DASA 1 1.9 19 32 40 46 53 60 66 80 DASA [19]
DEPSO 1 1 6.1 34 35 36 36 36 36 36 DEPSO [12]
DIRECT 1 1 3.4 2.8 4.2 4.2 4.2 4.2 4.2 4.2 DIRECT [25]
EDA-PSO 1 1 5.0 15 16 17 17 17 17 17 EDA-PSO [6]
full NEWUOA 1 1.3 1 1.2 1.4 1.4 1.4 1.4 1.4 1.4 full NEWUOA [31]
G3-PCX 1 1.1 4.1 29 31 31 31 31 31 31 G3-PCX [26]
simple GA 1 1 4.2 306 1957 4247 6326 9795 15125 6.80e5 simple GA [22]
GLOBAL 1 1.1 4.4 69 70 70 70 70 70 70 GLOBAL [23]
iAMaLGaM IDEA 1 1 4.6 12 13 13 13 13 13 13 iAMaLGaM IDEA [4]
IPOP-SEP-CMA-ES 1 1 4.0 6.6 7.1 7.1 7.1 7.1 7.1 7.1 IPOP-SEP-CMA-ES [29]
LSfminbnd 1 1 4.9 7.3 8.5 9.1 9.1 9.1 9.1 9.1 LSfminbnd [28]
LSstep 1 1.2 59 79 91 91 91 91 91 91 LSstep [28]
MA-LS-Chain 1 1.1 4.7 81 123 126 126 126 126 126 MA-LS-Chain [21]
MCS 1 1 1.2 1 1 1 1 1 1 1 MCS [18]
NELDER (Han) 1 1 1.8 2.1 2.2 2.2 2.2 2.2 2.2 2.2 NELDER (Han) [16]
NELDER (Doe) 1 1 1.3 1.9 1.9 1.9 1.9 1.9 1.9 1.9 NELDER (Doe) [5]
NEWUOA 1 1 1.1 1.5 1.5 1.5 1.5 1.5 1.5 1.5 NEWUOA [31]
(1+1)-ES 1 1 1.9 2.4 2.5 2.6 2.6 2.6 2.6 2.6 (1+1)-ES [1]
POEMS 1 1 138 154 173 181 185 185 185 185 POEMS [20]
PSO 1 1.1 4.2 18 20 21 21 21 21 21 PSO [7]
PSO Bounds 1 1 6.1 13 16 16 16 16 16 16 PSO Bounds [8]
Monte Carlo 1 1 4.4 529 49212 22e-3 /1e6 . . . . Monte Carlo [3]
Rosenbrock 1 1 3.5 3.4 3.5 3.5 3.5 3.5 3.5 3.5 Rosenbrock [27] VNS (Garcia) 1 1 6.3 27 27 27 27 27 27 27 VNS (Garcia) [11] T n ° 0 3 8 3
B
O
B
2
0
0
9
:
C
o
m
pa
ri
so
n
T
a
bl
es
o
f
A
ll
A
lg
o
ri
th
m
s
o
n
A
ll
N
o
is
el
es
s
F
u
n
ct
io
n
s1
Table 6: Running time excess ERT/ERTbest on f
6in 2-D, in italics is given the median final function value and the median number of
function evaluations to reach this value divided by dimension
6 Attractive sector
∆ftarget 1e+03 1e+02 1e+01 1e+00 1e-01 1e-02 1e-03 1e-04 1e-05 1e-07 ∆ftarget
ERTbest/D 0.83 1.4 6.3 11 20 27 34 40 47 62 ERTbest/D
ALPS-GA 3.2 3.2 2.2 12 31 50 62 73 80 83 ALPS-GA [17]
AMaLGaM IDEA 1.1 1.4 2.1 4.5 4.9 5.5 6.2 6.5 6.7 7.0 AMaLGaM IDEA [4]
BayEDAcG 2.8 1.9 1.5 164 640 72e-2 /2e3 . . . . BayEDAcG [10]
BIPOP-CMA-ES 3.9 3.0 2.0 2.8 3.6 3.9 4.2 4.2 4.1 4.3 BIPOP-CMA-ES [15]
BFGS 4.3 4.4 4.2 3.4 2.7 2.4 2.0 1.9 1.7 1.6 BFGS [30]
Cauchy EDA 11 10 16 18 17 17 17 17 16 16 Cauchy EDA [24]
(1+1)-CMA-ES 4.2 3.3 2.1 3.0 2.3 2.2 2.2 2.3 2.2 2.1 (1+1)-CMA-ES [2]
DASA 30 29 23 22 18 19 19 18 18 18 DASA [19]
DEPSO 1.7 1.7 3.8 11 12 14 14 15 16 17 DEPSO [12]
DIRECT 1.4 1 1.4 7.6 5.8 125 801 1455 1232 972 DIRECT [25]
EDA-PSO 3.4 2.4 3.1 12 12 15 19 27 29 34 EDA-PSO [6]
full NEWUOA 1 2.2 3.4 3.7 3.2 3.5 3.7 3.7 4.1 4.5 full NEWUOA [31]
G3-PCX 2.3 1.5 2.3 4.5 3.7 3.9 3.9 3.8 3.8 4.1 G3-PCX [26]
simple GA 4.8 3.4 3.5 14 85 1004 3073 4055 3586 4893 simple GA [22]
GLOBAL 3.7 2.9 2.3 8.8 7.4 6.2 5.2 4.5 3.9 3.2 GLOBAL [23]
iAMaLGaM IDEA 2.7 1.9 2.4 3.6 3.8 4.0 4.1 4.2 4.3 4.4 iAMaLGaM IDEA [4]
IPOP-SEP-CMA-ES 4.7 3.1 1.7 4.1 3.8 4.5 4.6 4.7 4.6 4.4 IPOP-SEP-CMA-ES [29]
LSfminbnd 19 187 283 375 289 258 210 179 154 121 LSfminbnd [28]
LSstep 53 329 913 579 375 332 709 1151 17e-4 /1e4 . LSstep [28]
MA-LS-Chain 4.4 2.9 2.2 13 14 14 12 12 10 10 MA-LS-Chain [21]
MCS 1.4 195 52 29 19 42 102 114 102 117 MCS [18]
NELDER (Han) 2.1 1.5 1 1 1.1 1.1 1.1 1.1 1.1 1.1 NELDER (Han) [16]
NELDER (Doe) 1.6 2.0 1.3 1.3 1 1 1 1 1 1 NELDER (Doe) [5]
NEWUOA 1.2 2.4 4.4 4.7 3.9 4.4 4.7 4.8 5.0 4.9 NEWUOA [31]
(1+1)-ES 2.4 2.2 2.5 3.7 3.6 3.6 3.4 3.4 3.3 3.2 (1+1)-ES [1]
POEMS 205 155 99 133 117 138 134 144 182 179 POEMS [20]
PSO 1.5 1.1 2.1 4.6 7.9 18 23 29 32 36 PSO [7]
PSO Bounds 2.2 1.5 2.6 7.0 37 77 133 137 136 166 PSO Bounds [8]
Monte Carlo 3.0 2.3 2.7 16 53 783 13169 81456 1.50e5 28e-5 /1e6 Monte Carlo [3]
Rosenbrock 4.0 3.0 2.2 2.1 1.8 1.8 1.8 1.8 1.7 1.5 Rosenbrock [27] VNS (Garcia) 2.6 2.7 1.9 7.2 6.9 6.7 6.3 6.3 6.1 5.7 VNS (Garcia) [11] T n ° 0 3 8 3
B
O
B
2
0
0
9
:
C
o
m
pa
ri
so
n
T
a
bl
es
o
f
A
ll
A
lg
o
ri
th
m
s
o
n
A
ll
N
o
is
el
es
s
F
u
n
ct
io
n
s1
Table 7: Running time excess ERT/ERTbest on f
7in 2-D, in italics is given the median final function value and the median number of
function evaluations to reach this value divided by dimension
7 Step-ellipsoid
∆ftarget 1e+03 1e+02 1e+01 1e+00 1e-01 1e-02 1e-03 1e-04 1e-05 1e-07 ∆ftarget
ERTbest/D 0.50 1 1.6 11 30 97 108 108 108 121 ERTbest/D
ALPS-GA 1.1 1.4 4.1 4.7 12 9.5 11 11 11 13 ALPS-GA [17]
AMaLGaM IDEA 1.1 1.5 3.4 20 8.1 2.7 2.5 2.5 2.5 2.4 AMaLGaM IDEA [4]
BayEDAcG 1.5 1.7 4.2 3.1 79 85 76 76 76 109 BayEDAcG [10]
BIPOP-CMA-ES 1.9 1.9 3.2 2.6 3.4 1.5 1.5 1.5 1.5 1.6 BIPOP-CMA-ES [15]
BFGS 1.6 3.7 10 19 34 76e-2 /200 . . . . BFGS [30]
Cauchy EDA 5.5 8.4 19 7.6 5.3 2.0 1.9 1.9 1.9 2.1 Cauchy EDA [24]
(1+1)-CMA-ES 1.5 1.4 2.7 1.8 2.8 1 1 1 1 1 (1+1)-CMA-ES [2]
DASA 30 59 171 167 309 242 436 436 436 392 DASA [19]
DEPSO 1.7 1.7 6.5 4.8 4.9 2.6 3.1 3.1 3.1 3.6 DEPSO [12]
DIRECT 1.4 1 2.1 1.3 1 2.7 3.0 3.0 3.0 2.7 DIRECT [25]
EDA-PSO 1.5 1.8 3.7 3.1 6.2 6.2 9.0 9.0 9.0 14 EDA-PSO [6]
full NEWUOA 1.9 2.7 2.0 3.7 3.7 1.7 2.9 2.9 2.9 2.7 full NEWUOA [31]
G3-PCX 1.3 1.5 4.5 12 35 19 21 21 21 19 G3-PCX [26]
simple GA 1.6 1.6 5.2 3.9 22 24 47 47 47 67 simple GA [22]
GLOBAL 1.2 1.8 6.8 4.1 7.5 2.7 4.4 4.4 4.4 3.9 GLOBAL [23]
iAMaLGaM IDEA 1.8 1.8 3.9 12 4.7 2.8 2.5 2.5 2.5 2.4 iAMaLGaM IDEA [4]
IPOP-SEP-CMA-ES 1 2.1 5.5 2.7 2.8 1.2 1.3 1.3 1.3 1.5 IPOP-SEP-CMA-ES [29]
LSfminbnd 1.3 1.1 6.3 11 66 55 495 495 495 965 LSfminbnd [28]
LSstep 28 28 260 245 457 1515 29e-3 /1e4 . . . LSstep [28]
MA-LS-Chain 1.7 2.3 5.8 3.4 4.7 3.6 4.6 4.6 4.6 4.7 MA-LS-Chain [21]
MCS 1.4 1.4 1 4.1 4.5 2.2 6.5 6.5 6.5 6.0 MCS [18]
NELDER (Han) 1.5 1.3 2.5 25 18 6.6 6.5 6.5 6.5 5.9 NELDER (Han) [16]
NELDER (Doe) 1.8 1.6 2.6 1 8.5 5.4 5.2 5.2 5.2 5.4 NELDER (Doe) [5]
NEWUOA 1.7 2.0 2.5 9.3 9.3 6.0 14 14 14 12 NEWUOA [31]
(1+1)-ES 2.3 3.3 5.6 4.1 4.3 1.8 3.3 3.3 3.3 3.0 (1+1)-ES [1]
POEMS 218 214 180 45 41 21 23 23 23 28 POEMS [20]
PSO 1.5 1.3 4.1 3.5 4.8 3.2 3.6 3.6 3.6 4.4 PSO [7]
PSO Bounds 1.3 1.6 6.2 3.4 5.8 5.0 6.7 6.7 6.7 14 PSO Bounds [8]
Monte Carlo 1.7 1.5 4.6 4.5 43 87 150 150 150 952 Monte Carlo [3]
Rosenbrock 16 42 155 119 166 78 189 189 189 170 Rosenbrock [27] VNS (Garcia) 1 2.4 3.9 3.8 5.1 2.1 2.0 2.0 2.0 2.0 VNS (Garcia) [11] T n ° 0 3 8 3
B
O
B
2
0
0
9
:
C
o
m
pa
ri
so
n
T
a
bl
es
o
f
A
ll
A
lg
o
ri
th
m
s
o
n
A
ll
N
o
is
el
es
s
F
u
n
ct
io
n
s1
Table 8: Running time excess ERT/ERTbest on f
8in 2-D, in italics is given the median final function value and the median number of
function evaluations to reach this value divided by dimension
8 Rosenbrock original
∆ftarget 1e+03 1e+02 1e+01 1e+00 1e-01 1e-02 1e-03 1e-04 1e-05 1e-07 ∆ftarget
ERTbest/D 0.60 1.6 2.7 6.0 18 23 43 46 47 56 ERTbest/D
ALPS-GA 2.9 2.8 4.7 19 31 66 54 74 94 131 ALPS-GA [17]
AMaLGaM IDEA 2.4 4.1 6.2 10 6.8 7.0 4.4 4.7 5.1 5.0 AMaLGaM IDEA [4]
BayEDAcG 2.3 2.9 5.6 11 48 354 53e-3 /2e3 . . . BayEDAcG [10]
BIPOP-CMA-ES 3.1 3.3 3.5 7.1 9.2 11 6.4 6.5 6.7 6.2 BIPOP-CMA-ES [15]
BFGS 7.5 4.9 4.1 5.1 2.4 2.2 1.3 1.3 1.3 1.1 BFGS [30]
Cauchy EDA 15 11 10 24 19 21 12 13 14 13 Cauchy EDA [24]
(1+1)-CMA-ES 6.4 4.3 3.8 11 6.9 7.0 4.2 4.1 4.3 4.0 (1+1)-CMA-ES [2]
DASA 31 33 108 520 484 678 522 580 698 822 DASA [19]
DEPSO 4.0 3.3 3.6 14 15 25 28 42 65 76e-7 /2e3 DEPSO [12]
DIRECT 1 1 1.4 5.0 4.4 8.7 10 16 17 21 DIRECT [25]
EDA-PSO 1.9 3.0 5.4 11 50 98 97 141 176 216 EDA-PSO [6]
full NEWUOA 6.6 3.9 7.0 7.0 3.2 2.8 1.6 1.5 1.5 1.3 full NEWUOA [31]
G3-PCX 2.8 4.0 5.0 24 16 18 11 11 11 10 G3-PCX [26]
simple GA 2.0 2.9 8.4 34 87 169 1342 8897 61e-5 /1e5 . simple GA [22]
GLOBAL 4.4 4.5 14 19 8.2 7.2 4.1 3.9 3.9 3.4 GLOBAL [23]
iAMaLGaM IDEA 2.3 2.8 4.4 12 8.0 8.4 5.0 5.2 5.5 5.2 iAMaLGaM IDEA [4]
IPOP-SEP-CMA-ES 6.4 3.9 5.2 19 17 17 10 9.3 10 8.7 IPOP-SEP-CMA-ES [29]
LSfminbnd 16 7.0 423 1541 2305 6304 90e-2 /1e4 . . . LSfminbnd [28]
LSstep 67 51 37 1481 3558 6070 32e-2 /1e4 . . . LSstep [28]
MA-LS-Chain 2.7 3.6 7.2 16 10 15 9.0 8.8 9.0 8.5 MA-LS-Chain [21]
MCS 1 1.2 1 1 1 1 1 1 1 1 MCS [18]
NELDER (Han) 1.9 1.4 2.1 3.7 2.0 2.0 1.1 1.2 1.2 1.2 NELDER (Han) [16]
NELDER (Doe) 3.0 3.2 4.6 6.2 2.9 2.7 1.6 1.5 1.6 1.5 NELDER (Doe) [5]
NEWUOA 3.8 2.8 4.3 7.0 3.5 3.2 1.9 1.8 1.8 1.6 NEWUOA [31]
(1+1)-ES 2.3 2.2 47 59 23 34 35 51 70 95 (1+1)-ES [1]
POEMS 227 113 121 106 76 108 74 91 116 129 POEMS [20]
PSO 2.7 2.6 6.5 11 16 27 26 37 49 67 PSO [7]
PSO Bounds 3.7 4.3 6.0 19 24 61 69 122 148 205 PSO Bounds [8]
Monte Carlo 2.7 3.2 5.8 19 72 674 2214 39156 3.14e5 17e-5 /1e6 Monte Carlo [3]
Rosenbrock 5.8 3.4 4.9 10 5.2 4.8 2.8 2.7 2.8 2.5 Rosenbrock [27] VNS (Garcia) 10 4.8 8.1 16 10 11 6.9 6.8 7.2 6.7 VNS (Garcia) [11] T n ° 0 3 8 3
B
O
B
2
0
0
9
:
C
o
m
pa
ri
so
n
T
a
bl
es
o
f
A
ll
A
lg
o
ri
th
m
s
o
n
A
ll
N
o
is
el
es
s
F
u
n
ct
io
n
s1
Table 9: Running time excess ERT/ERTbest on f
9in 2-D, in italics is given the median final function value and the median number of
function evaluations to reach this value divided by dimension
9 Rosenbrock rotated
∆ftarget 1e+03 1e+02 1e+01 1e+00 1e-01 1e-02 1e-03 1e-04 1e-05 1e-07 ∆ftarget
ERTbest/D 0.50 0.50 0.50 8.9 15 22 34 38 41 46 ERTbest/D
ALPS-GA 3.3 7.2 33 19 41 62 64 81 100 143 ALPS-GA [17]
AMaLGaM IDEA 4.2 13 22 6.3 9.5 10 7.5 7.4 7.7 7.6 AMaLGaM IDEA [4]
BayEDAcG 3.8 11 29 10 99 598 66e-3 /2e3 . . . BayEDAcG [10]
BIPOP-CMA-ES 2.6 10 19 4.6 7.1 7.5 5.8 5.6 5.8 5.9 BIPOP-CMA-ES [15]
BFGS 4.2 9.2 16 2.4 2.3 1.9 1.4 1.3 1.2 1.1 BFGS [30]
Cauchy EDA 16 37 59 14 20 19 14 14 14 14 Cauchy EDA [24]
(1+1)-CMA-ES 3.5 10 26 8.8 8.0 7.3 5.4 5.0 5.0 4.9 (1+1)-CMA-ES [2]
DASA 65 113 318 246 290 326 317 382 548 738 DASA [19]
DEPSO 2.7 12 58 12 12 20 19 25 45 97 DEPSO [12]
DIRECT 1 1 1 2.0 5.0 5.8 8.3 14 18 25 DIRECT [25]
EDA-PSO 3.8 12 47 8.5 27 51 78 123 151 205 EDA-PSO [6]
full NEWUOA 7.1 12 24 2.7 2.2 1.8 1.3 1.2 1.1 1.1 full NEWUOA [31]
G3-PCX 4.1 10 28 15 20 18 14 13 13 11 G3-PCX [26]
simple GA 5.0 15 44 22 90 193 2167 2178 10262 14675 simple GA [22]
GLOBAL 3.5 11 30 9.1 11 7.9 5.2 4.7 4.5 4.2 GLOBAL [23]
iAMaLGaM IDEA 3.1 7.9 29 6.0 7.2 6.9 5.3 5.1 5.3 5.3 iAMaLGaM IDEA [4]
IPOP-SEP-CMA-ES 3.1 9.5 16 7.6 15 14 10 9.3 9.4 9.0 IPOP-SEP-CMA-ES [29]
LSfminbnd 6.2 15 20 212 666 3120 4143 3637 3441 76e-3 /1e4 LSfminbnd [28]
LSstep 266 613 747 227 671 1833 2087 3808 76e-3 /1e4 . LSstep [28]
MA-LS-Chain 5.0 10 35 8.6 13 13 11 10 10 11 MA-LS-Chain [21]
MCS 1 1 1 1 1 1 1 1 1 1 MCS [18]
NELDER (Han) 2.7 3.6 10 1.6 2.0 1.8 1.3 1.2 1.2 1.2 NELDER (Han) [16]
NELDER (Doe) 4.1 6.9 11 2.3 2.6 2.1 1.5 1.4 1.4 1.4 NELDER (Doe) [5]
NEWUOA 5.2 8.3 24 3.6 3.3 2.7 1.9 1.8 1.8 1.7 NEWUOA [31]
(1+1)-ES 4.4 8.1 19 81 116 116 101 114 133 159 (1+1)-ES [1]
POEMS 360 449 559 65 78 114 98 111 132 163 POEMS [20]
PSO 4.0 15 37 8.7 12 24 28 38 49 67 PSO [7]
PSO Bounds 3.9 9.0 48 11 27 96 122 157 197 240 PSO Bounds [8]
Monte Carlo 3.0 10 47 17 113 897 3606 68989 3.65e5 16e-5 /1e6 Monte Carlo [3]
Rosenbrock 8.9 12 22 2.6 3.1 2.9 2.2 2.2 2.2 2.2 Rosenbrock [27] VNS (Garcia) 4.8 21 45 14 15 12 10 9.4 10 10 VNS (Garcia) [11] T n ° 0 3 8 3
B
O
B
2
0
0
9
:
C
o
m
pa
ri
so
n
T
a
bl
es
o
f
A
ll
A
lg
o
ri
th
m
s
o
n
A
ll
N
o
is
el
es
s
F
u
n
ct
io
n
s1
Table 10: Running time excess ERT/ERTbest on f
10in 2-D, in italics is given the median final function value and the median number
of function evaluations to reach this value divided by dimension
10 Ellipsoid
∆ftarget 1e+03 1e+02 1e+01 1e+00 1e-01 1e-02 1e-03 1e-04 1e-05 1e-07 ∆ftarget
ERTbest/D 2.9 5.7 15 23 27 30 34 38 41 49 ERTbest/D
ALPS-GA 22 25 47 69 164 353 776 1644 2079 3203 ALPS-GA [17]
AMaLGaM IDEA 6.7 5.7 3.0 3.0 3.8 4.0 4.1 4.1 4.3 4.4 AMaLGaM IDEA [4]
BayEDAcG 17 13 60 188 313 33e-1 /2e3 . . . . BayEDAcG [10]
BIPOP-CMA-ES 12 12 7.9 9.0 8.5 7.9 7.7 7.4 7.3 6.8 BIPOP-CMA-ES [15]
BFGS 2.3 1.5 1 1.4 1.4 1.4 1.4 2.6 6.3 24 BFGS [30]
Cauchy EDA 14 13 7.4 6.4 7.0 7.0 7.4 7.7 8.0 8.4 Cauchy EDA [24]
(1+1)-CMA-ES 7.3 5.8 7.2 6.6 6.3 5.8 5.5 5.3 5.2 4.8 (1+1)-CMA-ES [2]
DASA 22 15 8920 51851 60955 95121 1.21e5 1.09e5 1.02e5 85710 DASA [19]
DEPSO 16 26 80 111 328 312 51e-2 /2e3 . . . DEPSO [12]
DIRECT 3.9 4.3 3.9 9.5 20 68 116 187 223 456 DIRECT [25]
EDA-PSO 17 26 43 139 330 645 1113 2126 3000 8601 EDA-PSO [6]
full NEWUOA 2.0 3.0 3.8 4.5 6.0 6.4 7.1 7.7 8.2 9.0 full NEWUOA [31]
G3-PCX 11 10 26 39 39 37 34 31 29 25 G3-PCX [26]
simple GA 27 51 77 702 2828 4294 41912 37827 23e-3 /1e5 . simple GA [22]
GLOBAL 18 19 11 7.4 6.4 5.8 5.3 4.9 4.6 4.0 GLOBAL [23]
iAMaLGaM IDEA 5.5 4.0 3.3 3.7 4.1 4.1 4.0 4.1 4.2 4.1 iAMaLGaM IDEA [4]
IPOP-SEP-CMA-ES 8.3 12 16 14 16 15 13 12 12 11 IPOP-SEP-CMA-ES [29]
LSfminbnd 1.8 1 767 6307 15e+0 /1e4 . . . LSfminbnd [28]
LSstep 2.1 1.2 768 2843 15e+0 /1e4 . . . LSstep [28]
MA-LS-Chain 16 20 13 18 19 20 19 18 18 17 MA-LS-Chain [21]
MCS 1 1.2 1.7 8.7 47 132 522 1086 1298 3736 MCS [18]
NELDER (Han) 3.0 2.2 1.2 1.1 1.1 1.1 1.1 1.1 1.1 1.0 NELDER (Han) [16]
NELDER (Doe) 3.2 2.2 1.2 1 1 1 1 1 1 1 NELDER (Doe) [5]
NEWUOA 2.3 1.9 3.1 4.3 6.5 7.3 8.5 10 10 11 NEWUOA [31]
(1+1)-ES 6.3 5.3 8678 24076 76637 1.52e5 4.35e5 13e-2 /1e6 . . (1+1)-ES [1]
POEMS 109 90 303 542 1442 2068 2359 3198 3729 6436 POEMS [20]
PSO 23 26 182 285 477 654 855 986 1109 1915 PSO [7]
PSO Bounds 21 24 535 768 744 834 1532 1879 1938 2096 PSO Bounds [8]
Monte Carlo 23 55 112 687 3906 44460 1.30e5 3.78e5 61e-4 /1e6 . Monte Carlo [3]
Rosenbrock 4.8 2.8 3.1 3.4 3.2 3.0 2.9 2.8 3.2 3.0 Rosenbrock [27] VNS (Garcia) 22 25 17 12 12 11 10 9.4 9.1 8.3 VNS (Garcia) [11] T n ° 0 3 8 3
B
O
B
2
0
0
9
:
C
o
m
pa
ri
so
n
T
a
bl
es
o
f
A
ll
A
lg
o
ri
th
m
s
o
n
A
ll
N
o
is
el
es
s
F
u
n
ct
io
n
s1
Table 11: Running time excess ERT/ERTbest on f
11in 2-D, in italics is given the median final function value and the median number
of function evaluations to reach this value divided by dimension
11 Discus
∆ftarget 1e+03 1e+02 1e+01 1e+00 1e-01 1e-02 1e-03 1e-04 1e-05 1e-07 ∆ftarget
ERTbest/D 4.7 5.7 18 22 25 31 34 38 41 49 ERTbest/D
ALPS-GA 17 40 35 80 202 412 882 1151 1735 3391 ALPS-GA [17]
AMaLGaM IDEA 4.8 5.4 3.0 3.5 4.2 3.9 4.2 4.4 4.4 4.6 AMaLGaM IDEA [4]
BayEDAcG 9.3 18 31 148 1121 14e-1 /2e3 . . . . BayEDAcG [10]
BIPOP-CMA-ES 4.7 8.7 7.9 8.8 9.2 8.2 8.0 7.6 7.5 6.8 BIPOP-CMA-ES [15]
BFGS 1.6 1.7 1.2 1.6 2.0 1.7 1.9 2.7 5.7 36 BFGS [30]
Cauchy EDA 13 15 6.7 7.4 8.1 8.0 8.3 8.1 8.9 9.0 Cauchy EDA [24]
(1+1)-CMA-ES 4.8 5.9 5.8 6.4 6.6 5.7 5.6 5.4 5.1 4.7 (1+1)-CMA-ES [2]
DASA 15 15 9043 39511 53951 56697 53194 49726 47414 41516 DASA [19]
DEPSO 24 34 34 105 45e-2 /2e3 . . . DEPSO [12]
DIRECT 3.3 5.1 2.6 5.2 28 49 58 193 274 458 DIRECT [25]
EDA-PSO 8.6 27 96 264 461 991 1910 2850 6542 36e-6 /1e5 EDA-PSO [6]
full NEWUOA 1.6 3.5 2.7 4.4 6.2 6.2 7.0 7.7 8.0 8.6 full NEWUOA [31]
G3-PCX 10 9.1 10 25 28 36 35 33 32 27 G3-PCX [26]
simple GA 20 57 53 218 5039 45928 14e-2 /1e5 . . . simple GA [22]
GLOBAL 17 23 9.2 7.5 6.9 5.8 5.4 4.9 4.6 4.0 GLOBAL [23]
iAMaLGaM IDEA 4.5 6.0 2.8 3.3 4.0 3.8 4.0 3.9 3.9 4.0 iAMaLGaM IDEA [4]
IPOP-SEP-CMA-ES 5.4 6.9 13 17 17 14 13 13 12 11 IPOP-SEP-CMA-ES [29]
LSfminbnd 2.1 1.8 497 2889 5548 96e-1 /1e4 . . . . LSfminbnd [28]
LSstep 1.0 1 378 1778 2576 81e-1 /1e4 . . . . LSstep [28]
MA-LS-Chain 12 15 11 18 23 21 20 20 20 17 MA-LS-Chain [21]
MCS 1 1.1 87 124 166 296 920 1283 2042 91e-5 /3e4 MCS [18]
NELDER (Han) 2.0 2.1 1.0 1.1 1.1 1.0 1.1 1.1 1.1 1.0 NELDER (Han) [16]
NELDER (Doe) 2.2 2.4 1 1 1 1 1 1 1 1 NELDER (Doe) [5]
NEWUOA 1.2 1.5 1.5 3.2 5.5 6.1 6.9 7.7 8.4 11 NEWUOA [31]
(1+1)-ES 4.2 853 7687 20883 60012 2.26e5 4.40e5 63e-3 /1e6 . . (1+1)-ES [1]
POEMS 55 83 1037 1399 2113 2805 3995 6496 7947 7122 POEMS [20]
PSO 10 23 478 531 664 673 856 1047 1287 1876 PSO [7]
PSO Bounds 11 21 3228 5208 6281 5463 6735 6297 6082 5474 PSO Bounds [8]
Monte Carlo 16 51 94 872 6299 42870 2.12e5 97e-4 /1e6 . . Monte Carlo [3]
Rosenbrock 2.3 2.9 2.4 2.7 3.0 2.7 2.6 2.5 2.6 2.5 Rosenbrock [27] VNS (Garcia) 8.4 14 12 12 12 11 10 10 9.4 8.6 VNS (Garcia) [11] T n ° 0 3 8 3
B
O
B
2
0
0
9
:
C
o
m
pa
ri
so
n
T
a
bl
es
o
f
A
ll
A
lg
o
ri
th
m
s
o
n
A
ll
N
o
is
el
es
s
F
u
n
ct
io
n
s1
Table 12: Running time excess ERT/ERTbest on f
12in 2-D, in italics is given the median final function value and the median number
of function evaluations to reach this value divided by dimension
12 Bent cigar
∆ftarget 1e+03 1e+02 1e+01 1e+00 1e-01 1e-02 1e-03 1e-04 1e-05 1e-07 ∆ftarget
ERTbest/D 5.0 9.2 18 23 38 47 52 63 76 97 ERTbest/D
ALPS-GA 19 37 38 51 76 94 130 211 227 374 ALPS-GA [17]
AMaLGaM IDEA 5.4 4.1 5.6 13 17 17 17 18 16 15 AMaLGaM IDEA [4]
BayEDAcG 40 26 66 87 67e-2 /2e3 . . . BayEDAcG [10]
BIPOP-CMA-ES 6.0 6.1 7.5 12 10 9.1 9.0 11 10 8.2 BIPOP-CMA-ES [15]
BFGS 1.8 1.1 1.2 3.2 3.1 2.9 2.8 2.6 2.4 4.2 BFGS [30]
Cauchy EDA 11 10 13 24 19 18 18 17 15 14 Cauchy EDA [24]
(1+1)-CMA-ES 4.9 7.0 9.0 13 10 8.9 8.7 7.6 6.5 5.6 (1+1)-CMA-ES [2]
DASA 16 64 2587 6771 6085 8767 14045 11796 9749 7895 DASA [19]
DEPSO 17 16 40 55 51 48 45 40 35 45 DEPSO [12]
DIRECT 3.0 3.3 5.9 35 80 70 164 266 248 287 DIRECT [25]
EDA-PSO 11 24 39 98 159 304 794 1043 1012 821 EDA-PSO [6]
full NEWUOA 1.4 1.9 4.4 5.2 3.8 3.4 3.3 3.0 2.7 2.4 full NEWUOA [31]
G3-PCX 9.1 6.1 12 29 34 34 32 31 29 28 G3-PCX [26]
simple GA 23 39 89 171 575 1009 2406 2659 2227 1873 simple GA [22]
GLOBAL 11 11 7.8 8.3 7.2 6.3 6.4 5.9 5.0 4.4 GLOBAL [23]
iAMaLGaM IDEA 4.1 2.5 4.3 7.0 6.4 6.4 6.4 6.0 5.8 5.4 iAMaLGaM IDEA [4]
IPOP-SEP-CMA-ES 7.4 9.2 7.2 10 10 8.8 8.5 8.1 7.0 6.3 IPOP-SEP-CMA-ES [29]
LSfminbnd 1.7 1 564 1228 771 628 574 489 410 332 LSfminbnd [28]
LSstep 505 275 287 230 234 349 722 604 818 641 LSstep [28]
MA-LS-Chain 13 13 11 15 13 12 13 13 12 10 MA-LS-Chain [21]
MCS 1 1.1 59 49 32 26 24 28 39 30 MCS [18]
NELDER (Han) 1.9 1.4 1 1 1 1 1 1 1 1 NELDER (Han) [16]
NELDER (Doe) 2.0 1.4 1.0 1.6 1.6 1.7 1.7 1.6 1.4 1.3 NELDER (Doe) [5]
NEWUOA 1.5 1.1 1.8 2.9 2.3 2.1 2.0 1.8 1.6 1.4 NEWUOA [31]
(1+1)-ES 3.8 1518 6496 17429 23040 54745 1.27e5 2.26e5 1.90e5 25e-3 /1e6 (1+1)-ES [1]
POEMS 64 79 80 652 1051 1202 1606 2064 2911 14969 POEMS [20]
PSO 11 12 18 57 112 132 161 185 216 299 PSO [7]
PSO Bounds 12 19 220 441 391 507 685 630 560 560 PSO Bounds [8]
Monte Carlo 18 27 92 585 3204 15580 1.36e5 38e-4 /1e6 . . Monte Carlo [3]
Rosenbrock 3.3 2.9 2.4 3.6 3.0 5.4 5.1 4.5 3.9 3.3 Rosenbrock [27] VNS (Garcia) 17 17 14 13 8.8 7.5 7.1 6.4 5.6 4.9 VNS (Garcia) [11] T n ° 0 3 8 3
B
O
B
2
0
0
9
:
C
o
m
pa
ri
so
n
T
a
bl
es
o
f
A
ll
A
lg
o
ri
th
m
s
o
n
A
ll
N
o
is
el
es
s
F
u
n
ct
io
n
s1
Table 13: Running time excess ERT/ERTbest on f
13in 2-D, in italics is given the median final function value and the median number
of function evaluations to reach this value divided by dimension
13 Sharp ridge
∆ftarget 1e+03 1e+02 1e+01 1e+00 1e-01 1e-02 1e-03 1e-04 1e-05 1e-07 ∆ftarget
ERTbest/D 0.50 2.3 11 18 23 30 35 42 47 61 ERTbest/D
ALPS-GA 1.3 3.2 13 47 103 171 300 1251 3742 29283 ALPS-GA [17]
AMaLGaM IDEA 1.1 3.4 2.6 3.2 3.6 3.7 3.9 4.0 3.9 4.1 AMaLGaM IDEA [4]
BayEDAcG 1.4 2.4 52 139 573 949 11e-1 /2e3 . . . BayEDAcG [10]
BIPOP-CMA-ES 1.3 4.3 3.2 5.4 5.7 5.9 6.4 6.1 6.6 7.0 BIPOP-CMA-ES [15]
BFGS 1.2 5.0 6.8 15 45 74 165 664 581 67e-5 /5e3 BFGS [30]
Cauchy EDA 4.1 15 7.3 7.7 7.7 8.2 8.5 8.6 8.5 8.5 Cauchy EDA [24]
(1+1)-CMA-ES 1.1 4.4 5.2 7.3 7.0 7.3 8.1 7.6 7.9 7.6 (1+1)-CMA-ES [2]
DASA 13 90 536 855 2561 4866 16292 46654 1.44e5 62e-5 /1e6 DASA [19]
DEPSO 1.1 6.1 8.4 25 63 125 18e-3 /2e3 . . . DEPSO [12]
DIRECT 1 1 2.5 4.2 5.1 8.7 24 49 74 121 DIRECT [25]
EDA-PSO 1.4 3.5 6.4 42 180 274 710 3977 31188 27e-5 /1e5 EDA-PSO [6]
full NEWUOA 1.5 5.2 8.5 12 31 76 140 293 758 1845 full NEWUOA [31]
G3-PCX 1.2 3.9 13 30 36 47 50 55 70 61 G3-PCX [26]
simple GA 1.3 3.7 25 173 1090 22373 25e-3 /1e5 . . . simple GA [22]
GLOBAL 1.3 2.8 9.2 9.3 7.3 6.0 13 67e-5 /400 . . GLOBAL [23]
iAMaLGaM IDEA 1.1 3.3 2.6 3.1 3.6 3.3 3.6 3.6 3.6 3.7 iAMaLGaM IDEA [4]
IPOP-SEP-CMA-ES 1.1 3.7 13 20 18 15 14 14 13 11 IPOP-SEP-CMA-ES [29]
LSfminbnd 1 16 52 112 167 474 849 13e-3 /1e4 . . LSfminbnd [28]
LSstep 28 419 284 573 1041 1508 35e-2 /1e4 . . . LSstep [28]
MA-LS-Chain 1.1 3.3 8.7 17 18 21 23 21 19 22 MA-LS-Chain [21]
MCS 1 4.7 23 20 165 958 2161 2533 75e-4 /3e4 . MCS [18]
NELDER (Han) 1.7 1.6 1 1 1 1 1 1 1 1 NELDER (Han) [16]
NELDER (Doe) 1.3 2.2 1.1 1.1 1.0 1.0 1.0 1.0 1.1 1.0 NELDER (Doe) [5]
NEWUOA 1.6 2.8 6.3 10 22 25 72 62 91 147 NEWUOA [31]
(1+1)-ES 1.9 31 37 94 208 371 795 4207 8102 37041 (1+1)-ES [1]
POEMS 171 110 48 93 142 330 1100 2267 6252 23556 POEMS [20]
PSO 1.6 3.3 9.0 27 76 142 327 1087 2899 10921 PSO [7]
PSO Bounds 1.1 3.8 9.2 43 122 260 621 1244 2987 93e-7 /1e5 PSO Bounds [8]
Monte Carlo 1.6 5.4 18 279 11643 1.12e5 32e-3 /1e6 . . . Monte Carlo [3]
Rosenbrock 3.2 4.8 5.6 7.0 7.5 18 28 43 70 168 Rosenbrock [27] VNS (Garcia) 1.4 3.9 8.8 10 10 8.8 9.2 9.1 8.6 8.4 VNS (Garcia) [11] T n ° 0 3 8 3
B
O
B
2
0
0
9
:
C
o
m
pa
ri
so
n
T
a
bl
es
o
f
A
ll
A
lg
o
ri
th
m
s
o
n
A
ll
N
o
is
el
es
s
F
u
n
ct
io
n
s2
Table 14: Running time excess ERT/ERTbest on f
14in 2-D, in italics is given the median final function value and the median number
of function evaluations to reach this value divided by dimension
14 Sum of different powers
∆ftarget 1e+03 1e+02 1e+01 1e+00 1e-01 1e-02 1e-03 1e-04 1e-05 1e-07 ∆ftarget
ERTbest/D 0.50 0.50 0.70 3.7 8.1 12 19 28 34 45 ERTbest/D
ALPS-GA 1 1 1.6 2.4 14 60 75 83 131 528 ALPS-GA [17]
AMaLGaM IDEA 1 1.2 1.6 3.3 3.9 4.7 4.2 3.9 3.8 4.2 AMaLGaM IDEA [4]
BayEDAcG 1 1 1.9 1.8 10 25 67 98 181 12e-5 /2e3 BayEDAcG [10]
BIPOP-CMA-ES 1 1.1 1.9 2.5 3.0 4.2 4.6 5.3 5.5 7.1 BIPOP-CMA-ES [15]
BFGS 1 1.4 2.1 2.8 1.8 1.7 1.4 1.1 1.0 6.0 BFGS [30]
Cauchy EDA 1 4.6 13 13 12 11 10 8.6 8.9 8.5 Cauchy EDA [24]
(1+1)-CMA-ES 1 1.4 1.7 3.1 3.4 3.6 4.0 3.9 4.4 4.7 (1+1)-CMA-ES [2]
DASA 1 18 22 22 16 18 33 592 9261 3.11e5 DASA [19]
DEPSO 1 1 1.4 5.2 10 16 17 18 55 17e-7 /2e3 DEPSO [12]
DIRECT 1 1 1 1.3 2.1 2.8 6.0 8.6 12 32 DIRECT [25]
EDA-PSO 1 1.2 1.4 2.9 8.2 12 15 74 157 1077 EDA-PSO [6]
full NEWUOA 1 1.4 3.2 1.4 1 1 1 1.1 1.5 3.7 full NEWUOA [31]
G3-PCX 1 1.2 1.8 6.3 6.3 5.9 6.6 7.6 9.1 11 G3-PCX [26]
simple GA 1 1.1 1.0 4.0 41 199 276 630 3161 58e-7 /1e5 simple GA [22]
GLOBAL 1 1.1 1.7 5.5 13 13 8.8 6.2 8.2 34e-7 /300 GLOBAL [23]
iAMaLGaM IDEA 1 1.5 1.6 3.7 3.9 4.0 3.9 3.4 3.5 3.6 iAMaLGaM IDEA [4]
IPOP-SEP-CMA-ES 1 1.2 1.6 1.8 4.4 4.9 7.4 10 10 11 IPOP-SEP-CMA-ES [29]
LSfminbnd 1 1.3 4.7 5.4 3.0 6.2 76 1501 23e-5 /1e4 . LSfminbnd [28]
LSstep 1 55 40 73 50 124 1561 5059 23e-4 /1e4 . LSstep [28]
MA-LS-Chain 1 1.3 1.7 3.1 10 15 13 12 12 17 MA-LS-Chain [21]
MCS 1 1 1 1 1.4 1.7 2.8 3.1 23 8174 MCS [18]
NELDER (Han) 1 1.5 2.1 1.4 1.4 1.4 1.2 1.0 1.0 1.1 NELDER (Han) [16]
NELDER (Doe) 1 1.1 1.3 1.4 1.3 1.3 1.1 1 1 1 NELDER (Doe) [5]
NEWUOA 1 1.1 3.7 2.4 1.6 1.5 1.6 1.8 2.1 5.4 NEWUOA [31]
(1+1)-ES 1 1.7 2.3 2.5 2.5 3.4 9.2 156 3405 22e-7 /1e6 (1+1)-ES [1]
POEMS 1 136 192 86 73 155 178 184 335 3279 POEMS [20]
PSO 1 1.1 1.4 4.8 13 25 36 48 85 1732 PSO [7]
PSO Bounds 1 1.1 1.5 2.7 14 45 72 114 181 1178 PSO Bounds [8]
Monte Carlo 1 1 1.8 2.6 31 556 7246 1.08e5 4.17e5 15e-5 /1e6 Monte Carlo [3]
Rosenbrock 1 2.2 4.0 1.9 1.6 1.6 1.9 1.8 2.4 3.0 Rosenbrock [27] VNS (Garcia) 1 1 2.1 6.2 10 9.4 9.0 8.1 8.6 9.3 VNS (Garcia) [11] T n ° 0 3 8 3
B
O
B
2
0
0
9
:
C
o
m
pa
ri
so
n
T
a
bl
es
o
f
A
ll
A
lg
o
ri
th
m
s
o
n
A
ll
N
o
is
el
es
s
F
u
n
ct
io
n
s2
Table 15: Running time excess ERT/ERTbest on f
15in 2-D, in italics is given the median final function value and the median number
of function evaluations to reach this value divided by dimension
15 Rastrigin
∆ftarget 1e+03 1e+02 1e+01 1e+00 1e-01 1e-02 1e-03 1e-04 1e-05 1e-07 ∆ftarget
ERTbest/D 0.50 0.60 19 146 517 533 556 582 616 706 ERTbest/D
ALPS-GA 1.1 1.6 2.7 6.8 3.4 4.8 5.7 7.1 7.9 9.1 ALPS-GA [17]
AMaLGaM IDEA 1.1 2.8 1.1 4.3 2.7 2.8 2.8 2.7 2.6 2.3 AMaLGaM IDEA [4]
BayEDAcG 1 2.2 2.1 8.2 7.6 26 16e-2 /2e3 . . . BayEDAcG [10]
BIPOP-CMA-ES 1.2 2.9 1.1 1.8 2.1 2.2 2.2 2.1 2.1 1.9 BIPOP-CMA-ES [15]
BFGS 1.2 17 4.2 4.6 7.9 7.7 7.3 7.0 6.6 5.8 BFGS [30]
Cauchy EDA 9.1 38 4.9 2.9 3.2 11 14 14 13 12 Cauchy EDA [24]
(1+1)-CMA-ES 1.2 2.8 22 7.7 7.6 7.4 7.1 6.8 6.5 5.7 (1+1)-CMA-ES [2]
DASA 4.6 22 64 84 64 62 60 57 54 48 DASA [19]
DEPSO 1.1 1.6 2.9 3.8 1.7 2.2 2.5 2.6 3.0 6.3 DEPSO [12]
DIRECT 1 1 1.0 1 1 1 1 1 1 1 DIRECT [25]
EDA-PSO 1 3.3 2.0 9.3 6.1 8.3 8.3 8.5 8.4 8.1 EDA-PSO [6]
full NEWUOA 1.2 3.1 1.5 1.4 3.5 3.4 3.3 3.1 3.0 2.6 full NEWUOA [31]
G3-PCX 1.1 2.3 7.8 13 22 21 20 19 18 16 G3-PCX [26]
simple GA 1.2 2.3 4.2 18 13 34 96 98 102 123 simple GA [22]
GLOBAL 1.1 2.6 3.0 1.6 2.6 2.5 2.4 2.3 2.2 2.0 GLOBAL [23]
iAMaLGaM IDEA 1.1 2.5 1 4.2 5.1 5.1 5.0 4.8 4.6 4.1 iAMaLGaM IDEA [4]
IPOP-SEP-CMA-ES 1 3.8 1.5 2.9 2.1 2.2 2.2 2.1 2.1 1.9 IPOP-SEP-CMA-ES [29]
LSfminbnd 1.1 6.2 3.7 20 36 51 66 207 71e-2 /9e3 . LSfminbnd [28]
LSstep 1.1 47 171 196 80 79 77 74 71 63 LSstep [28]
MA-LS-Chain 1.1 2.0 1.7 1.9 1.6 1.5 1.5 1.5 1.4 1.3 MA-LS-Chain [21]
MCS 1 1 2.1 3.5 1.4 1.4 1.3 1.3 1.2 1.1 MCS [18]
NELDER (Han) 1 1.9 8.4 7.3 10 9.4 9.0 8.6 8.2 7.1 NELDER (Han) [16]
NELDER (Doe) 1 3.2 1.1 1.3 1.4 1.3 1.3 1.2 1.2 1.0 NELDER (Doe) [5]
NEWUOA 1.1 11 4.1 3.4 3.3 3.2 3.0 2.9 2.7 2.4 NEWUOA [31]
(1+1)-ES 1.4 3.7 1.1 5.3 8.4 8.2 7.9 7.5 7.1 6.3 (1+1)-ES [1]
POEMS 28 116 16 19 18 20 21 21 22 22 POEMS [20]
PSO 1.1 2.4 1.9 4.1 16 16 16 16 16 15 PSO [7]
PSO Bounds 1.2 2.3 1.7 6.6 3.9 7.3 9.2 11 11 12 PSO Bounds [8]
Monte Carlo 1.1 2.1 2.4 64 148 1467 5753 12221 50e-4 /1e6 . Monte Carlo [3]
Rosenbrock 1.3 19 15 10 10 9.2 8.9 8.5 8.0 7.0 Rosenbrock [27] VNS (Garcia) 1 3.3 3.4 1.9 2.4 2.4 2.3 2.4 2.7 3.7 VNS (Garcia) [11] T n ° 0 3 8 3
B
O
B
2
0
0
9
:
C
o
m
pa
ri
so
n
T
a
bl
es
o
f
A
ll
A
lg
o
ri
th
m
s
o
n
A
ll
N
o
is
el
es
s
F
u
n
ct
io
n
s2
Table 16: Running time excess ERT/ERTbest on f
16in 2-D, in italics is given the median final function value and the median number
of function evaluations to reach this value divided by dimension
16 Weierstrass
∆ftarget 1e+03 1e+02 1e+01 1e+00 1e-01 1e-02 1e-03 1e-04 1e-05 1e-07 ∆ftarget
ERTbest/D 0.50 0.57 4.6 25 87 163 179 195 205 269 ERTbest/D
ALPS-GA 1 1.3 2.7 5.6 9.1 14 19 25 34 37 ALPS-GA [17]
AMaLGaM IDEA 1 1.2 3.2 3.4 5.1 4.6 4.5 4.2 4.1 3.3 AMaLGaM IDEA [4]
BayEDAcG 1 1.4 1.5 10 24 39 76 71 68 108 BayEDAcG [10]
BIPOP-CMA-ES 1 1 3.1 3.5 3.5 2.5 2.4 2.3 2.3 1.9 BIPOP-CMA-ES [15]
BFGS 1 11 40 147 173 269 27e-2 /6e3 . . . BFGS [30]
Cauchy EDA 1 4.2 4.5 4.4 6.1 15 29 31 35 27 Cauchy EDA [24]
(1+1)-CMA-ES 1 1.2 6.0 2.3 2.3 5.2 8.8 12 11 12 (1+1)-CMA-ES [2]
DASA 1 9.0 29 152 183 131 205 254 335 529 DASA [19]
DEPSO 1 1.5 3.9 10 10 10 26 38 72 16e-4 /2e3 DEPSO [12]
DIRECT 1 1.4 1.6 1 1 1 1 1.5 2.0 1.9 DIRECT [25]
EDA-PSO 1 1.8 2.6 4.8 15 195 291 371 408 315 EDA-PSO [6]
full NEWUOA 1 2.5 8.1 5.9 3.9 3.2 5.5 7.6 10 16 full NEWUOA [31]
G3-PCX 1 1.4 2.8 8.9 3.1 4.5 4.8 5.0 5.3 11 G3-PCX [26]
simple GA 1 1.2 2.0 4.1 16 42 178 445 686 693 simple GA [22]
GLOBAL 1 1.7 3.9 5.1 2.4 1.4 1.5 1.4 1.7 1.5 GLOBAL [23]
iAMaLGaM IDEA 1 1.1 1 6.9 7.4 9.1 9.2 8.6 8.3 7.0 iAMaLGaM IDEA [4]
IPOP-SEP-CMA-ES 1 1.8 3.2 4.1 2.4 2.9 4.0 3.8 3.9 3.3 IPOP-SEP-CMA-ES [29]
LSfminbnd 1 3.6 5.6 5.7 5.4 8.3 14 33 38 107 LSfminbnd [28]
LSstep 1 1.5 1.6 11 23 63 70 155 199 152 LSstep [28]
MA-LS-Chain 1 1.2 1.3 3.6 4.2 6.4 10 11 10 8.3 MA-LS-Chain [21]
MCS 1 1.1 5.1 6.7 2.7 4.3 6.8 10 29 115 MCS [18]
NELDER (Han) 1 1.3 1.2 7.6 4.4 4.7 4.3 4.0 3.8 2.9 NELDER (Han) [16]
NELDER (Doe) 1 1.1 1.6 3.5 1.8 1.1 1.1 1 1 1 NELDER (Doe) [5]
NEWUOA 1 2.4 9.0 10 6.8 6.9 22 37 44 77 NEWUOA [31]
(1+1)-ES 1 1.7 35 38 35 33 56 73 84 122 (1+1)-ES [1]
POEMS 1 98 71 648 201 113 112 107 107 88 POEMS [20]
PSO 1 1.7 2.5 3.8 6.1 101 94 88 86 69 PSO [7]
PSO Bounds 1 1.2 2.8 6.4 11 113 123 121 121 103 PSO Bounds [8]
Monte Carlo 1 1.2 2.3 5.0 20 137 1202 24254 71559 18e-5 /1e6 Monte Carlo [3]
Rosenbrock 1 10 33 36 33 27 79 295 19e-4 /8e3 . Rosenbrock [27]
VNS (Garcia) 1 1.2 4.6 5.0 4.8 4.9 4.7 4.7 5.6 6.8 VNS (Garcia) [11] T n ° 0 3 8 3