WORKING
PAPERS
SES
N. 469
V.2016
FacultédesscienceséconomiquesetsocialesWirtschaFts- undsozialWissenschaFtliche Fakultät
Evaluating an information
campaign about rural
development policies in
(FYR) Macedonia
Martin Huber,
Ana Kotevska,
Aleksandra Martinovska
Stojcheska,
1
Evaluating an information campaign
about rural development policies in (FYR) Macedonia
Martin Hubera, Ana Kotevskab,
Aleksandra Martinovska Stojcheskab, Anna Solovyevaa
a Department of Economics, University of Fribourg, Switzerland
b Institute of Agricultural Economics, University Ss. Cyril and Methodius in Skopje, FYR
Macedonia
Abstract
This paper investigates the effects of an information campaign about a governmental rural development program (RDP) in the Former Yugoslav Republic of Macedonia on the farmers’ intention to participate in the RDP. In the course of a survey among farmers, the treatment group received an information brochure with relevant details on selected RDP measures, while the control group received no information. Even though the intervention had been planned as experiment, randomization was not properly conducted, requiring sample adjustments and controlling for observed covariates in the estimation process. The results suggest that while the intervention succeeded in informing farmers, it had a negative, albeit marginally statically significant, effect on farmers’ reported possibility and intention to use RDP support in the near future. Evidence from further outcome variables suggests that this may be due to the information about administrative burden associated with RDP participation provided in the brochure. We also find that the negative effect is driven by the subsample of unprofitable farmers.
Keywords: information provision, rural development, FYR Macedonia, field
experiment, treatment effects
JEL classification: Q28
We have benefited from comments by seminar participants in Fribourg. Addresses for correspondence: Martin Huber (martin.huber@unifr.ch), University of Fribourg, Department of Economics, Bd. de Pérolles 90, 1700 Fribourg, Switzerland; Ana Kotevska (ana.kotevska@fznh.ukim.edu.mk), University Ss. Cyril and Methodius in Skopje, Faculty of Agricultural Sciences and Food, Institute of Agricultural Economics, blvd. Aleksandar Makedonski bb, Skopje 1000, FYR Macedonia; Aleksandra Martinovska Stojcheska (sanims@gmail.com), University Ss. Cyril and Methodius in Skopje, Faculty of Agricultural Sciences and Food, Institute of Agricultural Economics, blvd. Aleksandar Makedonski bb, Skopje 1000, FYR Macedonia; Anna Solovyeva (anna.solovyeva@unifr.ch), University of Fribourg, Department of Economics, Bd. de Pérolles 90, 1700 Fribourg, Switzerland. We acknowledge financial support by the “Regional Research Promotion Programme – Western Balkans”, which is operated by the Interfaculty Institute for Central and Eastern Europe (IICEE) at the University of Fribourg and funded by the Swiss Agency for Development and Cooperation (SDC), Federal Department of Foreign Affairs.
2 1 Introduction
This paper aims at assessing the effects of an information campaign about a governmental rural development program (RDP) in the former Yugoslav Republic (FYR) of Macedonia on targeted farmers’ intention to participate in an RDP. The information campaign consists of a brochure providing farmers with relevant details about the program measures and the application process. Based on informal exchanges with agricultural specialists in FYR Macedonia and a recent EU report (The Republic of Macedonia, EU Instrument for Pre-Accession for Rural Development (IPARD), 2013), we hypothesize that more adequate information about existing RDP measures might contribute to an increased number of farmers applying for the program. Thus, we examine whether the direct provision of information about the RDP increases farmers’ willingness to apply and participate in the program. Previous studies in development and agricultural economics examine various aspects of the provision of agricultural information to farmers, such as the role of media and extension services in agricultural information access (Hassan et al., 2010; Galadima, 2014; Sani et al., 2015), farmers’ information needs (Lwoga, 2011), farmers’ attitudes towards the provision of various agricultural development instruments (Dimara & Skuras, 1999), farmers’ perceptions of the effectiveness of various information sources in information dissemination (Achuonjei et al., 2003), etc. The majority of these investigations is descriptive and does not aim at estimating the size of information provision effects, while a (nonrandomized) survey is the most commonly employed method. Although such surveys collect plenty of useful information on farmers’ attitudes and behavior, they do not permit a causal interpretation of information provision effects on policy perception and farmers’ participation. Another issue is that the generalizability of studies on agricultural information provision is limited, as agricultural policies, the economic situation of farmers, and information provision varies greatly between countries. Thus, the national context could determine the success of a particular information provision. Our paper is also related to a growing body of experimental literature on the effectiveness of randomized information campaigns in various fields of economics, e.g. in public economics (Duflo & Saez, 2003; Chetty & Saez, 2013), in labor economics (Liebman & Luttmer, 2015; Altmann et al., 2015), and in environmental
3
economics (Benders et al., 2006; Ferraro & Miranda, 2013). Most of these investigations find small to moderate effects of information campaigns on the outcomes of interest (see, for instance, Benders et al., 2006; Chetty & Saez, 2013; Liebman & Luttmer, 2015; Altmann et al., 2015; Denisova-Schmidt et al., 2015). However, the effectiveness of randomized information campaigns ultimately seems to depend on the field of study, context, the exact implementation of information provision (e.g. tools, design, etc.), and subjects’ motivation (Saez, 2009; Feld et al., 2013; Fellner et al., 2013; Altmann & Traxler, 2014).
The contribution of this study is the assessment of an information campaign in the context of agricultural economics and rural development in order to evaluate how information provision affects farmers’ intention to participate in the RDP. This is motivated by the fact that application and take up rates of this program are low, despite the availability of governmental means for supporting the development of rural areas. Our study is motivated by the hypothesis that insufficient information, especially directly communicated to farmers, about RDP measures is one of the leading causes for low application rates. From a policy perspective, the study is interesting as it could shed light on how to enhance RDP participation, thus improving the implementation of agricultural policies in FYR Macedonia. If information provision does indeed increase farmers’ intention to apply for the RDP, this provides policy makers with a relatively inexpensive tool to increase RDP participation rates. Our study also investigates a further potential reason for non-participation that appears interesting from a policy perspective, namely the administrative burden of RDP projects as perceived by farmers.
The intervention is defined as receiving a brochure with relevant information about various RDP measures, developed specifically for this study in cooperation with the Agency for Financial Support of Agriculture and Rural Development in FYR Macedonia. To evaluate the intervention effects, we intended to carry out a randomized field experiment in a rural area in the Southeast region of Macedonia in May-June 2015 among 600 farmers. Around half of them received the information brochure, i.e. were “treated”, while the remaining participants comprised the control group. However, the field personnel carrying out the surveys did not strictly follow the defined randomization protocol such that brochure provision was selective. Specifically, badly informed farmers were more likely to receive the information than
4
subjects that claimed to be well informed about the governmental RDP. This can be seen both from the collected data as well as the surveyors’ reports of how they chose interviewees. To account for these issues, we (a) restrict our analysis to a subsample of relatively poorly informed farmers and (b) control for a range of observed covariates when assessing the effects of the intervention. We consider both parametric and nonparametric estimation of intervention effects based on OLS and entropy balancing as suggested by Hainmueller (2012), respectively.
Our findings suggest that according to the follow up survey conducted after the intervention, the brochure succeeded in providing information about RDP application documents and procedures. However, it had, if anything, negative (and only marginally statically significant) effects on farmers’ reported possibility and intention to make use of RDP support in the near future. This might be due to the fact that the brochure explained the administrative procedures related to RDP participation. The results suggest that treated farmers assess the statement “The RDP increases administrative work for household owners” significantly higher than non-treated ones. As also reported by local experts in informal conversations, farmers generally view the administrative costs of RDP participation as very high. Thus, the brochure might have reaffirmed preexisting beliefs among farmers about the high administrative cost associated with involvement in an RDP project. Furthermore, we find some heterogeneity of effects when looking at profitable versus unprofitable farmers. The rather negative effect of the intervention on farmers’ intention to use RDP support and the positive effect on their valuation of increased administrative work due to RDP participation seem to be driven by the subgroup of unprofitable farmers. For the latter, the brochure had pronounced negative effects on the self-assessed possibility and intention to apply for the RDP (and some of them are statistically significant) and a significantly positive effect on the perceived administrative burden. As for the group of profitable farmers, the treatment had significant positive effects only on reported possession of sufficient information, as well as knowledge and experience to independently prepare an RDP application, but did generally not affect any other outcomes.
The remainder of this paper is organized as follows. Section 2 provides some institutional background on the agricultural sector in FYR Macedonia and the RDP.
5
Section 3 explains how the survey was conducted, while Section 4 describes the collected data. The results are presented in Section 5. Section 6 concludes.
2 Institutional context
2.1 Rural areas and agricultural sector in FYR Macedonia
FYR Macedonia is a small transitional economy that is landlocked and located in the Western Balkans region. The country experienced a sharp economic decline after the breakup of Yugoslavia in 1990: Macedonian GDP dropped by more than 30% in 1991-1995 (The Republic of Macedonia, EU Instrument for Pre-Accession for Rural Development (IPARD), 2013, p.23). A number of reforms, including privatization, were conducted, so that FYR Macedonia would transition from a planned to market economy. This led to a partial recovery in the period 1995-2000. Today, the country’s economy grows at a rate of around 4% annually and inflation is low at less than 1% (Republic of Macedonia State Statistical Office, 2015). However, many issues still remain, including a high unemployment rate of about 30% (Republic of Macedonia State Statistical Office, 2015), low income, poverty, external trade imbalance, and low foreign direct investment. Another concern is the gap between urban and rural standards of living and poverty in rural areas1, where almost half of the country’s poor are located (The Republic of Macedonia, EU Instrument for Pre-Accession for Rural Development (IPARD), 2013, p.28).
Agriculture remains an important economic sector in FYR Macedonia: together with forestry and fishing, it accounts for about 15% of the national gross value added and 17% of total employment2 (Republic of Macedonia State Statistical Office, 2015).The
economic transition described above impacted rural Macedonia, with agriculture as its main economic activity, strongly and the consequences are still evident. The
1 Rural areas are municipalities in which all settlements have less than 30,000 inhabitants or population density is less than or equal to 150 inh./km2 of the municipality area (as defined by the Law of Agriculture and Rural Development, 2010). The State Statistical Office produces data on rural areas based on criteria from the Law on Territorial Organization (2004) defining cities and villages based on population size, infrastructural development and the share of primary sectors in employment, which is quite a different approach (Kotevska, Bogdanov, et al., 2015).
2 For comparison, agriculture, forestry and fishing constitute less than 2% of total GDP and about 5% of total employment in the EU-27 (The World Bank, World Development Indicators, 2015).
6
ongoing trend of out-migration from rural areas has led to a situation where mostly old and less educated, i.e. those who have low chances of finding better life in cities or abroad, are left in villages. In rural areas, the number of young people (0 to 19 years) declined from 41% to 32%, while the population aged 65 and above increased from 8% to almost 11% between 1981 and 2002 (The Republic of Macedonia, EU Instrument for Pre-Accession for Rural Development (IPARD), 2013, p.26). Unfavorable education structure, poor qualifications and insufficient professional skills of the economically active population are considered to be among the factors limiting the potential of rural development (Kotevska, Bogdanov, et al., 2015, p.24). According to the 1994 census, about 27% of the village and farming population had not completed primary education, while 10.5% were illiterate (The Republic of Macedonia, EU Instrument for Pre-Accession for Rural Development (IPARD), 2013, p.27). More recent data show that 12% of the rural population did not have primary education (Kotevska, Bogdanov, et al., 2015, p.24). Among agricultural producers, smallholder farmers have the lowest educational and professional levels (The Republic of Macedonia, EU Instrument for Pre-Accession for Rural Development (IPARD), 2013, p.27).
Rural employment is dominated by agricultural workers, occupied primarily in subsistence farming. Almost half of all workers are unpaid family workers (The Republic of Macedonia, EU Instrument for Pre-Accession for Rural Development (IPARD), 2013, p. 28). Agricultural production has been historically dominated by small-scale farming, which together with farm fragmentation leads to inefficient use of agricultural land (Dimitrievski et al., 2014). Other crucial issues for the rural economy include poor diversification of economic activities, insufficient investments in infrastructure and limited access to markets and sources of finance (Kotevska, Bogdanov, et al., 2015). All these factors result in low productivity of the agricultural sector in FYR Macedonia.
2.2 Agricultural policy and rural development programs
After its independence from Yugoslavia, FYR Macedonia experienced turbulent agricultural policies with many reforms and ad hoc policy decisions. In 2005, the country received the status of a European Union (EU) candidate. This new trend of European integration brought changes in the national agricultural policy which had to
7
be adjusted to the EU Common Agricultural Policy (CAP). Therefore, FYR Macedonia focused on the harmonization of the national policy for development of agriculture and rural areas. The rural development policy is to a large extent harmonized with (the second pillar of) the CAP and has four priority areas and instruments to support them: (i) increasing the competitiveness of the agricultural and forest holdings; (ii) protecting and improving the environment and rural areas; (iii) improving the quality of life and encouraging diversification of economic activities in rural areas; and (iv) supporting local development (Dimitrievski et al., 2014, p.128). In addition, rural development is financed by the EU via the Instrument for Pre-Accession Assistance for Rural Development (IPARD) (ibid), which is not investigated in this study.
Since the 2008 introduction of new rural development measures, the Ministry of Agriculture, Forestry and Water Economy (MAFWE) has been preparing and announcing annual programs for rural development. The rural development budget is planned on an annual basis and realized through several (up to eight) calls per year. However, due to the fact that investments require much time to be organized and implemented, as well as due to limited institutional capacity, budget transfers planned for one year are often conducted only in successive years.
In the period 2008 to 2014, projects of about 31.4 million EUR were funded under the national program for rural development (see Table 1). In the first few years of implementation, the budget was mainly used to increase competitiveness of agricultural holdings, mostly through farm modernization of primary producers. In 2014, a substantial increase in the budget was devoted towards the agri-food processing sectors and for improving the quality of life and infrastructural improvement of rural areas. According to information provided by the Agency for Financial Support in Agriculture and Rural Development, in 2014, funds for increasing competitiveness were allocated to 700 applicants (farmers and companies) of relatively small investments averaging 4’460 EUR, whereas funds for improving quality of life in rural areas were used by 130 municipalities, averaging 64’470 EUR (personal communication,May 11, 2015).
8
Table 1: Annual payments for structural and rural development in FYR Macedonia per priority area (2008-2014, in million EUR)
2008 2009 2010 2011 2012 2013 2014 Sum
Increasing the competitiveness of the agricultural and forest
holdings: 2.2 1.0 6.2 0.0 3.2 0.9 6.2 19.6 - Farm modernization 1.5 0.9 5.2 0.0 2.5 0.0 3.0 13.1 - Agrifood support (processing,
marketing) 0.6 0.1 0.9 - 0.7 0.9 3.2 6.5 Protecting and improving the
environment and rural areas 0.4 0.0 0.2 - - - 0.8 1.4 Improving the quality of life and
encouraging diversification of
economic activities in rural areas - 0.0 0.6 0.1 0.2 1.0 8.5 10.4
Structural and Rural
Development measures (Total) 2.6 1.0 6.9 0.1 3.4 2.0 15.5 31.4 Source: Own calculation based on data in the Macedonian APM database.
3 Study design
Our study is based on an information campaign conducted in the Southeast of FYR Macedonia in May-June 2015 in cooperation with the Agency for Financial Support of Agriculture and Rural Development of the Republic of Macedonia. The assessment of the campaign’s effectiveness to promote interest in the RDP is motivated by the relatively low number of applications, despite the willingness of the government to support the agricultural sector and the availability of funding.
The causal effect of information provision was intended to be evaluated by means of an experiment. We planned to randomly select 600 farmer households in the 5-7 largest villages in the chosen region. The idea was that every second household on a list of households per village would be treated, while the remaining households would comprise the control group. Thus, the treatment probability would asymptotically be independent of farmers’ characteristics (both observed and unobserved). The treatment group would receive an information brochure on selected RDP measures delivered in person, whereas the control group would receive no such brochure. A survey would be conducted for the entire sample about two weeks later, collecting
9
information on personal and farm characteristics, previous experiences with the RDP application and participation, awareness about the RDP and its potential benefits for the community and the farm, and, importantly, on the farmers’ intention to apply for RDP measures and to co-finance RDP projects in the near future.
The brochure (see Appendix B) contains information about four selected RDP measures. The face-side of the brochure presents the title and the logo of the Agency for Financial Support in Agriculture and Rural Development, the phrase “Every year the Government of the Republic of Macedonia prepares financial support programs for rural development” and three major goals of the program: modernization and structural adjustment of the agri-food sector; support of economic activities related to nature protection and development of rural areas; and transition of national agricultural policy towards the EU CAP. The rest of the brochure describes selected RDP measures along with eligibility criteria, application processes, required documents and contact details for the responsible authorities. The selected RDP measures include: (1) Support of young farmers (Measure 112); (2) Investments in farm modernization (Measure 121); (3) Investments in increasing
the economic value of forestry (Measure 122); and finally (4) Support of economic associations of farms for joint agricultural activity (Measure 131). Three of the four
listed measures require co-financing from the farmers’ side3. Measures 121 and 122 require 50% co-financing by the farmer, whereas measure 131 requires up to 20%, depending on the sub-measure (Zakon za zemjodelstvo i ruralen razvoj, 2010, pp. 17-20). Importantly, the farmer must first personally finance the full amount of investment while actual RDP support is received upon the realized costs, if previously approved to be eligible. The brochure targets various groups of farmers and provides the most relevant information regarding RDP measures and the application process. If farmers wanted to obtain more details on the program, they could contact the responsible authorities whose contacts, including address, phone number and internet links, are listed on the back of brochure.
The actual implementation of the survey deviated from the initial plan. Due to an unstable political situation and generally low levels of trust in the country, the field
3 Measure 112 Support of young farmers represents a grant of up to 600’000 Macedonian denars paid to a successful application in three installments over a three year period. Thus, co-financing is not required.
10
personnel hired by the University of Fribourg and the Association of Agricultural Economists of the Republic of Macedonia did not manage to fully follow the protocol. Reportedly, farmers were very reluctant to communicate with strangers and accept any brochures from them when the surveyors tried to approach the farmers at their homes. Therefore, instead of going to every second house when delivering the brochure, and going house-to-house to conduct the survey in pre-selected villages, the surveyors distributed information brochures in several villages in places visited by villagers, such as local shops, bars and cafés, markets, pharmacies, fields and gardens, water supply stations, etc. They distributed the brochures in person and collected contact information of farmers to survey them 1-2 weeks later. Reportedly, the brochures were more likely to be given to younger farmers, owners of small farms and those who had not had past experience with the RDP participation, who are supposedly the types of farmers one predominantly meets in public places in rural areas. The face-to-face survey for the control group took place while the brochures were still being distributed to the treatment group. Once brochure dissemination was completed, the treatment group was surveyed. Such violations of the experimental design required the restriction of the evaluation sample to a specific subset of observations and the application of estimation methods that account for the fact that the intervention was not properly randomized.
4 Data and balancing tests
In our survey, data on 597 farmer households (represented by a household head), including 292 treated and 305 non-treated farmers, were collected. The dataset contains observations from 34 villages. The variables comprise personal characteristics of the household head (age, sex and education), his/her experiences with farming activities (number of years spent working in a farm and the primary occupation), household size, a wide range of characteristics related to farming activities (farm profitability in the last three years, ease of getting a loan, dependence on subsidies to breakeven, frequency of cooperation with other agricultural producers, share of agricultural production sold on a market, share of household income coming from farming, whether there are additional workers besides family members) working on the farm, total farmed area and total livestock), as well as variables describing farmers’ previous experiences with the RDP (application in last
11
three years, use of support in last three years and received value of support). The dataset also contains indicators for receiving the information brochure, reading it, learning new facts about RDP measures from the brochure and whether the brochure motivated a farmer to consider applying for the RDP in one of the next calls.
Furthermore, a number of questions were asked to learn about farmers’ attitudes and opinions about the RDP. We use these questions as outcome variables for our analysis. One group of questions and statements is related to farmers’ willingness to apply and participate in the near future (3-5 years): “I intend to apply for the RDP in one of the next calls”, “How do you assess the possibility to use RDP support for your household (e.g. for mechanization, equipment purchase) in the next 3-5 years?”, and “How do you assess your intention to use RDP support for your household in the next 3-5 years?”.
Another group of statements is related to the farmers’ awareness and option about the RDP application process: “I have enough information to independently prepare the application (procedure and documents)”, “I have enough knowledge and experience to independently prepare the application (procedure and documents)”, “The RDP application (procedure and documents) is easy”, “The preparation of the RDP application is not expensive”, and “The RDP increases the administrative work”. Finally, third group of statements concerns the impact (mostly benefits) of the RDP: “The RDP leads to an improvement of the infrastructure in rural areas”, “The RDP leads to a protection of environment, local breeds and varieties”, “The RDP leads to larger implementation of EU standards”, “The RDP leads to higher networking among the rural population”, “The RDP leads to a stronger development of rural tourism, “The RDP increases the income of farms and rural households”, “The RDP supports the survival of small family farms”, “RDP measures are more useful measures than subsidies”, and “The principle of co-financing inherent in RDP projects is a good motivator for farmers”.
Balancing tests comparing the mean values of covariates between the treatment and control groups (see Table A1 in Appendix A) reveal statistically significant (at the 5% level) differences in age, education, years in farming, having additional (externally hired) workers on the farm, the share of agricultural production sold on a market, farm profitability, farm capacity (in hectares) and some missing indicators. This
12
clearly points to a failure of randomization. For this reason, we use a restricted sample for our evaluation based on the information about the brochure assignment process (i.e. brochures were more likely distributed to younger farmers, owners of small farms and those who had not participated in the RDP previously) provided by the field personnel and reflected in the data4. Specifically, we disregard observations
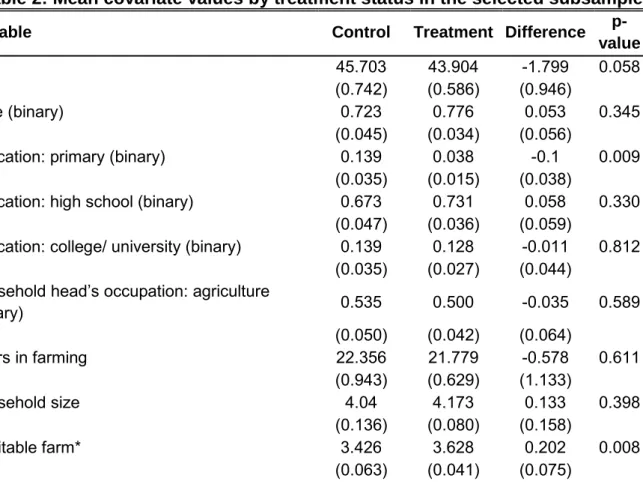
from older age groups and only keep prime-age household heads that are up to 55 years old. Furthermore, we only include households who have not previously received RDP support and do not have any employees working on their farm. As shown in Table 2, the subsample is considerably better balanced in terms of mean values of a range of selected covariates. Apart from primary education, farm profitability and a missing indicator for the share of agricultural production sold on a market, no mean is statistically significantly different across treatment states at the 5% level. We consider this subsample in our analysis of the brochure’s effect outlined further below.
Table 2:Mean covariate values by treatment status in the selected subsample
Variable Control Treatment Difference
p-value
Age 45.703 43.904 -1.799 0.058 (0.742) (0.586) (0.946)
Male (binary) 0.723 0.776 0.053 0.345 (0.045) (0.034) (0.056)
Education: primary (binary) 0.139 0.038 -0.1 0.009 (0.035) (0.015) (0.038)
Education: high school (binary) 0.673 0.731 0.058 0.330 (0.047) (0.036) (0.059)
Education: college/ university (binary) 0.139 0.128 -0.011 0.812 (0.035) (0.027) (0.044)
Household head’s occupation: agriculture
(binary) 0.535 0.500 -0.035 0.589 (0.050) (0.042) (0.064) Years in farming 22.356 21.779 -0.578 0.611 (0.943) (0.629) (1.133) Household size 4.04 4.173 0.133 0.398 (0.136) (0.080) (0.158) Profitable farm* 3.426 3.628 0.202 0.008 (0.063) (0.041) (0.075)
4 We also drop one observation with missing information on farm profitability, in order to have the same sample for the main analysis and the analysis of the heterogeneity of treatment effects by farm profitability (see Section 5.2.2).
13
Variable Control Treatment Difference
p-value
Subsidy dependent* 2.168 2.019 -0.149 0.154 (0.083) (0.063) (0.104)
Frequency of cooperation* 3.594 3.769 0.175 0.370 (0.152) (0.122) (0.195)
Share of agricultural production sold on a
market 87.891 86.436 -1.445 0.488 (1.544) (1.416) (2.095)
Share of income from farming 53.297 50.321 -2.977 0.312 (2.259) (1.878) (2.938)
Capacity: farmed area (ha) 1.695 1.601 -0.094 0.508 (0.112) (0.086) (0.142)
Capacity: total livestock (number of heads) 1.184 1.071 -0.113 0.750 (0.277) (0.221) (0.354)
Education missing (binary) 0.05 0.103 0.053 0.105 (0.022) (0.024) (0.033)
Household head’s occupation missing (binary) 0.02 0.013 -0.007 0.674 (0.014) (0.009) (0.017)
Profitable farm missing (binary) 0 0.006 0.006 0.319 (0.000) (0.006) (0.006)
Subsidy dependent missing (binary) 0 0.006 0.006 0.319 (0.000) (0.006) (0.006)
Share of agric. production sold missing
(binary) 0 0.026 0.026 0.045 (0.000) (0.013) (0.013)
Share of income from farming missing (binary) 0 0.013 0.013 0.157 (0.000) (0.009) (0.009)
Frequency of cooperation missing (binary) 0.01 0 -0.01 0.318 (0.010) (0.000) (0.010)
Number of observations 101 156 - -
Notes: Standard errors are in parentheses. *Profitable farm: "1"=Very unprofitable; "2"=Moderately unprofitable; "3"=Break-even; "4"=Moderately profitable; "5"=Very profitable. *Subsidy dependent: "1"=Not dependent; "2"=Slightly dependent; "3"=Very dependent. *Frequency of cooperation: "1"=Never; "2"=Rarely; "3"=Not sure; "4"=Sometimes; "5"=Always.
The evaluation sample includes 257 observations, out of which 156 are treated and 101 comprise the control group. As shown in Table 2, farmers are, on average, about 45 years old, predominantly males with a high school degree, and spent almost half of their life working in farming. For half of the farmers, agriculture is their main occupation. They sell most of what they produce on the market and more than half of their income comes from farming. Farms in the sample are moderately profitable or break-even and somewhat dependent on subsidies. The average farm capacity in the sample, in terms of farmed area (1.7 ha) and livestock (1.14 heads), is below national
14
average (1.9 ha and 2.14 heads respectively) (Volk et al., 2014, p.17; Dimitrievski et al., 2014, p.124). Item nonresponse was moderate. In the selected sample, there are 21 cases (8.2%) with the educational level not reported. In 4 cases (1.5%), the share of agricultural production sold on the market was missing. The number of missing values in other covariates is even smaller. For the purpose of our analysis, we introduce binary indicators for missing values in covariates, while replacing actual missing values with zeros.
5 Estimating the effects 5.1 Methods
To estimate the impact of the information brochure on farmers’ willingness to apply and participate in the RDP, as well as on other outcome variables, several econometric methods are used. First, we consider simple differences of mean outcomes between treatment and control groups. If randomization had been successful, both groups would have been comparable in all their background characteristics (both observed and unobserved) and the differences in mean outcomes across treatment groups would have been an unbiased estimate of the casual effects of the intervention. However, the randomization was not successful as discussed in Section 3 and Section 4 and even after restricting the original sample in terms of farmers’ age, previous experiences with the RDP and having employees, some characteristics are not fully balanced across treatment states.
As a second strategy, we therefore control for a range of observed characteristics when estimating the treatment effect. In this case, we rely on the conditional independence assumption (CIA), which states that after conditioning on observed characteristics that jointly affect the treatment probability and outcome, the independence of the treatment and the potential outcomes hold, such that there are no unobserved characteristics jointly affecting the treatment and the outcome (Imbens, 2004). As explained in Section 4, the probability of receiving the brochure was reportedly negatively associated with farmers’ age, farm size and previous participation in the RDP. This is why it is important to control for these and related characteristics in the estimations. Our dataset contains information about farmers’ age. Farm size can be controlled by including variables such as farmed area and
15
total livestock. Farmers who previously participated in the program are excluded from the evaluation sample.
However, we believe it is critical to account for additional characteristics that can be simultaneously related to the outcome variables and treatment probability since the brochures were more often distributed to relatively poorly informed farmers. Educational level is likely to impact both farmers’ awareness about the RDP and their potential interest in applying for agricultural support. As mentioned in Section 2.1, Macedonian small-scale farmers appear to have the lowest educational levels. Since the brochures were more often distributed to the owners of smaller farms, it is possible that those who received the brochure had lower educational levels. We also suspect that the relative importance of farming and farm profitability might affect the probability of receiving the brochure and at the same time the intention to participate. Those individuals for whom farming is the main occupation and whose income is mostly generated by farming should be more interested in obtaining information about the RDP. For this reason, household’s head occupation, the share of agricultural production sold on the market and the share of income from farming are included in the regressions. Furthermore, farm profitability and subsidy dependence should be conditioned on, since many RDP measures require co-financing. Given that it is easier for profitable and subsidy-independent farmers to co-finance a project, they might be more interested in learning about RDP measures and obtaining the brochure. Table 2 provides supporting evidence for this, as treated farmers are, on average, more likely to have profitable farms and be less subsidy-dependent. Finally, we include an indicator for the frequency of cooperation with other farmers as a control variable. More cooperative farmers might be more socially open and active which increases their chances of receiving the brochure and being interested in the RDP.
We employ two approaches to control for the observed covariates. The first is a simple OLS regression of the outcome on the treatment indicator, a constant and the covariates. However, one drawback is that OLS assumes a linear relationship between regressors and the outcome variable, which may be violated in practice. Thus, as an alternative estimation approach relying on less rigid functional form assumptions, we apply entropy balancing, a fully nonparametric multivariate
16
reweighting method developed by Hainmueller (2012)5. In the first step, a maximum
entropy reweighting scheme chooses the weights for the observations in the control group in way that their covariate means (and possibly other moments) exactly match those of the treated group (i.e. are balanced). The weights are fitted such that they are as close as possible to the uniform base weights prior optimization, so that no information is lost and efficiency is ensured (Hainmueller, 2012). In the second step, the effect is estimated as the mean difference in outcomes of the treated and reweighted controls.
5.2 Results
This section summarizes our main results. We present the effect estimates for the subsample of farmers up to 55 years of age, who do not employ additional workers and have not applied for the RDP in the last 3 years, since the background characteristics are comparably well balanced for this group, as discussed in Section 4. A binary indicator for whether farmers have read the brochure suggests that in our evaluation sample, only 5.8% of those who had received the information brochure did not read it such that noncompliance is low.
5.2.1 Main results
Table 3 presents the effects for the main outcomes of interest. Column 2 reports the mean differences in outcomes across the treatment and control groups. The estimates based on OLS and entropy balancing are provided in columns 3 and 4, respectively. The sample size for each outcome is given in the last column.
17
Table 3: Treatment effects
Outcome variable Mean
difference OLS Ebalance
Sample size
PANEL A: INTENTION TO APPLY FOR AND USE RDP SUPPORT Farmer intends to apply for
RDP in one of the next calls 0.0873 0.00531 0.0174 257 (0.0928) (0.0873) (0.114)
Possibility to use RDP in the next 3-5
years -0.0974 -0.204* -0.250* 257 (0.107) (0.106) (0.142)
Intention to use RDP in the next 3-5
years -0.0708 -0.155 -0.166 257 (0.0977) (0.0948) (0.116)
PANEL B: JUDGEMENTS ON INFORMATION AND APPLICATION PROCEDURES Farmer has enough information
to independently prepare application 0.215** 0.194** 0.187* 257 (0.0908) (0.0921) (0.106)
Farmer has enough knowledge and experience to independently prepare
application 0.153* 0.142* 0.155* 257 (0.0843) (0.0762) (0.0910)
RDP application (procedure
and documents) is easy 0.203** 0.156* 0.115 257 (0.0944) (0.0929) (0.0967)
Preparation of RDP application is not
expensive 0.116 0.0894 0.0957 256 (0.0721) (0.0670) (0.0781)
RDP increases administrative
work for household owners 0.195*** 0.153*** 0.177** 256 (0.0650) (0.0534) (0.0772)
Notes: Asymptotic standard errors in parentheses are robust to heteroscedasticity. Levels of significance are as follows: *** significant at the 1 percent level; ** significant at the 5 percent level; * significant at the 10 percent level. All the outcome variables (except for Possibility to use RDP…, and Intention to use RDP …) are measured at a five point scale: "1"=Strongly disagree; "2"=Disagree; "3"=Don't know; "4"=Agree; "5"=Strongly agree. Possibility to use RDP…, and
Intention to use RDP …are measured as: "1"= very low, "2"= low, "3"= average, "4"= strong, "5"=
very strong.
We find no statistical evidence that the brochure affected the farmers’ intended take up in the near future. For the outcome “Farmer intends to apply for the RDP in one of the next calls” the point estimates are close to zero and insignificant. Regarding the “Possibility to use the RDP in the next 3-5 years”, the OLS and entropy balancing estimates are even negative and statistically significant at the 10% level. Finally, the effect on the “Intention to use the RDP in the next 3-5 years” is negative, but not (quite) statistically significant at the 10% level.
18
The treatment effects for the outcome variables presented in Panel B of Table 3 might shed some light on why the brochure had mostly insignificant effects on the main outcomes of interest. We notice that the intervention had a positive and statistically significant effect on claiming to have sufficient information, as well as sufficient knowledge and experience to independently prepare the RDP application. Similarly, although with lower statistical significance, we find a positive treatment effect on the assessment of the application procedure as easy and not expensive. On the negative side, however, the effect on associating the RDP with increasing administrative work for household owners is positive, relatively strong, and highly statically significant. This could be one reason why the intervention did not boost farmers’ intention to use RDP support.
The information brochure contained a brief description of bureaucratic procedures related to the application and the selection process. From this treated farmers could have inferred high administrative costs of being involved in RDP projects. Local experts (namely, National Extension Agency advisors) explained that farmers had often believed RDP participation required substantial administrative work, and only those farmers who had no other opportunities to finance their investments would turn to governmental aid (see also Kotevska, Dimitrievski, et al., 2015). This suggests information in the brochure might have reaffirmed preexisting beliefs among farmers about the high administrative cost of RDP projects, and thus discouraged their participation intention.
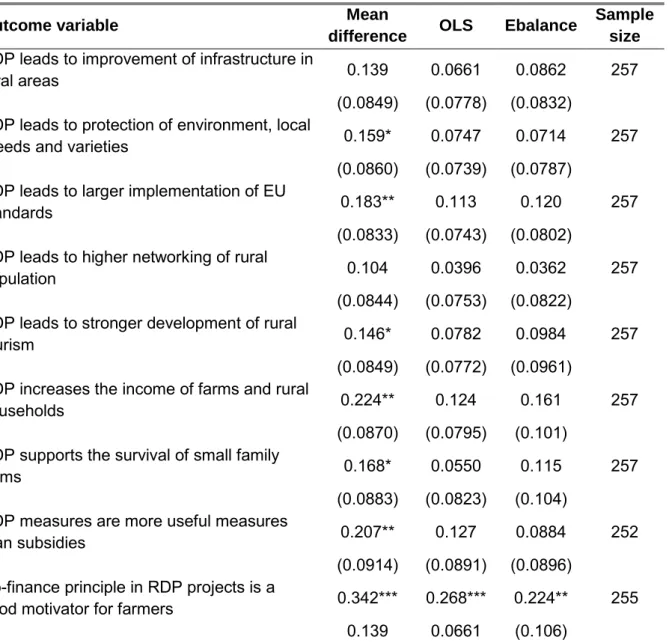
Furthermore, we analyze how the intervention affected the farmers’ assessment of various RDP benefits. Our brochure described four selected measures along with their goals, providing information about the potential advantages of the RDP. As demonstrated in Table A2 in Appendix A, the treatment had positive, but mostly statistically insignificant effects on perceived RDP benefits. One exception is the statement that the co-finance principle of RDP projects is a good motivator for farmers – the treatment effect for this outcome is relatively large in the size (about 0.3 points) and highly statistically significant. However in general, we do not find strong evidence that the brochure promoted the perks of RDP participation.
19
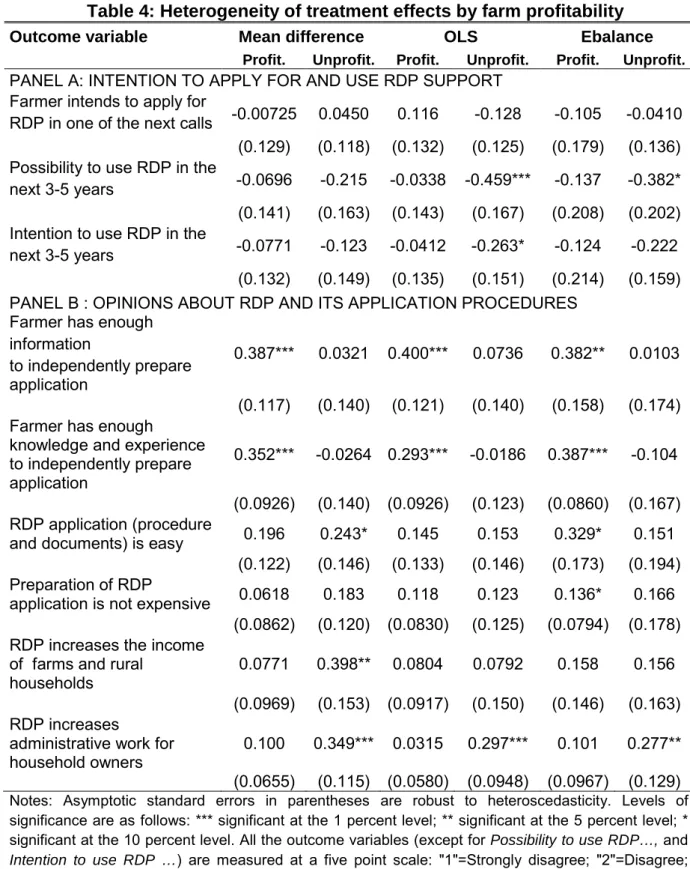
5.2.2 Heterogeneity of treatment effects by farm profitability
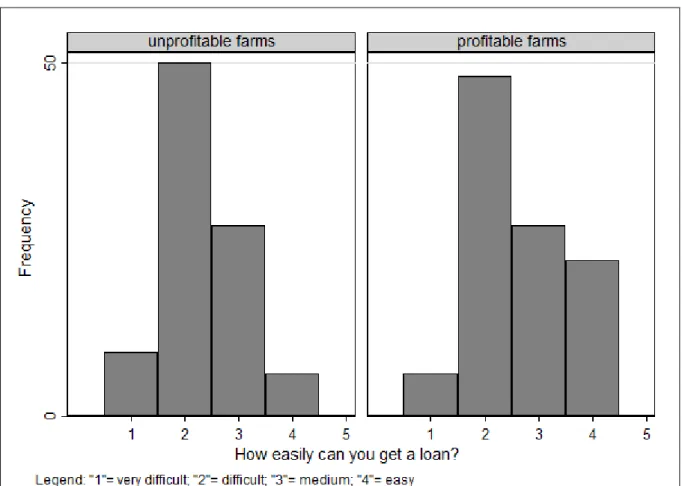
In the next step, we consider the heterogeneity of treatment effects by farm profitability6. As mentioned in Section 3, most measures presented in our information
brochure require co-financing. Given that farmers have to initially finance the full project investment from their own means and RDP support happens only after the costs are realized, it is likely that co-financing is more feasible for profitable farmers compared to unprofitable ones. Profitable farmers might have the opportunity to co-finance an RDP project either from their own profits and savings or could have an easier access to bank loans than unprofitable farmers. Figure A in Appendix A supports this hypothesis by showing that, on average, profitable farmers find it easier to get a loan than their unprofitable colleagues. Thus, we would expect the brochure might have had differential effects by farm profitability.
Our heterogeneity analysis is based on the evaluation sample as described in Section 4, which contains 106 unprofitable and 151 profitable farms7. Table 4 presents the effects by farm profitability. Concerning Panel A, for unprofitable farmers, the effects on the reported possibility and intention to use the RDP in the household are negative and statistically significant in several cases despite the small sample size. For profitable farmers, the impacts are also negative, but generally closer to zero and never statistically significant. Turning to Panel B, we find that the brochure increased the profitable farmers’ judgment about having enough information as well as knowledge and experience to independently prepare the application. Both effects are highly significant and relatively strong. At the same time, the brochure had no statically significant effect on these outcome variables for unprofitable farmers. Another finding is that among unprofitable farmers, the intervention (statistically significantly) increased the perception that the RDP brings additional administrative work for the household, while the impact is close to zero among profitable farmers.
6 The break-even farms are included in the unprofitable group.
7 Among unprofitable farmers, 56 received the brochure and 50 did not; in the group of profitable farmers, 100 were treated and 51 were not.
20
Table 4: Heterogeneity of treatment effects by farm profitability
Outcome variable Mean difference OLS Ebalance
Profit. Unprofit. Profit. Unprofit. Profit. Unprofit.
PANEL A: INTENTION TO APPLY FOR AND USE RDP SUPPORT Farmer intends to apply for
RDP in one of the next calls -0.00725 0.0450 0.116 -0.128 -0.105 -0.0410 (0.129) (0.118) (0.132) (0.125) (0.179) (0.136) Possibility to use RDP in the
next 3-5 years -0.0696 -0.215 -0.0338 -0.459*** -0.137 -0.382* (0.141) (0.163) (0.143) (0.167) (0.208) (0.202) Intention to use RDP in the
next 3-5 years -0.0771 -0.123 -0.0412 -0.263* -0.124 -0.222 (0.132) (0.149) (0.135) (0.151) (0.214) (0.159) PANEL B : OPINIONS ABOUT RDP AND ITS APPLICATION PROCEDURES
Farmer has enough information
to independently prepare application
0.387*** 0.0321 0.400*** 0.0736 0.382** 0.0103
(0.117) (0.140) (0.121) (0.140) (0.158) (0.174) Farmer has enough
knowledge and experience to independently prepare application
0.352*** -0.0264 0.293*** -0.0186 0.387*** -0.104 (0.0926) (0.140) (0.0926) (0.123) (0.0860) (0.167) RDP application (procedure
and documents) is easy 0.196 0.243* 0.145 0.153 0.329* 0.151 (0.122) (0.146) (0.133) (0.146) (0.173) (0.194) Preparation of RDP
application is not expensive 0.0618 0.183 0.118 0.123 0.136* 0.166 (0.0862) (0.120) (0.0830) (0.125) (0.0794) (0.178) RDP increases the income
of farms and rural
households 0.0771 0.398** 0.0804 0.0792 0.158 0.156 (0.0969) (0.153) (0.0917) (0.150) (0.146) (0.163) RDP increases
administrative work for
household owners 0.100 0.349*** 0.0315 0.297*** 0.101 0.277** (0.0655) (0.115) (0.0580) (0.0948) (0.0967) (0.129)
Notes: Asymptotic standard errors in parentheses are robust to heteroscedasticity. Levels of significance are as follows: *** significant at the 1 percent level; ** significant at the 5 percent level; * significant at the 10 percent level. All the outcome variables (except for Possibility to use RDP…, and
Intention to use RDP …) are measured at a five point scale: "1"=Strongly disagree; "2"=Disagree;
"3"=Don't know; "4"=Agree; "5"=Strongly agree. Possibility to use RDP…, and Intention to use RDP … are measured as: 1"= very low, "2"= low, "3"= average, "4"= strong, "5"= very strong. Ebalance: means are balanced.
In summary, unprofitable farmers seem to be less willing to make of use of the RDP and associate it to a larger extent with increased administrative work when receiving the brochure. For profitable farmers, the intervention increased claiming to possess
21
enough information, knowledge and experience to prepare the application, but did not significantly affect any other outcomes. The differential effects may be driven by the access to means of co-financing.
6 Conclusion
The present study was designed to determine the effect of a randomized information campaign on farmers’ intention to participate in a rural development program (RDP) in FYR Macedonia. We suspected that the paucity of comprehensible information about existing support measures of the RDP might be one of the reasons why farmers do not apply for the program. However, our investigation suggests that lack of adequate information about the RDP may not be the main reason for the low application rates, even though the campaign had a positive effect on feeling informed. It might be administrative costs associated with RDP participation that prevent farmers from applying to the program, and in fact, the awareness about such costs was increased by the information campaign. Furthermore, we found some heterogeneity in the effects by farm profitability. The information campaign seems to have negatively affected the intention to use RDP support and to increase awareness about administrative burden among unprofitable farmers, whereas it appeared to increase knowledge among profitable farmers.
A caveat of the current study is that the intended randomization of the information brochure could not be properly implemented by the field personnel. We tackled this issue by controlling for observed covariates both in linear regression and nonparametric estimation. Notwithstanding potential limitations, the study’s results suggest that the government should consider ways to improve RDP implementation and making it more accessible for Macedonian farmers, possibly by lowering administrative work and costs associated with participation in the projects.
22 References
Achuonjei, P. N., dos Santos, F., & Reyes, Y. (2003). Farmers’ Perceptions of the
Effectiveness of the Agricultural Rehabilitation Project (ARP) Information Campaign, East Timor. Paper presented at Annual Conference of Association for International
Agricultural and Extension Education, Raleigh, North Carolina, USA.
Altmann, S., & Traxler, C. (2014). Nudges at the dentist. European Economic
Review, 72, pp.19-38.
Altmann, S., Falk, A., Jäger, S., & Zimmermann, F. (2015). Learning about Job
Search: A Field Experiment with Job Seekers in Germany. IZA Discussion paper No.
9040.
Benders, R., Kok, R., Moll, H., Wiersma, G., & Noorman, K. (2006). New approaches for household energy conservation—In search of personal household energy budgets and energy reduction options. Energy Policy, 34(18), pp.3612-3622.
Chetty, R., & Saez, E. (2013). Teaching the Tax Code: Earnings Responses to an Experiment with EITC Recipients. American Economic Journal: Applied Economics, 5(1), pp.1-31.
Denisova-Schmidt, E., M. Huber, & Y. Prytula (2015). An Experimental Evaluation of
an Anti-Corruption Intervention among Ukrainian University Students, SES Working
Paper 462, University of Fribourg.
Dimara, E., & Skuras, D. (1999). Importance and Need for Rural Development Instruments under the CAP: A Survey of Farmers' Attitudes in Marginal Areas of Greece. Journal of Agricultural Economics, 50, pp. 304-315.
Dimitrievski, D., Kotevska, A. , Janeska Stamenkovska, I. , Tuna, E., Nacka, M. (2014). Agriculture and Agricultural Policy in the Former Yugoslav Republic of Macedonia. In: Volk, T., Erjavec, E., & Mortensen, K. (Eds.). Agricultural Policy and
European Integration in Southeastern Europe (pp.121-134). Budapest: Food and
Agriculture Organization of the United Nations.
Duflo, E., & Saez, E. (2003). The Role of Information and Social Interactions in Retirement Plan Decisions: Evidence from a Randomized Experiment. The Quarterly
23
Feld, S., Frenzen, H., Krafft, M., Peters, K., & Verhoef, P. C. (2013). The effects of mailing design characteristics on direct mail campaign performance. International
Journal of Research in Marketing, 30(2), pp.143-159.
Fellner, G., Sausgruber, R., & Traxler, C. (2013). Testing enforcement strategies in the field: threat, moral appeal and social information. Journal of the European
Economic Association, 11(3), pp.634-660.
Ferraro, P. & Miranda, J. (2013). Heterogeneous treatment effects and mechanisms in information-based environmental policies: Evidence from a large-scale field experiment. Resource and Energy Economics, 35(3), pp.356-379.
Galadima, M. (2014). Constraints on Farmers Access to Agricultural Information Delivery: A Survey of Rural Farmers in Yobe state, Nigeria. IOSRJAVS IOSR Journal
of Agriculture and Veterinary Science, 7, pp. 18-22.
Hainmueller, J. (2012). Entropy Balancing for Causal Effects: A Multivariate Reweighting Method to Produce Balanced Samples in Observational Studies.
Political Analysis, 20(1), pp.25-46.
Hainmueller, J., & Xu, Y. (n.d.).Ebalance: A Stata Package for Entropy Balancing.
SSRN Electronic Journal.
Hassan, S., Shaffril, H. A. M., Shahkat Ali, M. S., & Ramli, N. S. (2010). Agriculture agency, mass media and farmers: A combination for creating knowledgeable agriculture community. African Journal of Agricultural Research, 5(24), pp. 3500-3513.
Imbens, G. (2004). Nonparametric Estimation of Average Treatment Effects Under Exogeneity: A Review. Review of Economics and Statistics, 86(1), 4-29.
Kotevska, A., Bogdanov, N., Nikolić, A., Dimitrievski, D., Martinovska-Stojcheska, A., Tuna, E., … Georgiev, N. (2015). The Impact of Socio-Economic Structure of Rural
Population on Success of Rural Development Policy – Macedonia, Serbia and Bosnia and Herzegovina. Monograph submitted for publication.
24
Kotevska, A., Dimitrievski, D., Gjoshevski, D., Georgiev, N., Martinovska Stojcheska, A., Tuna, E., & Simonovska, A. (2015). Recommendations for enhancing the rural
development policy in Republic of Macedonia. Retrieved from: http://goo.gl/bVGGGc
Liebman, J. & Luttmer, E. (2015). Would People Behave Differently If They Better Understood Social Security? Evidence from a Field Experiment. American Economic
Journal: Economic Policy, 7(1), pp.275-299.
Lwoga, E., Stilwell, C., & Ngulube, P. (2011). Access and use of agricultural information and knowledge in Tanzania. Library Review, 60, pp. 383-395.
Macedonia APM Database. (2015). Agricultural policy Measures Database compiled
for Macedonia under the FAO/SWG project “Streamlining of agriculture and rural development policies of SEE countries for EU accession”. Unpublished data.
Republic of Macedonia State Statistical Office (2015). Indicators. Retrieved from: http://www.stat.gov.mk/KlucniIndikatori_en.aspx
Saez, E. (2009). Details Matter: The Impact of Presentation and Information on the Take-up of Financial Incentives for Retirement Saving. American Economic Journal:
Economic Policy, 1(1), pp.204-228.
Sani, B., Omenesa, Z., Sambo, I., Abdullahi, J., & Yuguda, M. (2015).Effect of Targeted Agricultural Information Delivery Approach on Farmers’ Access to Agricultural Information in Nigeria. Journal of Agricultural & Food Information, 16, pp. 72-79.
The Republic of Macedonia, EU Instrument for Pre-Accession for Rural Development (IPARD) (2013). National Programme for Agriculture and Rural Development 2007 –
2013. Fifth Modification. Retrieved from: http://goo.gl/9khx1F
The World Bank, World Development Indicators (2015). World databank. Agriculture,
value added (% of GDP); Employment in agriculture (% of total employment).
Retrieved from: http://databank.worldbank.org/data/
Volk, T., Rednak, M., & Erjavec, E.(2014). Cross country analysis of Agriculture and Agricultural Policy of Southeastern European Countries in Comparison with the European Union.In: Volk, T., Erjavec, E., & Mortensen, K. (Eds.). Agricultural Policy
25
and European Integration in Southeastern Europe (pp.9-37). Budapest: Food and
Agriculture Organization of the United Nations.
Zakon za zemjodelstvo i ruralen razvoj [Law of Agriculture and Rural Development].
(2010). Skopje: Sluzheben Vesnik na Republika, 49. Retrieved from:
26 Appendix A: Additional Tables and Figures
Table A1: Mean covariate values by treatment status in the original sample
Variable Control Treatment Difference
p-value
Age 52.976 48.596 -4.38 0.000 (0.626) (0.621) (0.882)
Male (binary) 0.8 0.819 0.019 0.564 (0.023) (0.023) (0.033)
Education: primary (binary) 0.247 0.111 -0.136 0.000 (0.025) (0.019) (0.031)
Education: high school (binary) 0.58 0.659 0.079 0.050 (0.029) (0.028) (0.040)
Education: colleage/ university (binary) 0.125 0.132 0.007 0.802 (0.019) (0.020) (0.028)
Household head’s occupation: agriculture
(binary) 0.563 0.54 -0.023 0.584 (0.029) (0.029) (0.041) Years in farming 27.851 25.531 -2.319 0.011 (0.694) (0.582) (0.906) Household size 4.037 4.192 0.154 0.165 (0.087) (0.070) (0.111) Profitable farm* 3.454 3.62 0.166 0.002 (0.041) (0.035) (0.054) Subsidy dependent* 2.18 2.052 -0.127 0.059 (0.048) (0.048) (0.067) Frequency of cooperation* 3.871 3.955 0.084 0.474 (0.080) (0.084) (0.116)
Share of agricultural production sold on a
market 90.115 87.052 -3.063 0.030 (0.918) (1.066) (1.406)
Share of income from farming 57.078 55.261 -1.817 0.381 (1.466) (1.466) (2.074)
Additional workers (binary) 0.278 0.185 -0.093 0.008 (0.026) (0.023) (0.035)
Capacity: farmed area (ha) 2.332 1.959 -0.373 0.048 (0.156) (0.106) (0.188)
Capacity: total livestock (number of heads) 2.245 1.378 -0.867 0.051 (0.370) (0.246) (0.444)
Applied for RDP in last 3 years (binary) 0.115 0.077 -0.039 0.114 (0.019) (0.016) (0.024)
Used RDP support in last 3 years (binary) 0.058 0.035 -0.023 0.191 (0.014) (0.011) (0.017)
Received value of RDP support (denars) 212.475 107.143 -105.332 0.212 (75.505) (37.385) (84.254)
27
Variable Control Treatment Difference
p-value
(0.000) (0.003) (0.003)
Education missing (binary) 0.047 0.098 0.05 0.020 (0.012) (0.018) (0.021)
Household head’s occupation missing
(binary) 0.034 0.01 -0.023 0.054 (0.011) (0.006) (0.012)
Years in farming missing (binary) 0.003 0.007 0.004 0.549 (0.003) (0.005) (0.006)
Profitable farm missing (binary) 0.003 0.007 0.004 0.549 (0.003) (0.005) (0.006)
Subsidy dependent missing (binary) 0 0.01 0.01 0.083 (0.000) (0.006) (0.006)
Frequency of cooperation missing (binary) 0.007 0 -0.007 0.157 (0.005) (0.000) (0.005)
Share of agric. production sold missing
(binary) 0 0.028 0.028 0.004 (0.000) (0.010) (0.010)
Share of income from farming missing
(binary) 0 0.01 0.01 0.083 (0.000) (0.006) (0.006)
Additional workers missing (binary) 0 0.021 0.021 0.014 (0.000) (0.008) (0.008)
Number of observations 305 292 - -
Notes: Standard errors are in parentheses. *Profitable farm: "1"=Very unprofitable; "2"=Moderately unprofitable; "3"=Break-even; "4"=Moderately profitable; "5"=Very profitable. *Subsidy dependent: "1"=Not dependent; "2"=Slightly dependent; "3"=Very dependent. *Frequency of cooperation: "1"=Never; "2"=Rarely; "3"=Not sure; "4"=Sometimes; "5"=Always.
28
Table A2: Treatment effects on perceived benefits of RDP8
Outcome variable Mean
difference OLS Ebalance
Sample size
RDP leads to improvement of infrastructure in
rural areas 0.139 0.0661 0.0862 257 (0.0849) (0.0778) (0.0832)
RDP leads to protection of environment, local
breeds and varieties 0.159* 0.0747 0.0714 257 (0.0860) (0.0739) (0.0787)
RDP leads to larger implementation of EU
standards 0.183** 0.113 0.120 257 (0.0833) (0.0743) (0.0802)
RDP leads to higher networking of rural
population 0.104 0.0396 0.0362 257 (0.0844) (0.0753) (0.0822)
RDP leads to stronger development of rural
tourism 0.146* 0.0782 0.0984 257 (0.0849) (0.0772) (0.0961)
RDP increases the income of farms and rural
households 0.224** 0.124 0.161 257 (0.0870) (0.0795) (0.101)
RDP supports the survival of small family
farms 0.168* 0.0550 0.115 257 (0.0883) (0.0823) (0.104)
RDP measures are more useful measures
than subsidies 0.207** 0.127 0.0884 252 (0.0914) (0.0891) (0.0896)
Co-finance principle in RDP projects is a
good motivator for farmers 0.342*** 0.268*** 0.224** 255 0.139 0.0661 (0.106)
Notes: Asymptotic standard errors in parentheses are robust to heteroscedasticity. Levels of significance are as follows: *** significant at the 1 percent level; ** significant at the 5 percent level; * significant at the 10 percent level. All the outcome variables are measured at a five point scale: "1"=Strongly disagree; "2"=Disagree; "3"=Don't know; "4"=Agree; "5"=Strongly agree. Ebalance: means are balanced.
8A note of caution is needed when interpreting effects on the perceived benefits of RDP, as they might be prone to upward bias due to the so-called “demand effect”. Treated farmers knew the individuals who distributed the brochures were also conducting the survey. Farmers might therefore have felt more reluctant to give a negative evaluation of RDP after receiving the brochure.
29
Figure A: Ease of getting a loan by farm profitability
Note: The graph is based on the evaluation sample as described in Section 4. Observations with missing information on profitability (1 obs.) and loan accessibility (62 obs.) are excluded, resulting in 195 observations (92 unprofitable farms and 103 profitable farms).
30 Appendix B: The Brochure
32 Translation of the content of the brochure
AGENCY FOR FINANCIAL SUPPORT OF AGRICULTURE AND RURAL DEVELOPMENT (AFPZRR)
Every year the Government of the Republic of Macedonia prepares a program for the financial support of rural development
GOALS
Modernization and structural adjustment of the agri-food sector
Support of economic activities related to the protection of natural, cultural and development values of rural areas
Transition of the national agricultural policy towards EU policies
MEASURE 112 - SUPPORT OF YOUNG FARMERS IN STARTING AGRICUTURAL ACTIVITIES
This measure is aimed at young farmers aged between 18 and 40 years who engage in agricultural activities for the first time by overtaking an existing farm or establishing a new one
Beneficiaries
Physical and legal entities involved in an agricultural activity or agricultural households registered in the Single Farm Register (SFR) of Ministry of Agriculture, Forestry and Water Economy (MAFWE)
Criteria
The application for support is to be submitted no later than 18 months from the date of registration of a change or a new farm in SFR
The applicant is a holder of agricultural property
The applicant has at least secondary education in agriculture or went through a training to acquire the qualifications for an agricultural activity, except for the cases where the business plan foresees a training
The applicant is to comply with good agricultural practices and measures for the protection of nature and animal welfare
MEASURE 121 - INVESTMENTS IN THE MODERNIZATION OF AGRICULTURAL HOUSEHOLDS
121.1: Purchase of cattle from recognized organizations of cattle breeders in the Republic of Macedonia.
121.2: Purchase of bee queens from a registered bee breeder
121.3: Growing new vineyards and orchards and honey flora (phacelia, euodia, and robinia) in new locations
33
121.4: Procurement of equipment for drip irrigation for corn and forage crops and wells for irrigation
121.5: Investments in agricultural equipment and mechanization for grain and industrial crops
Beneficiaries
Agricultural farms registered in SFR of MAFWE, in accordance with the Law of Agriculture and Rural Development
Criteria
The applicant is a holder of agricultural property
Sub-measure 121.3 requires a minimum acceptable size of 0.5 hectares with a mandatory agri-chemical analysis of soil and certified planting material
Sub-measure 121.4 requires suitable production capacities (from 2 to 10 ha) recorded in the production plan for the current year
MEASURE 122 - INVESTMENTS IN THE INCREASE OF THE ECONOMIC VALUE OF FORESTRY
To increase the production efficiency by reducing the costs and improving the quality of forestry production
Beneficiaries
Physical and legal entities who are forest owners and/or associations of private forest owners
MEASURE 131 - SUPPORT OF ECONOMIC ASSOCIATIONS OF FARMS FOR JOINT AGRICULTURAL ACTIVITIES
131.1: Establishment and operation of agricultural cooperatives
131.2: Organization of information and promotional activities for agricultural products
131.3: Aid for insurance premiums in the form of partial reimbursement of the insurance cost
131.4: Investments for purchasing agricultural machinery that amount to 90% of the value of procurement
Beneficiaries
Agricultural cooperatives registered in the Register of Agricultural Cooperatives of MAFWE in accordance with the Law of Agricultural Cooperatives
PROCEDURE
Submission of the application Approval of the request
34
Signing of the contract
Realization of the obligations under the contract Filing for the payment
Approval of the payment Required documents and guidelines
can be obtained on the website of Agency for Financial Support of Agriculture and Rural Development (AFPZRR) or at the local units of the National Extension Agency (NEA)
Check before submitting an application
It is necessary to verify the data for cadastral parcels and production facilities registered in SFR and check whether all liabilities are settled: those based on lease and use of state-owned land, state pastures, water bills, concessions for commercial and recreational fishing, concessions for issuing a permit to hunting areas, obligations regarding the contracts for the use of compensation funds from foreign assistance for which MAFWE is responsible, taxes and contributions for which the Public revenue office is responsible.
INSTITUTIONS
Ministry of agriculture, forestry and water economy (MAFWE)
Amina Treti St. 2, 1000 Skopje Phone: 02/3134-477
www.mzsv.gov.mk
Agency for financial support of agriculture and rural development (AFPZRR)
3d Makedonska brigada 20, 1000 Skopje Phone: 02/3097-450
www.pardpa.gov.mk
National Extension Agency (NEA)
Kliment Ohridski St. 66, 7000 Bitola