HAL Id: hal-01191622
https://hal.archives-ouvertes.fr/hal-01191622
Submitted on 2 Sep 2015
HAL is a multi-disciplinary open access
archive for the deposit and dissemination of
sci-entific research documents, whether they are
pub-lished or not. The documents may come from
teaching and research institutions in France or
abroad, or from public or private research centers.
L’archive ouverte pluridisciplinaire HAL, est
destinée au dépôt et à la diffusion de documents
scientifiques de niveau recherche, publiés ou non,
émanant des établissements d’enseignement et de
recherche français ou étrangers, des laboratoires
publics ou privés.
An ECG T-wave Anomalies Detection Using a
Lightweight Classification Model for Wireless Body
Sensors
Medina Hadjem, Farid Naït-Abdesselam
To cite this version:
Medina Hadjem, Farid Naït-Abdesselam. An ECG T-wave Anomalies Detection Using a Lightweight
Classification Model for Wireless Body Sensors. IEEE ICC 2015 - Workshop on ICT-enabled services
and technologies for eHealth and Ambient Assisted Living, Jun 2015, London, United Kingdom.
pp.278-283, �10.1109/ICCW.2015.7247191�. �hal-01191622�
An ECG T-wave Anomalies Detection Using a
Lightweight Classification Model for Wireless Body
Sensors
Medina Hadjem and Farid Naït-Abdesselam Paris Descartes University, France {firstname.lastname}@parisdescartes.fr
Abstract—Various wearable devices are foreseen to be the key components in the future for vital signs monitoring as they offer a non-invasive, remote and real-time medical monitoring means. Among those, Wireless Body Sensors (WBS) for cardiac monitoring are of prominent help to early detect CardioVascular Diseases (CVD) by analyzing 24/24 and 7/7 collected cardiac data. Today, most of these WBS systems for CVD detection, include only limited automatic anomalies detection, particularly regarding ECG anomalies. Severe CVD, such as Myocardial Infarction or Ischemia, needs to achieve an advanced analysis of ECG waves known as P, Q, R, S and T. In particular, the T-wave and its specific changes. In this paper, we focus on T-wave anomalies detection in a context of WBS. Our study suggests an accurate and lightweight T-wave changes detection model which suits well an ECG monitoring system based on WBS architecture. We performed a comparative study of 7 well-known supervised learning classification models, on real ECG data sets from 7 different leads. We compared the results from both perspectives of classification and processing times. Our results show that the C4.5 Decision Tree technique performs better results with 92.54% Accuracy, 96.06% Sensibility, 55.41% Specificity and 7.41% Error Rate.
Index terms—ECG, T-wave, WBS, Supervised Learning.
I. INTRODUCTION
Recent technological advances in wireless technologies, sen-sors conception and miniaturization are revolutionizing the way how healthcare services are delivered. In fact, existing sensors are able to collect various physiological parameters in real-time and with wireless transmission capabilities, such as Heart Rate, Respiration Rate, Temperature, Oxygen Saturation, Blood Pressure, Electromyogram, Electrocardiogram, etc. These Wire-less Body Sensors (WBS) can be attached to the human body and transmit collected data to a gateway device (Smartphone, Tablet, etc.), which processes and transmits gathered informa-tion in real-time to remote healthcare professionals so they can make appropriate medical decisions.
Various applications of WBS can be considered. One of the most promising is remote monitoring and detection of Cardiovascular Diseases (CVD). According to the World Health Organization [1], these diseases are the leading causes of death worldwide. In 2008, 17.3 million people died from CVD and almost 23.3 million people will die annually by 2030. This area of research is very challenging and strategic for medical sector and is highly supported by governments.
Today, diagnosis of heart defects is done after physical symptoms that lead patients to consult doctors or during
a routine medical examination, where the Electrocardiogram (ECG) is recorded. The ECG represents the contraction and relaxation of cardiac muscle, resulting from depolarization and re-polarization of myocardial cells. These electrical changes are recorded via electrodes placed on the limbs and chest wall and are transcribed on a graph paper.
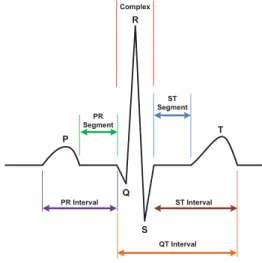
The most widely used ECG recording technique is the 12-lead ECG. This technique uses 10 reconrding sites from which are derived 12 signals called leads. Among which, 6 Precordial Leads (V1, V2, V3, V4, V5, V6), 3 Limb leads (I, II, III) and 3 augmented Limb leads (aVR, aVL, aVF). Each lead views the heart from a different angle, and is composed of 5 waves symbolized P, Q, R, S, and T. These waves are separated by intervals and segments as shown on Figure 1 that illustrates a typical one-cycle ECG waveform.
Fig. 1. An ECG heart beat with waves and segments
T-wave is a significant ECG wave, it corresponds to the ventricular re-polarization and its changes are one of the most common noted on an ECG. These changes may be normal for some healthy individuals because of age, body configuration and medications or may indicate several heart anomalies based on their abnormal shape or amplitude.
– Elevated : An increase in T-wave amplitude may indicate an early stage of myocardial infarction (MI), occurring in the first few minutes after occlusion of a coronary artery. Intervention at this early stage can prevent infarction and improve the outcome of treatment. In practice, most patients consult after chest pain which is generally the stage of ST segment elevation, this is why ST elevation is often consid-ered as the most sensitive marker of MI. Other anomalies can be related to a prominent T-wave such : hyperkalemia (Excess of potassium in the blood), Bundle Branch Block, Left Ventricular Hypertrophy.
– Inverted: T-wave inversion may indicate Ischemia or Acute Coronary Syndrome (ACS) resulting from complete or partial thrombotic occlusion of a coronary artery. In general, Deep T-wave inversion in some leads usually relates to a serious underlying cardiac lesion. T-wave inversion may also be indicative of hyperventilation or pulmonary embolism. – Flattened or Biphasic : The two main causes of biphasic
T-waves are Myocardial Ischemia and Hypokalaemia (Potas-sium deficiency in the blood). Flattened T-waves are a non-specific finding, they may indicate Ischemia in some cases. There is no clearly established normality parameters of the T-wave amplitude and duration. Usually, specialists are interested in changes of amplitude over time, by comparing ECG with previous recordings. The observation of these changes, only at a given time, can’t lead to an automatic diagnosis and other medical examinations are often necessary. Therefore, the relevance of T-wave analysis resides in the possibility of time tracking of its parameters, as it is the case using WBS. Therefore, this study should be considered in a context of continuous ECG monitoring system for a purpose of medical alerting and not diagnosis.
The aim of this study is to find an efficient and lightweight model for T-wave changes detection. This model should distin-guish between normal, elevated and inverted T-waves (Flattened or biphasic T-wave will not be studied in this paper), and offers the best classification performance with a processing time suitable to real-time constraint of WBS systems.
The rest of this paper is organized as follows: Section II surveys related work. Section III presents the proposed ap-proach and Section IV discusses experimental results. Finally, Section V concludes this paper.
II. RELATEDWORKS
With the development of e-Health in recent years, wireless body sensors monitoring systems have been the subject of various research in both public and industry sector. Regarding ECG monitoring, these systems are able to capture patient’s ECG wirelessly and send it in real-time to remote applications, so that it can be analyzed by specialists. Many prototypes and frameworks were proposed, for example, MyHeart [3] and MEDISN [4]. More recently, these systems are evolving to incorporate cardiac anomalies detection like arrhythmia, as in [5] and [6]. Some systems are already on the market such as CardioNet [7] and BodyGuardian [8]. Other contributions
propose to detect more complex anomalies as Myocardial Infarction like in [9] and [10].
The detection methods proposed in such ECG monitoring systems are generally based on temporal characteristics of ECG waves (P, Q, R, S, T). Most of them analyze the RR Interval as an indicator of heart rate, or ST segment elevation or depression, which is generally a sign of Myocardial Infraction or Ischemia. Other studies analyze the P-wave and PR Interval anomalies to detect Arrhythmia. Among these works, little focus on T-wave analysis changes, which are yet very used by doctors in the diagnosis process of various cardiac anomalies as mentioned in section I.
The most significant works on T-wave analysis, focus on the T-wave alternans (TWA) detection, which is a periodic beat to beat variation in T-wave amplitude or shape. This is related to cardiac instability and may indicate a risk of sudden cardiac death. Several contributions on TWA detection were proposed, especially under the 2008 Physionet/Computing In Cardiology Challenge [11]. The proposed solutions are based on different techniques of signal processing, data mining or machine learning. Good scores were obtained with Principal Component Analysis (PCA) [12], Spectral Method [13] and Fast Fourier Transform (FFT) [14]. Many other TWA detection techniques are compared and discussed in [15]. T-wave analysis was also used for Myocardial Ischemia detection, as an addi-tional parameter to ST segment, like in [16]. Other contributions propose a general detection of T-wave changes episodes like in [17]. According to our research, there is very little ECG monitoring systems including T-wave analysis. A proposal was made in [18] to develop a real-time ECG anomalies diagnosis, including T-wave analysis on a sensor node platform.
In this study, we experiment 7 supervised learning methods (Naïve Bayes, Support Vector Machine, Logistic Regression, K-Nearest Neighbors, AdaBoost, Decision Trees and Random Forest). The goal is to suggest a model that is both accu-rate to detect T-wave changes (Elevation and Inversion) and lightweight to suit a context of WBS implementation.
III. PROPOSEDAPPROACH
The proposed approach consists of three main steps. ECG Pre-processing and features extraction, test of 7 classification methods to select the most suitable, and finally propose an integration algorithm of the selected model in a WBS ECG monitoring system.
A. ECG Pre-processing and Features Extraction
Pre-processing is a required step for any ECG analysis in order to remove various noises. Theses noises can seriously affect the quality of collected ECG and distort the analysis results. They interfere with the ECG components in the fre-quency domain, specifically in the range [0.01Hz-150Hz]. The most significant are:
– Power line interference around 50Hz or 60Hz. – Baseline wandering with a frequency bellow 0.5Hz. – Electrodes motion artifacts ranging from 1Hz to 10Hz.
– Electromyographic (EMG) noise from 25Hz to 100Hz. Power line noise comes from electronic circuits of ECG recorder. It is a narrow-band signal centered at a frequency of 50Hz or 60Hz with a bandwidth of less than 1Hz, it has a form of a sinusoid with a significant amplitude compared to the magnitude of the digitized signal. Generally, this noise is filtered by ECG signal acquisition hardware.
Baseline wandering is usually due to patient movements and respiration. It ranges between 0.15Hz and 0.5Hz and causes changes in ECG isoelectric line. It can be removed, without loss in original signal quality, by a highpass digital filter or by a standard Wavelet Transform (WT). In this study, we use a 0.5Hz FIR highpass filter (Finite Impulse Response).
Electrodes motion artifacts and EMG noise are more difficult to remove because they may be a complex stochastic processes within a wideband, and traditional digital filters can’t remove them. Instead, Discrete Wavelet Transform technique (DWT) is widely used. In this study, we use Undecimated Wavelet Transform (UWT), a variant of DWT with better balance between smoothness and accuracy and ensures no loss of signal sharpest features. UWT for ECG denoising is described in [19]. After pre-processing, an ECG segmentation is performed to estimate time positions of the main ECG waves (QRS com-plex, P-wave and T-wave). These time positions will serve to calculate ECG features used in the classification stage. To avoid the effect of any changes introduced by the pre-processing, the preprocessed ECG signal is only used to detect QRS complexes positions, other ECG waves positions are estimated using the original signal. The method used for segmentation is the ECG Feature Extractor technique developed by Labview [20], which is inspired by the well known Pan & Tompkins technique for QRS peaks detection [21]. Table I synthesizes the temporal parameters extracted for each ECG beat.
TABLE I
TEMPORAL PARAMETERS EXTRACTED FROM EACHECGBEAT
Parameter Description Ponset Start time of the ECG P-wave Poffset End time of the ECG P-wave QRSonset Start time of the ECG QRS complex QRSoffset End time of the ECG QRS complex
Tonset Start time of the ECG T-wave Toffset End time of the ECG T-wave
Based on previous temporal parameters, we calculate the ECG features used in classification stage. In order to both reduce the data size to process and increase the classifier accuracy, only the most relevant features related to T-wave abnormalities are selected. After collecting various medical information about T-wave abnormalities, mainly from [2], we selected the ECG features described in table II.
B. T-wave Classifier selection
As there is no established parameters of normality to easily classify T-wave changes, supervised learning approaches seem to be suitable. These machine learning techniques allow to build
TABLE II
SELECTEDECGFEATURES FORT-WAVE CLASSIFICATION
Feature Description
Tamp T-wave amplitude in mV calculated by peak research between Tonset and Toffset
Tdur T-wave duration in seconds between Tonset and Toffset STamp ST segment amplitude in mV approximated by averaging the
extrema between QRSoffset and Tonset
QTdur QT interval duration in seconds between QRSonset and Toffset
a predictive model on observed data in order to make prediction on new unknown data. More formally, a supervised learning classification problem, consists in a set X of objects called the input space and a finite set C of classes called the output
space. We consider a sample E= {(x1, c1), ..., (xn, cn)} with
an unknown probability distribution D over X×C. The goal of
the classification is to find the function h∈ CX
that defines the relation between objects and classes, based only on the sample E and drawn independently at random according to D. As we are looking for a model suitable for an implementation in a WBS context, we focus, in addition to accuracy, on processing time of classification. To find the classifier that best suits this objective, we compare 7 ones : 3 linear classifiers (NBC, SVM and Logistic Regression) generally characterized by a lower complexity, 2 non-linear classifiers (k-NN and AdaBoost) and 2 Decision Trees classifiers (C4.5 and RF) that generally have good performances. An overview of these classifiers can be found in [22]. The results are detailed in section IV.
C. Integration of the model in a WBS ECG monitoring system
We consider a WBS ECG monitoring system composed of wireless ECG sensors transmitting data to a smartphone in real-time. The selected classification model can be implemented as a mobile application running on the smartphone. This ap-plication receives ECG wirelessly from sensors, pre-processes and extracts ECG features related to T-wave (Tamp, Tdur,
STamp, QTdur), and finally classifies these features using the selected model. The model is first built based on annotated real ECG data, and updated in real-time with the classification results of the received ECG. The application raises an alarm to medical assistance only if a minimum number of ECG beats are classified as abnormal during a windows time w (to define in the application). Algorithm 1 summarizes all steps achieved by the mobile application of the target WBS system.
IV. EXPERIMENTALRESULTS
In order to experiment our proposed approach, we used the European ST-T ECG Database (EDB) from Physionet [23]. It’s a collection of real patients ECG records, specifically intended for evaluation of ST and T-wave changes algorithms. This database consists of 90 annotated ECG recordings from 79 men and women of different ages. It contains a representative selection of ECG T-wave abnormalities, including 367 ST segment and 401 T-wave change episodes. Each episode ranges from 30 seconds to several minutes. Each record is 2 hours duration (∼7200 ECG beats) and contains 2 leads sampled at
Algorithm 1 Mobile application algorithm for a WBS system Build the classification model on an initial training set T S ;
Set the windows size w; i= 0;
while Captured ECG beat k do
Denoise ECG k with 0.5Hz Highpass filter and UWT; Extract Peaks, Onsets and Offsets of P, QRS and T; Calculate the classification features Tamp, Tdur, STamp,
QTdur;
Apply the built Model on these features to classify the beat as Normal, Elevated or Inverted T-wave;
if i= w then
if (Number(Class6= N ormal) > M in) then
Raise an alarm; end if
i= 0;
Update the model with the new classification results; else
i= i + 1;
end if end while
250 per second. The leads are different for each record so there is 7 distinct leads in the entire database (I, III ,V1 ,V2 ,V3 ,V4 ,V5). Two cardiologists annotated each record beat-by-beat for changes in ST segment, T-wave morphology, rhythm, and signal quality. An anomaly code is associated to each beat : (N) if the beat is normal and (T) if a T-wave change is observed. The direction of the change, (T+) for an elevation and (T-) for an inversion, is indicated at specific beats that delimit a current episode (Onset, Extrema and End beats), and this direction is associated to all beats in the episode.
For each record in the EDB database, the pre-processing and features extraction is performed for each lead by a script we developed using Labview [24]. It’s a graphical programming platform that offers many modules named Virtual Instruments (VI). For our experiments, we use the Filtering VI (0.5Hz FIR high-pass filter), the Wavelet Denoise VI (UWT with the Daubechies6 wavelet) and ECG Feature Extractor VI. The result of this stage is a series of ECG temporal parameters characterizing each beat of each lead. From these parameters, we calculate, for each beat, the relevant T-wave features Tamp,
STamp, Tdur, QTdur.
Figure 2 shows examples of normal, elevated and inverted
T-wave ECG signals, extracted from the EDB record e0104.
Figure 3 shows the previous signals processed by a 0.5Hz FIR highpass digital filter and UWT. We can see that the base-line wandering was removed since the basebase-line was restored to Iso-level, while the main characteristics of the original ECG signals were kept. We can see also that the signal is less noisy, due to removal of wideband noises without its distortion.
Figure 4 shows the extracted temporal parameters Ponset,
Poffet, R peak, QRSonset, QRSoffet, Tonset and Toffet of the previous ECGs. As described in Section III, these values were obtained by extracting QRS complex peaks, and then deduct P
1.9 1.902 1.904 1.906 1.908 1.91 1.912 x 10⁵ −1.5
−1 −0.5
Normal T wave ECG
ECG Samples A mplitude (mV) 2.08 2.082 2.084 2.086 2.088 2.09 x 10⁵ −1.5 −1 −0.5
Elevated T wave ECG
ECG Samples A mplitude (mV) 2.698 2.7 2.702 2.704 2.706 2.708 2.71 x 10⁵ −1.5 −1 −0.5
Inverted T wave ECG
ECG Samples
A
mplitude (mV)
Fig. 2. Normal, Elevated and Inverted T-wave ECGs from the EDB database
1.9 1.902 1.904 1.906 1.908 1.91 1.912 x 10⁵ 0
0.5 1
Normal T wave ECG
ECG Samples A mplitude (mV) 2.08 2.082 2.084 2.086 2.088 2.09 x 10⁵ 0 0.5 1
Elevated T wave ECG
ECG Samples A mplitude (mV) 2.698 2.7 2.702 2.704 2.706 2.708 2.71 x 10⁵ 0 0.5 1
Inverted T wave ECG
ECG Samples
A
mplitude (mV)
Fig. 3. ECGs after pre-processing
1.8975 1.898 1.8985 1.899 1.8995 1.9 1.9005 1.901 1.9015 1.902 1.9025 x 10⁵ −1.5
−1 −0.5
Normal T wave ECG
ECG Samples A mplitude (mV) 2.08 2.081 2.082 2.083 2.084 2.085 x 10⁵ −1.5 −1 −0.5
Elevated T wave ECG
ECG Samples A mplitude (mV) 2.698 2.699 2.7 2.701 2.702 2.703 2.704 2.705 x 10⁵ −1.5 −1 −0.5
Inverted T wave ECG
ECG Samples A mplitude (mV) ECG Signal P Onset P Offset QRS onset R peak QRS offset Tonset Toffset
Fig. 4. ECGs after temporal features extraction
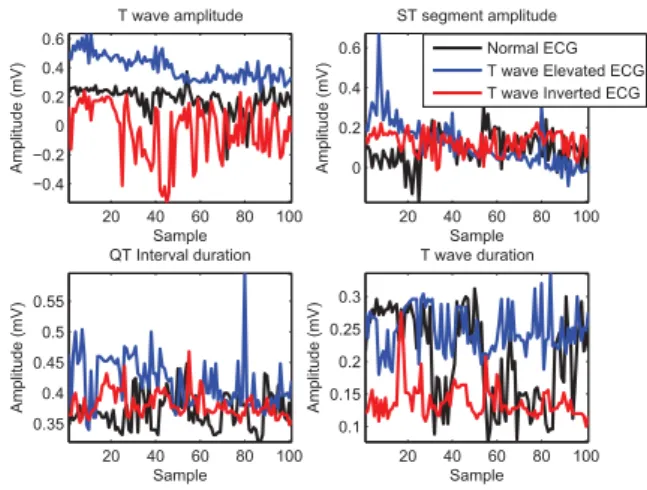
and T peaks and their corresponding onsets and offsets. Figure 5 shows the variation of calculated T-wave amplitude
and duration parameters, during normal, elevation and inversion episodes. As we can see, the variation of features specific to T-wave (Tamp and Tdur) are significantly representative of the occurrence or not of elevation and inversion episodes. This is less significant in the case of the two other parameters (STamp and QTdur), since these parameters are less specific to T-wave but stay very related to it.
20 40 60 80 100 −0.4 −0.2 0 0.2 0.4 0.6 Sample A mplitude (mV) T wave amplitude 20 40 60 80 100 0 0.2 0.4 0.6 Sample A mplitude (mV) ST segment amplitude 20 40 60 80 100 0.35 0.4 0.45 0.5 0.55 Sample A mplitude (mV) QT Interval duration 20 40 60 80 100 0.1 0.15 0.2 0.25 0.3 Sample A mplitude (mV) T wave duration Normal ECG T wave Elevated ECG T wave Inverted ECG
Fig. 5. Variation of extracted T-wave features for each class
In order to build the data corpus for the classification, we associate to each beat, in addition to the four T-wave parameters, the annotation code associated to the beat (We implemented a script to read and extracted annotations from EDB). These annotations represent the classes of data (Normal (N), Elevated (T+), Inverted (T-)). To obtain more relevant results, we grouped the records by lead, so we can analyze the performance by lead on a greater number of beats. We get 7 sets of leads (V1, V2, V3, V4, V5, I, III). Each composed between a total of 45.000 to 359.526 beats. Classification is performed on each record separately, then the final results, per lead, are obtained by averaging the results of all records of a given lead. Table III summarizes the obtained corpus.
TABLE III COMPOSITION OF THECORPUS
ECG Lead Total records Total beats Total “N” beats Total “T+” beats Total “T-” beats V1 11 71165 64111 2642 4413 V2 10 78762 55006 11969 1788 V3 7 46609 41470 3269 1872 V4 34 223843 200703 10514 12627 V5 51 355428 335088 10654 9693 I 19 129914 126112 1182 2621 III 46 309388 286613 16443 6338
To perform the classification experiments, we choose Weka [25], a well-known machine learning tool. It is a large collection of machine learning algorithms for classification, clustering, association rules, regression and visualization.
To compare the performance results of the seven classifiers selected, we use the ROC parameters described in the table IV. T P , F P , T N , F N are respectively, the number of True Positives, False Positives, True Negatives and False Negatives.
TABLE IV
ROCPARAMETERS USED FOR CLASSIFICATION RESULTS COMPARISON
Parameter Significance Formula Accuracy(Acc) Correctly Classified
Instances Rate
T P +T N T P +T N +F P +F N
Sensibility(Se) True Positive Rate T P +F NT P Specificity(Sp) True Negative Rate T N
F P +T N Error Rate (Err) Incorrectly Classified Instances Rate F P +F N T P +T N +F P +F N
Table V shows the results obtained by lead for each classifier. In addition to ROC parameters, we give the time T elapsed for classification of 10 minutes ECG (about 600 beats).
The results show that Accuracy and Sensitivity parameters are greater than 90%. This indicates a good anomalies detection rate for most of classifiers and leads (performance are slightly lower for V2 lead). Error Rate varies by method and lead, but is generally below 10%. Specificity varies around 50%, this rate is caused by False Positives F P , which are not critical errors but may cause false alarms. To reduce this problem, we propose to raise an alarm, only if the number of T-wave changes detected is greater than a minimum M in in a time windows w. Regarding the performance of each classification method, it appears that C4.5 achieves the best results with the lowest processing time T . NBC is the worst performer, with a processing time 11 to 14 times higher than C4.5 time, for all ECG leads. This may suggest that all studied leads are equivalent for the T-wave analysis. The performance of RF is close to C4.5, but with a longer processing time, 4 to 6 times. Other methods perform less than C4.5 and RF and have equivalent performance, but with a large disparity in processing time. LR and AdaBoost are 2 to 4 times slower than C4.5, while K-NN is about 500 times slower and SVM nearly 300 times slower. It appears from these initial results that C4.5 is a good choice for an implementation of a T-wave changes detection model in a WBS ECG system.
V. CONCLUSION
In this paper, we study the T-wave changes detection problem for a wireless ECG monitoring system implementation. We first present the ECG pre-processing stage done in order to remove various noises, using digital highpass filter and Undecimated Wavelet Transform (UWT). Then, we achieve an ECG temporal parameters extraction to calculate 4 ECG features related to T-wave (Tamp, STamp, Tdur and QTdur). These features are used to test 7 supervised learning classifiers (NBC, SVM, LR, K-NN, AdaBoost, C4.5 and RF), to select the best one both in terms of classification performance and processing time. We test our proposed approach using the EDB medical database composed of 90 real ECG records, and we use the ROC parameters to compare the models. Experimental results show that C4.5 performs the best results both in classification and
TABLE V
RESULTS OF THE CLASSIFICATION
Lead Method Acc(%) Se(%) Sp(%) Err(%) T(ms) V1 BNC 89.13% 93.47% 57.30% 10.87% 0.013 V1 LR 90.99% 97.39% 41.38% 9.01% 0.003 V1 K-NN 91.17% 94.76% 58.65% 8.83% 0.507 V1 AdaBoost 90.20% 97.69% 36.38% 9.80% 0.002 V1 C4.5 92.65% 96.84% 53.37% 7.35% 0.001 V1 RF 92.52% 96.78% 55.57% 7.48% 0.005 V1 SVM 89.98% 99.07% 23.26% 10.02% 0.290 V2 BNC 80.43% 78.42% 64.36% 19.57% 0.013 V2 LR 83.47% 85.32% 62.08% 16.53% 0.004 V2 K-NN 83.24% 85.13% 71.89% 16.76% 0.508 V2 AdaBoost 83.67% 86.21% 63.99% 16.33% 0.002 V2 C4.5 86.67% 90.04% 72.41% 13.33% 0.001 V2 RF 86.20% 90.10% 71.00% 13.80% 0.008 V2 SVM 83.57% 86.61% 54.98% 16.43% 0.523 V3 BNC 86.58% 88.72% 62.68% 13.42% 0.013 V3 LR 91.86% 98.10% 44.17% 8.14% 0.003 V3 K-NN 90.75% 94.65% 60.81% 9.25% 0.580 V3 AdaBoost 90.44% 98.84% 34.57% 9.56% 0.002 V3 C4.5 92.97% 97.44% 56.04% 7.03% 0.001 V3 RF 92.79% 97.36% 56.21% 7.21% 0.006 V3 SVM 90.45% 99.56% 26.95% 9.55% 0.314 V4 BNC 90.30% 94.07% 58.77% 9.70% 0.012 V4 LR 92.84% 96.67% 51.71% 7.16% 0.004 V4 K-NN 92.96% 95.08% 66.29% 7.04% 0.537 V4 AdaBoost 91.50% 95.86% 45.89% 8.50% 0.002 V4 C4.5 94.12% 96.53% 64.11% 5.88% 0.001 V4 RF 94.24% 96.94% 64.20% 5.76% 0.005 V4 SVM 92.06% 97.12% 38.01% 7.94% 0.279 V5 BNC 90.00% 93.67% 45.84% 10.00% 0.014 V5 LR 92.84% 97.74% 36.02% 7.16% 0.004 V5 K-NN 92.50% 95.23% 55.56% 7.50% 0.580 V5 AdaBoost 92.98% 96.99% 40.20% 7.02% 0.002 V5 C4.5 93.96% 97.36% 49.58% 6.04% 0.001 V5 RF 93.87% 97.31% 51.55% 6.13% 0.005 V5 SVM 92.54% 98.40% 27.02% 7.46% 0.265 I BNC 91.46% 95.15% 35.61% 8.54% 0.014 I LR 93.29% 98.76% 20.19% 6.71% 0.003 I K-NN 92.47% 95.66% 48.34% 7.53% 0.545 I AdaBoost 93.11% 97.83% 25.60% 6.89% 0.002 I C4.5 93.78% 98.08% 33.73% 6.22% 0.001 I RF 93.83% 98.00% 38.20% 6.17% 0.006 I SVM 93.31% 99.63% 12.70% 6.69% 0.229 III BNC 88.63% 93.24% 50.26% 11.37% 0.011 III LR 92.16% 97.44% 34.16% 7.84% 0.003 III K-NN 92.42% 94.59% 60.48% 7.58% 0.476 III AdaBoost 92.57% 96.13% 44.19% 7.43% 0.002 III C4.5 93.94% 96.19% 58.29% 6.06% 0.001 III RF 93.89% 96.54% 57.67% 6.11% 0.004 III SVM 92.77% 97.62% 29.51% 7.23% 0.232
time processing, with an average of 92.54% Accuracy, 96.06% Sensibility, 55.41% Specificity and 7% Error rate. To validate these results in a real user environment, we are currently working on an end-to-end implementation of C4.5 based model using market wireless ECG sensors.
REFERENCES
[1] “World health organisation,” Last visited September 2014. [Online]. Available: http://www.who.int/en/
[2] F. Morris, W. J. Brady, and J. Camm, ABC of clinical electrocardiography. John Wiley & Sons, 2009, vol. 93.
[3] J. Luprano, J. Solà, S. Dasen, J.-M. Koller, and O. Chételat, “Combination of body sensor networks and on-body signal processing algorithms: the practical case of myheart project,” in International Workshop on Wearable
and Implantable Body Sensor Networks. IEEE, 2006, pp. 4–pp.
[4] J. Ko, J. H. Lim, Y. Chen, R. Musvaloiu-E, A. Terzis, G. M. Masson, T. Gao, W. Destler, L. Selavo, and R. P. Dutton, “Medisn: Medical emer-gency detection in sensor networks,” ACM Transactions on Embedded
Computing Systems (TECS), vol. 10, no. 1, p. 11, 2010.
[5] H. Zhou, K. M. Hou, J. Ponsonnaille, L. Gineste, and C. De Vaulx, “A real-time continuous cardiac arrhythmias detection system: Recad,” in
27th Annual International Conference of the Engineering in Medicine and Biology Society. IEEE, 2006, pp. 875–881.
[6] D. D. Patil, D. Patil, S. Pandharpatte, R. Dhekane, T. Mohol, and V. Wadhai, “Intelligent arrhythmia diagnostics system,” International
Journal of Computer Science Issues (IJCSI), vol. 9, no. 6, 2012. [7] “Mcot cardionet,” Last visited September 2014. [Online]. Available:
http://www.cardionet.com
[8] “Bodyguardian remote monitoring system,” Last visited September 2014. [Online]. Available: http://www.preventice.com/products/bodyguardian/ [9] Z. Sankari and H. Adeli, “Heartsaver: A mobile cardiac monitoring
system for auto-detection of atrial fibrillation, myocardial infarction, and atrio-ventricular block,” Computers in biology and medicine, vol. 41, no. 4, pp. 211–220, 2011.
[10] A. Huang, C. Chen, K. Bian, X. Duan, M. Chen, H. Gao, C. Meng, Q. Zheng, Y. Zhang, B. Jiao et al., “We-care: an intelligent mobile telecardiology system to enable mhealth applications,” 2014.
[11] G. Moody, “The physionet/computers in cardiology challenge 2008: T-wave alternans,” in Computers in Cardiology, 2008. IEEE, 2008, pp. 505–508.
[12] G. Bortolan and I. Christov, “Principal component analysis for detection and assessment of t-wave alternans,” in Computers in Cardiology, 2008. IEEE, 2008, pp. 521–524.
[13] A. Khaustov, S. Nemati, and G. Clifford, “An open-source standard t-wave alternans detector for benchmarking,” in Computers in Cardiology,
2008. IEEE, 2008, pp. 509–512.
[14] D. Zheng, S. Stevens, P. Langley, K. Wang, A. Haigh, S. King, and A. Murray, “T-wave alternans: A comparison of different measurement techniques,” in Computers in Cardiology, 2008. IEEE, 2008, pp. 597– 600.
[15] J. P. Martínez and S. Olmos, “Methodological principles of t wave alternans analysis: a unified framework,” Biomedical Engineering, IEEE
Transactions on, vol. 52, no. 4, pp. 599–613, 2005.
[16] A. R. M. Dehnavi, I. Farahabadi, H. Rabbani, A. Farahabadi, M. P. Mahjoob, and N. R. Dehnavi, “Detection and classification of cardiac ischemia using vectorcardiogram signal via neural network,” Journal of
research in medical sciences: the official journal of Isfahan University of Medical Sciences, vol. 16, no. 2, p. 136, 2011.
[17] C. Papaloukas, D. I. Fotiadis, A. Likas, C. S. Stroumbis, and L. K. Michalis, “Use of a novel rule-based expert system in the detection of changes in the st segment and the t wave in long duration ecgs,” Journal
of electrocardiology, vol. 35, no. 1, pp. 27–34, 2002.
[18] F. J. Rincón, L. Gutiérrez, M. Jiménez, V. Diaz, N. Khaled, D. Atienza, M. Sánchez-Elez, J. Recas, and G. De Micheli, “Implementation of an automated ecg-based diagnosis for a wireless body sensor platform,” in
Proceedings of the International Conference on Biomedical Electronics and Devices (BIODEVICES 2009), vol. 1, no. EPFL-CONF-130660. Springer, 2009, pp. 88–96.
[19] V. P. Raj and T. Venkateswarlu, “Ecg signal denoising using undecimated wavelet transform,” in 3rd IEEE International Conference on Electronics
Computer Technology (ICECT), vol. 3, 2011, pp. 94–98.
[20] “Ecg feature extractor,” Last visited September 2014. [On-line]. Available: http://zone.ni.com/reference/en-XX/help/373696B-01/ lvbiomed/bio_ecg_extractor/
[21] J. Pan and W. J. Tompkins, “A real-time qrs detection algorithm,”
Biomedical Engineering, IEEE Transactions on, no. 3, pp. 230–236, 1985. [22] P. Cunningham, M. Cord, and S. J. Delany, “Supervised learning,” in
Machine Learning Techniques for Multimedia. Springer, 2008, pp. 21– 49.
[23] A. Taddei, G. Distante, M. Emdin, P. Pisani, G. B. Moody, C. Zeelenberg, and C. Marchesi, “The european st-t database: standard for evaluating sys-tems for the analysis of st-t changes in ambulatory electrocardiography,”
Eur Heart J, vol. 13, no. 9, pp. 1164–72, 1992.
[24] “Labview for ecg signal processing,” Last visited September 2014. [Online]. Available: http://www.ni.com/white-paper/6349/en/
[25] I. H. Witten, E. Frank, L. E. Trigg, M. A. Hall, G. Holmes, and S. J. Cunningham, “Weka: Practical machine learning tools and techniques with java implementations,” 1999.