HAL Id: hal-02618994
https://hal.inrae.fr/hal-02618994
Submitted on 25 May 2020
HAL is a multi-disciplinary open access
archive for the deposit and dissemination of
sci-entific research documents, whether they are
pub-lished or not. The documents may come from
teaching and research institutions in France or
abroad, or from public or private research centers.
L’archive ouverte pluridisciplinaire HAL, est
destinée au dépôt et à la diffusion de documents
scientifiques de niveau recherche, publiés ou non,
émanant des établissements d’enseignement et de
recherche français ou étrangers, des laboratoires
publics ou privés.
Distributed under a Creative Commons Attribution| 4.0 International License
Stefania del Prete, Anne Molitor, Delphine Charif, Nadia
Bessoltane-Bentahar, Ludivine Soubigou-Taconnat, Cécile Guichard,
Véronique Brunaud, Fabienne Granier, Paul Fransz, Valérie Gaudin
To cite this version:
Stefania del Prete, Anne Molitor, Delphine Charif, Nadia Bessoltane-Bentahar, Ludivine
Soubigou-Taconnat, et al.. Extensive nuclear reprogramming and endoreduplication in mature leaf during
floral induction. BMC Plant Biology, BioMed Central, 2019, 19, �10.1186/s12870-019-1738-6�.
�hal-02618994�
R E S E A R C H A R T I C L E
Open Access
Extensive nuclear reprogramming and
endoreduplication in mature leaf during
floral induction
Stefania Del Prete
1, Anne Molitor
1, Delphine Charif
1, Nadia Bessoltane
1, Ludivine Soubigou-Taconnat
2,3,
Cécile Guichard
2,3, Véronique Brunaud
2,3, Fabienne Granier
1, Paul Fransz
4and Valérie Gaudin
1*Abstract
Background: The floral transition is a complex developmental event, fine-tuned by various environmental and endogenous cues to ensure the success of offspring production. Leaves are key organs in sensing floral inductive signals, such as a change in light regime, and in the production of the mobile florigen. CONSTANS and FLOWERING LOCUS T are major players in leaves in response to photoperiod. Morphological and molecular events during the floral transition have been intensively studied in the shoot apical meristem. To better understand the concomitant processes in leaves, which are less described, we investigated the nuclear changes in fully developed leaves during the time course of the floral transition.
Results: We highlighted new putative regulatory candidates of flowering in leaves. We observed differential expression profiles of genes related to cellular, hormonal and metabolic actions, but also of genes encoding long non-coding RNAs and new natural antisense transcripts. In addition, we detected a significant increase in ploidy level during the floral transition, indicating endoreduplication.
Conclusions: Our data indicate that differentiated mature leaves, possess physiological plasticity and undergo extensive nuclear reprogramming during the floral transition. The dynamic events point at functionally related networks of transcription factors and novel regulatory motifs, but also complex hormonal and metabolic changes. Keywords: Floral transition, Leaf, Arabidopsis, Transcription, Non-coding RNA, Transcription factors, DNA motif, Endoreduplication
Background
The transition to flowering is a decisive developmental event in the plant life cycle for reproductive success. The general understanding highlights a fine-tuned process in-volving a complex interplay between environmental and endogenous cues. Signals are perceived and decoded ac-cording to the plants’ lifestyle, and lead to a cascade of dramatic morphological changes at the meristem level, to produce floral organs [1,2].
Photoperiod is a major parameter controlling the transi-tion to flowering with intricate phototropic effects and links with the circadian clock. The light signal, perceived
in the leaves, triggers the accumulation of metabolites and regulators, such as the well-conserved FLOWERING LOCUS T (FT) protein, whose expression is under the control of the CONSTANS (CO), a zinc finger transcrip-tion factor involved in photoperiod pathway [3]. Their ex-port, as systemic florigen signals via the vasculature to the distant shoot apical meristem (SAM), activates floral homeotic genes [4–6]. Described as a quantitative long-day (LD) species, the photoperiodic property of Ara-bidopsis species was exploited to induce synchronous flowering by exposure to a single LD or a single displaced short-day (SD), providing a convenient experimental in-ductive system [7]. Besides photoperiod, other regulatory pathways partake to the vegetative-to-reproductive switch control [8–10].
© The Author(s). 2019 Open Access This article is distributed under the terms of the Creative Commons Attribution 4.0 International License (http://creativecommons.org/licenses/by/4.0/), which permits unrestricted use, distribution, and reproduction in any medium, provided you give appropriate credit to the original author(s) and the source, provide a link to the Creative Commons license, and indicate if changes were made. The Creative Commons Public Domain Dedication waiver (http://creativecommons.org/publicdomain/zero/1.0/) applies to the data made available in this article, unless otherwise stated.
* Correspondence:[email protected]
1Institut Jean-Pierre Bourgin, INRA, AgroParisTech, CNRS, Université
Paris-Saclay, INRA Centre de Versailles-Grignon, Bât. 2, RD10 Route de Saint-Cyr, 78000 Versailles, France
From transcriptional and chromatin-based mechanisms, to alternative splicing and post-translational regulation, numerous regulatory levels participate to the control of the floral transition [9,11–15] and its main actors, which have been gathered in the Flowering-Interactive Database (FLOR-ID) [16]. Besides protein regulators involved in de-velopmental transitions, an increasing number of studies have highlighted the regulatory functions of long non-coding RNAs (lncRNAs) [17, 18]. In response to vernalization, the lncRNAs COLDAIR, COLDWRAP, COOLAIR, and Antisense Long participate to the fine regulation of the key MADS-box floral repressor FLOW-ERING LOCUS C (FLC)via modifications of FLC chroma-tin environment [19–23]. Recently, FLORE, a Natural Antisense Transcript (NAT) of CYCLING DOF FACTOR5 (CDF5) was shown to positively regulate flowering time, repressing CDF TFs (CDF1, CDF3, CDF5), and subse-quently increasing FT expression [24]. LncRNAs are versatile regulators involved in transcriptional gene regu-lation, in guiding or scaffolding protein complexes in-volved in chromatin organization and gene regulation, or even in post-transcriptional regulatory mechanisms [25]. Due to their large number estimated at several thousands and their diversity (intergenic ncRNAs, intronic ncRNAs, antisense RNAs, cis or trans NATs…) [19,23,26,27], their functional annotations and roles in developmental phase transitions remain poorly explored.
The transition to flowering is an integrated process at the scale of the whole plant. Few studies analyzed the transcriptional behaviors of meristematic and root tissues during the floral transition at the genome level [28–32]. Early studies identified few CO targets differ-entially expressed during flowering in leaves, among which FT [33] which was identified as the major CO target involved in the SD to LD shift response [34]. FT is referred as a flowering integrator with TWIN SISTER OF FT (TSF) [35, 36]. Subsequent studies in-creased the number of associated genes involved in the leaf response during flowering (see FLOR-ID overview and references therein). However, the dynamics of genome-wide transcriptomes in leaves during the floral transition has not been reported des-pite the key functions of leaves as receptors of the in-ductive photoperiodic signal and producer of florigenic molecules. Here, by exploiting the inductive response to a long-day (LD) shift [7] and disconnect-ing leaf growth or developmental responses from the floral inductive response, we performed a large tran-scriptome analysis, and identified novel loci and regu-latory elements involved in flowering in mature leaves. The transcriptome dataset enabled us to highlight molecular events, providing new insights into transcriptional reprogramming in leaves accom-panying the floral transition. Observations of
endoreduplication events supported transcriptome data and suggested a novel function in flowering.
Results
Flowering and organ growth in mature leaves
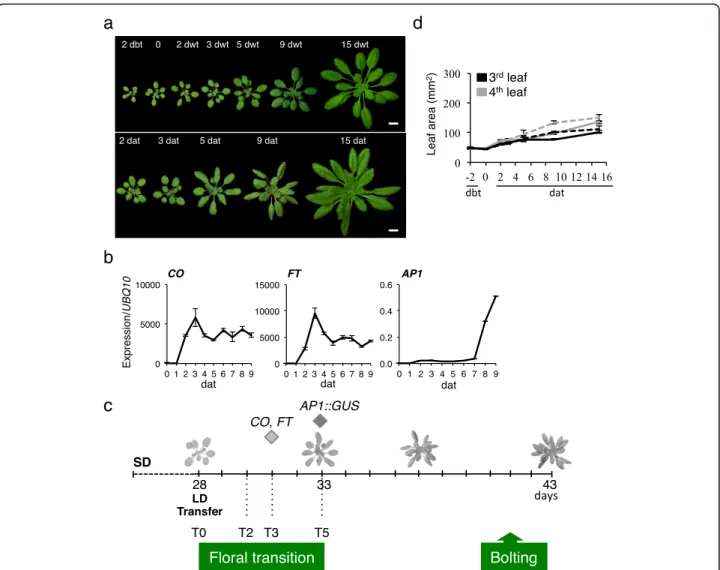
Our experimental system was based on a photoperiodic shift from SD to LD, which induces a synchronized flow-ering appropriate to analyze the floral transition (Fig.1a, Additional file 1: Figure S1a). The floral transition win-dow was determined by the onset of the expression of COand FT, two early markers for flowering and of APE-TALA 1 (AP1), an early marker of the floral meristem identity (Fig. 1b, c). CO and FT expression rapidly in-creased after the transfer in LD, and reached a max-imum at 3 days after transfer (dat), with a slight delay for FT consistently with the primary activating role of CO(Fig. 1b). Although AP1 mRNA transcripts were de-tected at 7 dat, AP1 expression was slightly earlier (at 5 dat) in meristematic cells when using an AP1::GUS transgenic line, suggesting a completion of the floral transition at that time (Fig. 1b, c, Additional file 1: Figure S1b).
To complete our characterization, we monitored organ growth accompanying the photoperiodic shift. No sig-nificant difference was detected in the rosette size during the window of 0–5 dat between the continuous SD and SD-LD conditions, whereas the first six rosette leaves presented different behaviors (Fig. 1d, Additional file2: Figure S2). The size of the first two leaves was already established 2 days before transfer (dbt), independently of the photoperiodic conditions. Leaves 3–4 showed no sig-nificant differences in growth rate between SD and SD-LD conditions from 0 to 5 dat. Leaves 5–6 presented a higher and continuous growth rate over the 15 days. Thus, during the 5-day floral transition window, devel-opmental and growth processes are arrested in leaves 3– 4, which makes this pair of mature leaves appropriate material for investigating the early molecular events associated with floral transition, independent of other developmental or signaling events.
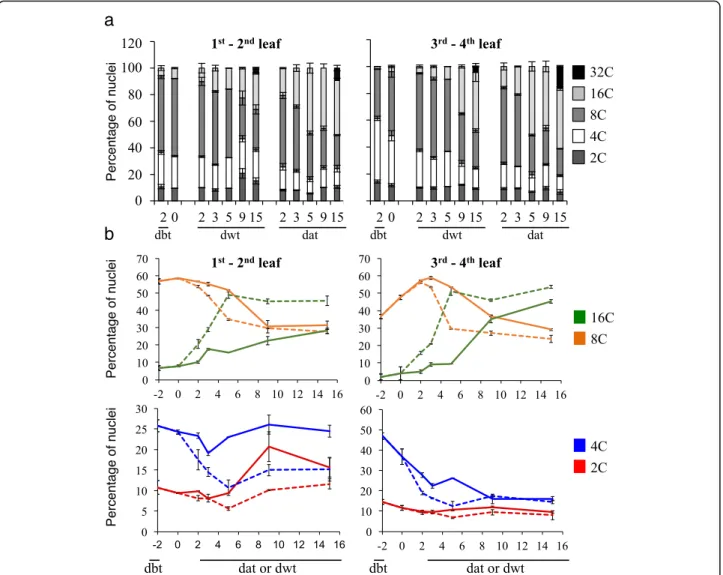
Ploidy level changes during the floral transition window Since plant development is accompanied by endoredu-plication, we analyzed the ploidy distribution in leaves 1–4. Independently of the leaf position, age and growth conditions, the percentage of 2C ploidy nuclei was rela-tively constant (Fig.2), suggesting a low cell division rate in agreement with the growth analysis. The ploidy levels evolved over time from 4C to 32C. The dynamics was dependent on the leaf position and the growth condi-tions. The ploidy levels in leaves 3–4 in both conditions suggested that endoreduplication events occurred (8C and 16C nuclei) in response to the LD shift. A popula-tion of 32C nuclei was detected at 15 dat and was
significantly larger in SD-LD compared to SD condi-tions. The endoreduplication index evolved from 1.95 ± 0.01 (15 dwt) to 2.35 ± 0.03 (15 dat) in leaves 3–4, whereas it was rather constant in leaves 1–2 (2.08 ± 0.02 at 15 dwt versus 2.04 ± 0.09 at 15 dat). Thus, the photo-periodic SD-LD switch showed a significant increase in endoreduplication in mature leaves, which occurred dur-ing the 3–5 dat window of the floral transition, earlier compared to SD (15 dat).
Major changes in transcription profiles during the inductive shift
To characterize the molecular events during the floral transition, we examined RNA profiles in leaves 3–4 at dif-ferent time points (T0, T2, T3, and T5) (Fig. 1c, Add-itional file 3: Figure S3). We identified 20,284 genes
expressed at least in one of the four time points, with more than 6000 differentially expressed genes (DEGs) at the largest transition (T0/T2) and specific gene sets at the main T0/T2, T2/T3 and T3/T5 transitions. By assembling a non-redundant dataset of 14,621 long non-coding tran-scription units (lncTUs) based on TAIR annotations and published datasets, we also identified 531 differentially expressed lncTUs (DE-lncTUs) (Additional file 4: Figure S4, Additional file 5). These data endorse the highly dy-namic transcriptional activity in mature leaves in response to the SD-LD switch.
To characterize the transcriptome profiles, we per-formed a clustering analysis using different clustering methods and transformation functions (R package coseq). Twenty-four clusters formed by genes and lncTUs (Additional file 6) were identified and further
a
b
c
d
Fig. 1 Floral transition induced by a SD-LD switch in A. thaliana. a Col-0 plants were grown in SD for 4 weeks, kept in SD (upper row) or transferred in LD (bottom row) conditions. Day before transfer (dbt), day without transfer (dwt), day after transfer (dat). Scale bars, 1 cm. b Expression of key flowering time genes. Experimental values are mean ± SEM. c Schema with developmental events. The CO and FT expression peaks are indicated, whereas the AP1 expression initiation was considered as the upper limit of the floral transition (diamonds). T0, day of transfer in LD. d Area measurement of the third and fourth rosette leaves. SD conditions (continuous line), transfer in LD (dash line). Experimental values are mean ± SEM
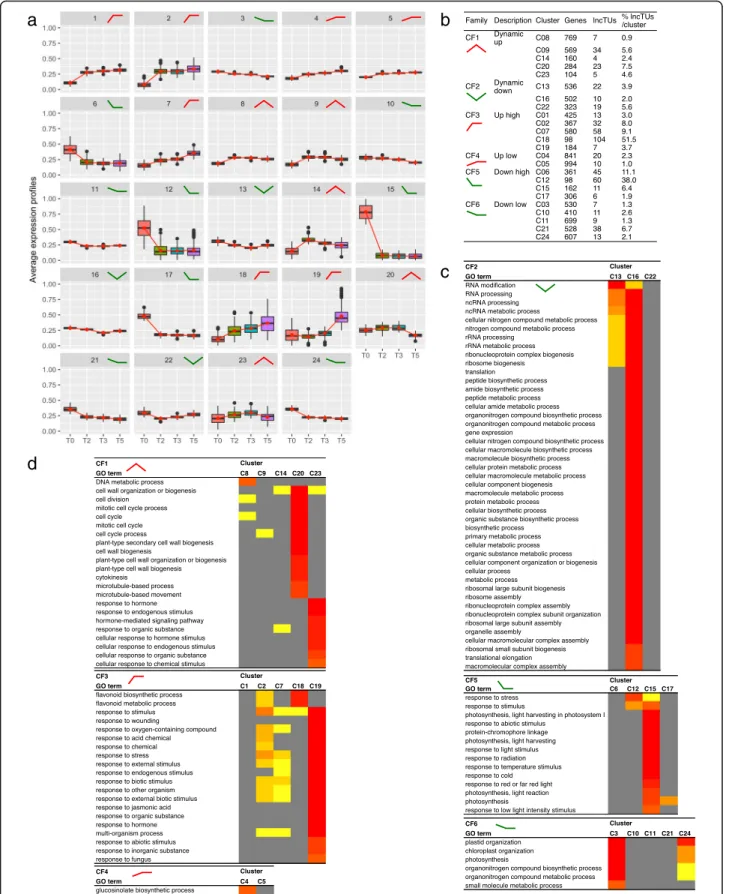
grouped into 6 cluster families (CF1 to CF6) according to expression tendencies (Fig. 3a, b): transiently-up (CF1) or down (CF2), stable high up (CF3) or down (CF5), stable low up (CF4) or down (CF6).
The 24 clusters had specific GO term enrichments, even among cluster families, such as seven clusters (C20, C23, C16, C18, C19, C15, C4, C3) with strong signa-tures, thus supporting the cluster analysis (Fig. 3c, d, Additional file 7). This classification revealed different processes in mature leaves during the SD-LD response. For instance, C3, C15, C17 and C24 were enriched in down-regulated genes involved in photosynthesis chloro-phyll biosynthesis process, light harvesting, or plastid organization, pointing at a reprogramming of the photo-synthetic apparatus. C12 and C15 from CF5 and most clusters in CF3 were enriched in stress-associated terms, such as defence response, response to stimuli, response-to-wounding, highlighting a stress association
with the changes in photoperiod, light and perturbation of the circadian clock. In accordance, we noticed in C19, C2 and C14,“child” GO terms associated with jasmonic acid, salicylic acid or brassinosteroids, respectively. Sec-ondary metabolites, such as flavonoids (C18) and the defence-related glucosinolates (C4), and carbon metabol-ism (GO terms such as“glucan catabolic process”, “cel-lular polysaccharide catabolic process” in C17) were also modified. We observed enrichments in GO terms associ-ated with cell wall, such as “cell wall organization” and “xyloglucan metabolic process” in C14 or “plant-type secondary cell wall biogenesis” and “cellulose metabolic process” in C20. For instance, XYLOGLUCAN ENDO-TRANSGLUCOSYLASE/HYDROLASE 9 (XTH9) in-volved in cell wall loosening was up-regulated in C14 (log2 ratio 1.85, FDR 1.28E-3 at T0/T2). These data sug-gest that the SD-LD switch is accompanied by cell wall remodeling and some cell wall plasticity in the mature
a
b
Fig. 2 Ploidy dynamics in leaves during the floral transition. Plants were grown 4 weeks in SD, then either, kept in SD or transferred in LD for 15 days. a Cumulative distributions. 32C nuclei were only detected at 15 dat. b Dynamics of the distribution of the 2C to 16C nuclei. Experimental values are mean ± SEM. dbt, day before transfer. Dwt, day without transfer (continuous line). dat, day after transfer (dash line)
a
b
c
d
Fig. 3 Hierarchical clustering of DEGs and DE-lncTUs using their expression levels. a Expression profiles of the 24 clusters. b Composition of the clusters and their organization into 6 cluster families (CFs) according to their general expression tendencies. c-d Heat maps with the biological process GO terms of the clusters per family using SEACOMPARE. Only GO terms with FDR < 10–8 at least in one of the clusters are presented
leaves in response to environmental changes. Cell wall modifications were reported in roots in response to inor-ganic phosphate starvation or in hypocotyl in response to light signaling [37]. Such examples of cell wall remod-eling in relation to environment signaling remain rarely reported, especially in leaf. We also noticed in C14 a GO term“response to cyclopentenones”, which are fatty acid derivatives with signaling activities. C16 cluster, belonging to CF2 with a transient down-regulation profile, had the highest enrichment terms related to translation, RNA pro-cessing and metabolism, suggesting that a strong modifi-cation of the protein metabolism at the cellular level is possibly escorting the transition of the metabolic regime occurring in the whole plant during the switch to repro-ductive phase. Such transient modifications of translation and associated processes were also observed during a cell dedifferentiation and re-differentiation process in Arabi-dopsis protoplasts [38]. Finally, C20 was enriched in GO terms associated with cell cycle processes. The modifica-tions of the expression of LGO/SMR1, KRP2 and KRP6 cell cycle inhibitor genes involved in endoreduplication [39], the CYCA2;3, a suppressor of endocycles, the major cell-cycle markers, CDKB2.1, CYCA1;1, and WEE1, a negative regulator of the entrance in the M phase [40,41] were consistent with the onset of the observed endocycles (Additional file8: Figure S5). In summary, leaf transcrip-tome during the floral transition revealed major changes in numerous processes, such as carbon and secondary me-tabolism, signaling events, and endoreduplication.
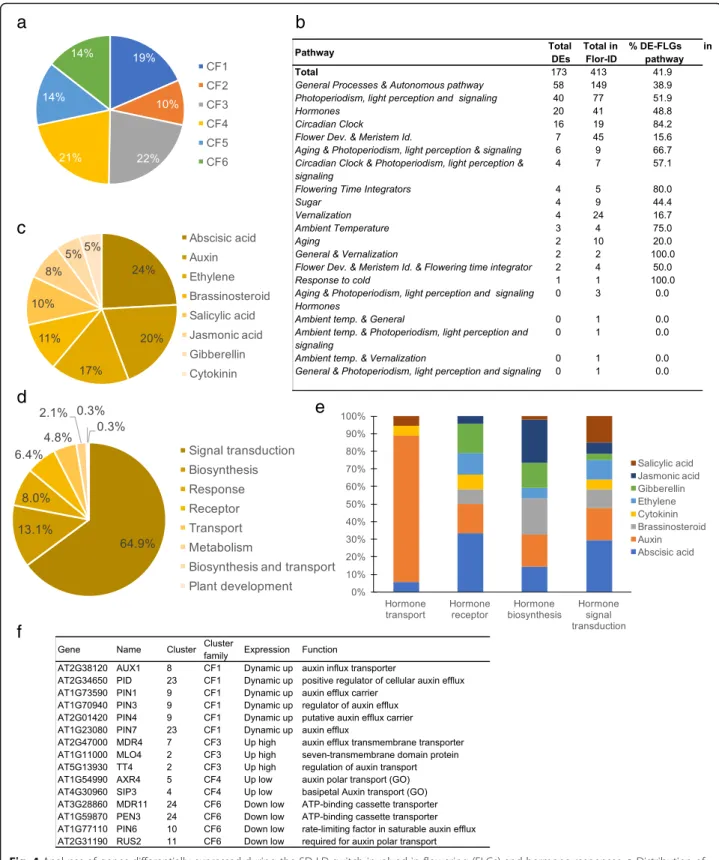
Flowering and hormone-related genes are differentially expressed in mature leaves during the floral induction The FLOR-ID core database records genes (FLGs) re-lated to the different regulatory pathways of flowering time and to flower development [16]. To better characterize the molecular events, we analyzed the ex-pression of these genes in mature leaves during the floral transition. We identified a set of 173 DE-FLGs out of the 413 FLGs. These genes were rather evenly distrib-uted among different clusters and regulatory pathways (Fig. 4a, b, Additional file 9). As expected, the major floral integrators were upregulated, such as FT, TWIN SISTER OF FT(TSF), BROTHER OF FT (BFT), CO and COL1. The 173-gene set also included flower meristem identity and flower development (FMI-FD) genes, such as AP2, PETAL LOSS and SEPALLATA 4. Consistently with the experimental design based on a photoperiod shift, most of the FLOR-ID genes classified as associated with the circadian clock were differentially expressed (84.2%). This large number of DEGs from FLOR-ID in mature leaves highlighted how complex and broad the regulatory gene network of the floral transition is.
In the Arabidopsis Hormone Database (AHD) [42], we identified 331 DEGs involved in hormonal regulation
from biosynthesis, metabolism, perception, and transport to hormonal responses. C23 was the most enriched clus-ter with these genes (Additional file10; Additional file11: Figure S6). We noticed that genes related to abscisic acid (ABA) and auxin were the most represented ones among the DEGs (Fig. 4c). Genes involved in the ABA biosyn-thesis were down-regulated in agreement with a repres-sive role of ABA in flowering [43]. However, the switch also largely impacted genes related to hormone signal transduction such as auxin transport (Fig.4d, e). Among the DEGs involved in auxin-hormone transport, most genes were up-regulated at least transiently during the switch, such as several PIN members (Fig.4f ), question-ing the role of auxin transporters in the flowerquestion-ing time control. Genes involved in gibberellin (GA) biosynthesis were mainly down-regulated, while GAMT2, a methyl-transferase involved in the GA metabolism was acti-vated, as well as negative regulators of GA responses (RGA-LIKE1–2) (Additional file11: Figure S6b). Indeed, genes involved in cytokinin (CK) biosynthesis and the SOB FIVE-LIKE 1, 2genes (SOFL1, 2), which participate to CK level regulation [44] were activated, whereas genes involved in CK catabolism (CKK4, CKK6) were down-regulated. Consistently, the type-B ARABIDOPSIS RESPONSE REGULATOR 10 (ARR10) TF, a key player in the CK signaling pathway for the light response and shoot initiation [45], was up-regulated between T0/T5. Beside DEGs involved in one hormonal pathway, 36 DEGs are involved in hormonal crosstalk, with ABA be-ing involved in most of these crosstalk (Additional file12). Whereas GA is proposed to promote the floral transition and have antagonistic effects with ABA, our data suggest a complex hormonal interplay during the SD-LD switch, with GA, ABA but also new players such as the brassi-nosteroids and derivative forms, as well as IAA and CKs. Novel regulatory actors involved in the SD-LD switch To identify regulatory elements associated with flower-ing in mature leaves, we performed an ab initio search of motifs amongst the promoters of coregulated genes in each cluster, using the Preferentially Located Motifs (PLM) detector algorithm [46]. We identified 192 signifi-cant motifs of 4 to 11 bases, distributed over the 24 clus-ters (M001 to M192, p-value < 0.05) (Fig. 5, Additional file 13). We then restricted our analysis to the seven-mers or longer motifs (91 motifs). Their oc-currence varied from a unique motif (M055) in 11 differ-ent clusters to 20 motifs presdiffer-ent in only one cluster. We questioned whether these motifs corresponded to previ-ously discovered transcription factors bindings sites (TFBSs) by using the Tomtom Motif Comparison Tool [47] and two databases of functional motifs identified by protein-binding microarrays (PBMdb) [48], and by DAP-seq (DAPdb) [49]. We kept only significant motifs
a
b
c
d
e
f
Fig. 4 Analyses of genes differentially expressed during the SD-LD switch involved in flowering (FLGs) and hormone responses. a Distribution of the DE-FLGs in the different cluster families. b Repartition of the DEGs in the regulatory pathways involved in flowering. c, d Distribution of DEGs belonging to the AHD according to hormones (c) and to the pathways (d). e Distributions in the 5 main functional pathways. f DEGs related to auxin transport
(E-value < 0.01; for DAP motifs, overlap value larger than 75%). Thirteen motifs were similar to known motifs targeted by 32 TFs from these databases (Fig. 5), the remaining motifs correspond to putative novel regula-tory elements, whose function will require further investigation.
The 32 TF set was enriched in GO terms associated with “regulation of metabolic process” (GO:0019222; p-value 5.65E-29, FDR 1.11E-26), “response to hormone stimulus” (GO:0009725; p-value 3.86E-12, FDR 3.53E-10) and “circadian rhythm” (GO:0007623; p-value 8.68E-10, FDR 6.43E-08) (PlantGSEA toolkit). The M001 motif
a
b
c
d
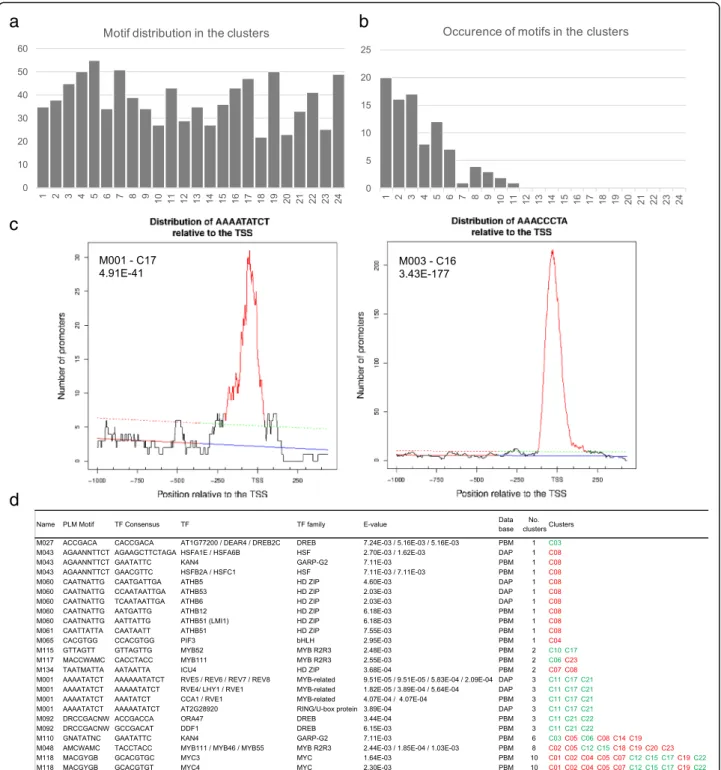
Fig. 5 Identification of preferentially located DNA motifs (PLM). a Distribution in the 24 clusters of the PLM motifs (≥7 bp). b Occurrence of the motifs (≥7 bp) in the clusters. For instance, there are 20 motifs present in only one cluster and 1 motif present in 11 clusters and no motif present in more than 12 clusters. c Distribution of the M001 and M003 motifs relative to the TSS. d PLM motifs corresponding to known TF binding sites and their presence in clusters. In green, clusters mainly down-regulated; in red, clusters mainly up-regulated
(AAAATATCT) matched to the TFBS recognized by CCA1, LHY1, RVE1, and RVE5–8 TFs and to the “Even-ing Element”, involved in the control of circadian-regu-lated genes [50] and identified, for instance, in down-regulated genes such as SVP, PHYTOCLOCK 1 (PCL1) and LONG VEGETATIVE PHASE 1 (LOV1). M118 (MACGYGB) is similar to the TFBS of the MYC3 and MYC4, two TFs involved in flowering [51]. Intri-guingly, no TF could be associated with M003 (AAAC CCTA) and M004 (AAACCCTAA), the two closely re-lated motifs with the best PLM p-values (3.43E-177, 5.39E-104, respectively). Remarkably, M003 was highly similar to the (A/G/T)AACCCTA(A/G) motif, an LHP1 binding motif, related to the telo-box motif (AAACCCTA) and recognized by REPEAT BINDING PROTEIN1 (TRB1) [52], and to a lesser extent, to the tertiary motif of TOE1 (AACCTTAA), a TF belonging to the AP2/EREBP superfamily (E-value 0.54 using the PBMdb). Both LHP1 and TOE1 are known to repress flowering, LHP1 being a component of PRC1 complex [53,54] and TOE1 inhibit-ing the CO activity in the FT activation [55]. A majority of these 32 TFs (56%) were differentially regulated during the process, implying functional preferences of the identi-fied motifs.
We thus further analyzed the expression of TFs by using the PlantTFDB [56], and identified 648 differen-tially expressed TFs, belonging to 51 TF families (Add-itional file 14). FT, TSF and BFT were co-regulated with 7 other TFs (among which, NAC3, NLP3, WOX2, and ASG4) (C18) and CO and COL1 with 38 other TFs (C02), enlarging regulatory networks. The transiently-up C23 cluster from CF1 had the highest percentage of TFs among its DEGs, in agreement with the largest tran-scriptional switch occurring at T0/T2 (Fig.6a). For some TF families, a large proportion of the members were dif-ferentially expressed, suggesting important roles of these families in the response to the SD-LD shift. One of these family, the family of BBX proteins, comprises the DBB (double B-box (BBX) zinc finger protein subfamily and the CO-like subfamily [57, 58] (mainly down-regulated; 10 out of the 17 DEGs) (Fig.6b). The BBX family com-prises regulators involved in the circadian clock, photo-morphogenesis, flowering time, flower development, or stress responses, such as the flowering activator COL5 [59], BBX2/COL1 a circadian clock regulator [57] or the flowering repressor COL9 [60]. These data indicate pu-tative synergistic and antagonistic roles among the BXX family for the SD-LD switch. Thirty-nine other TFs in C2, among which 5 unknown TFs may be putative novel candidates for flowering time control in the mature leaf. The expression of the NF-Y (Nuclear Factor Y) family was also largely altered. The conserved NF-Y complexes are composed of NF-YA, NF-YB and NF-YC subunits and involved in development, stress response and
flowering [61–64]. Here, the NF-YA subunits were mainly up-regulated (8 out 9 NF-YA in CF3 and CF4, the up-high and up-low cluster families) compared to the other subunits (2 NF-YB, 4 NF-YC), and some sub-units were coregulated (such as NF-YA4/NF-YB2/ NF-YC2 in CF3, or NF-YA8/NF-YA9/NF-YB3 in CF4), suggesting specific and dynamic compositions of NF-Y complexes. The three members of the small WHIRLY (WHY) family of single-stranded DNA binding proteins were also mainly down-regulated (C10, C13). WHIRLY1 was proposed to be involved in the gene regulation and chloroplast-to-nucleus retrograde signaling in response to redox processes occurring during light adaptation [65,
66]. While WHIRLY1 has a dual chloroplastic/nuclear localization, WHY2 and WHY3 are targeted to mito-chondria and chloroplast, respectively. These data sug-gest a novel chloroplast-to-nucleus signaling in flowering time control.
Among FLOR-ID, a functionally related subset of 64 TFs, corresponding to the differentially expressed TFs of the database (64 out of 143) (Additional file15) was ana-lyzed using the TF2Network tool [67] to decipher gene regulatory networks in the mature leaf. We identified 66 specific candidate regulators, by comparison with the subset corresponding to the FLOR-ID TFs, which were not differentially expressed (data not shown). The best-ranked regulators were HYH, ABF1, TCP21, ABI5, MYC2 and HY5 (Additional file16: Figure S7), suggest-ing candidate regulators of the floral transition in mature leaf. The identification of ABI5 and ABF1 as candidate regulators, which are TFs involved in ABA responses, was in agreement with the high percentage of ABA-related genes differentially expressed in mature leaf during the floral transition (Fig.4c).
Finally, since chromatin is a key transcriptional regula-tory level, we searched for key chromatin-associated genes (CAGs) involved in flowering. We identified 90 DE-CAGs, 91% being differentially expressed at T0/T2, with a bias towards up-regulated genes (Additional files
17and 18). We noticed that a large proportion (39%) of the DE-CAGs encoded histone variants with, for in-stance, the H1.3 variant (HON3), associated with stress response, 5 H3.1 variants, which are incorporated in a replication-dependent manner in agreement with the endoreduplication events or 10 H2A variants (Fig. 6c). Among the genes involved in histone post-translational modifications, such as genes encoding SDG4/ASH1-RE-LATED 3 and SDG13/SUVR1 histone methyltransfer-ases, were up-regulated, whereas histone deacetylases were only weakly differentially expressed, except HDA2, which was down-regulated and associated with the floral transition for the first time here. Consistently with modi-fications in DNA methylation accompanying early floral transition events, we observed the expression changes of
a
c
b
Fig. 6 TFs and chromatin-associated genes differentially expressed during the floral transition. a TF Distribution in the clusters. b B-Box containing TFs. c Histone-related genes
MET1, CMT3 but also of DEMETER-LIKE2 (DML2), encoding a DNA glycosylase involved in active DNA de-methylation, in the mature leaves. Thus, the results sug-gest a rapid modification of the epigenome, concomitant with the changed TF profiles, which further endorses a dramatic reprogramming in the leaf genome, reminis-cent of another developmental switch [38].
A set of lncTUs is differentially regulated during the floral transition
To identify lncTUs with putative regulatory function, we firstly questioned whether the 14,621 lncTUs regions of our dataset and the 531 DE-lncTUs were associated with specific genome topographical characteristics, especially the nine chromatin states (CS) [68] (Fig. 7a). Consist-ently, lncTUs were globally preferentially associated with CS4 that corresponds predominantly to distal promoter regions and non-coding intergenic regions. CS4 has high levels of H3K27me3 and reduced levels of active histone marks. To a lesser extent, but still significantly, lncTUs are prevalent in CS5, the Polycomb-regulated CS also enriched in high H3K27me3 levels, and in CS8, the AT-rich heterochromatin, but not with the constitutive heterochromatin (CS9). Whereas the fold changes for lncTUs and DE-lncTUs were quite similar in CS8, a large discrepancy was observed between the two sets in the bivalent chromatin state, CS2. We observed a low number of DE-lncTUs in regions targeted by PCF11-SIMILAR PROTEIN 4 (PCFS4), a key factor involved in flowering time and acting on the FCA alter-native processing [69] (Fig.7a). These results suggest the existence of sets of lncTUs associated with specific chro-matin states and with specific regulatory activities during the floral transition, such as the CS2 subset of the 193 DE-lncTUs or the PCSF4 subset.
A hierarchical clustering analysis revealed that the ma-jority of the 531 DE-lncTUs were either up- or down-regulated, whereas only 15 DE-lncTUs changed dynamically (Fig. 7b, c). This indicates that most of the of DE-lncTUs were mainly specific for either the vegeta-tive or the reproducvegeta-tive phase, while fewer specific ones are involved in the transition event only.
To find out if lncTUs can change the expression of genes in cis we examined the expression of both the lncTUs and their neighboring genes. No correlation be-tween expression and structure could be detected at the genome level. We then investigated whether lncTUs may have putative NAT regulatory function by analyzing lncTUs with overlapping genes. The FLORE NAT, for example, represses CDF5 located in antisense but also CDF1 and CDF3 located on other chromosomes and participates to the flowering time control [24]. Whereas CDF2 was up-regulated, CDF3 and CDF5 were down-regulated in our data. Putative lncTUs that we
could identified in the regions of CDF2, CDF3, and CDF5 were not differentially expressed in our experi-mental design, which suggests that other regulatory mechanisms control CDF expression. Alternatively, tran-sient changes in the expression of the corresponding lncTUs could not be detected. In our dataset, we found that 655 lncTUs overlapped with a flanking gene and were transcribed in antisense (putative NAT lncTUs). Among them, 19 NAT lncTUs showed opposite tran-scriptional activity with the overlapping gene, in at least one of the 6 comparisons (Fig. 7d, Additional file 19). However, the expression dynamics of the gene and its NAT lncTU may be more complex and the two partners may have no synchronized expression. For instance, a lncTU formed a NAT couple with MAF5 (LNCRNA--MERGE_C-9859, named MAF5_NAT), encoding a floral repressor of the FLC clade. MAF5 was differentially reg-ulated during the floral transition and MAF5_NAT was strongly down-regulated before the up-regulation of MAF5 (Additional file 20: Figure S8). This is different from the transient up-regulation of antisense regulatory ncRNAs which represses FLC, thus illustrating the com-plexity of the flowering regulation mechanism.
Finally, for each DE-lncTU, we examined the presence of the TFBSs of the SVP, FLC and SOC1 flowering regu-lators, in a 4-kb window (3 kb upstream - 1 kb down-stream) [70–74]. We identified 123 TFBSs in the vicinity of 63 DE-lncTUs, with one to seven of these binding sites mainly present in the 5′ regions, suggesting some functionality of these TFBSs regarding the expression of the DE-lncTUs and putative roles of these TFs in lncTU regulation (Fig. 7e, f, Additional file 21). Furthermore, some of the DE-lncTUs with TFBSs were located in CS2 and/or involved in NAT couples. Based on these criteria (expression profile, presence of TFBS, location in spe-cific chromatin state, NAT couple), the identified DE-lncTUs represent interesting candidates whose regu-latory function in flowering will require further investigation.
Discussion
Complex molecular processes in mature leaves during the floral transition
In sensing floral inductive stimuli, leaves produce the florigen signal that switches the SAM from the vegeta-tive to reproducvegeta-tive phase. Key genes involved in produ-cing the florigen have been identified, but the global molecular events in leaves during the floral transition re-main poorly described. By focusing on mature rosette leaf whose growth was completed, our study completes analyses and highlights molecular events of the floral transition in this organ. Based on differential gene ex-pression profiles, we showed that the floral transition induced by the SD-LD switch is accompanied by
a
b
c
d
e
f
g
re-organization of photosynthetic capacity, protein syn-thesis, cellular metabolism, hormonal action, stress re-sponse and cell cycle regulation, with an intricate interplay between the light regime, the circadian clock and the floral transition. Our data highlight the complex role of mature leaves in the floral transition.
LD stimulates increases in leaf sucrose level as part of the florigenic signal [75–77]. However, other metabolites are also involved in the floral transition: carbon, phosphorous, nitrogen or sulphur can impact this process [4,78]. Genes associated with flavonoids and glucosinolates contents were differentially regulated during the photoperiodic switch, whereas these secondary metabolites are usually associated with stress responses [79]. These data support a recent study showing that the flowering regulator FLC is present in a QTL interval associated with glucosinolate contents in the brassicaceae species, Aethionema arabicum [80]. The switch occurring in the SAM appears to require massive metabolic and physiologic reprogramming events in the leaf to further explore.
Highlight of new regulatory candidates in flowering control
Dynamics changes were reported in the transcriptional profiles of genes but also lncRNAs, highlighting the poten-tial regulatory functions of some of them in the floral tran-sition. Our atlas of lncTUs, with putative regulatory functions based, for instance, on their location in bivalent chromatin states or in antisense with protein-coding genes, provides promising resource for new actors in the genome regulation during the floral transition.
The analysis of the gene clusters allowed the extrac-tion of specific putative regulatory motifs. Some of these DNA elements corresponded to binding sites of differen-tially expressed TFs, suggesting functionality in the tran-scriptional regulation of the floral transition. In parallel, a large set of differentially expressed TFs involved in various processes was identified, consistently with the molecular processes highlighted with the GO analysis. Changes in transcription of a set of FMI-FD genes, whose action is crucial in meristems, suggest other levels of gene regulation during the floral transition.
By focusing on FLOR-ID TFs, we highlighted small gene regulatory networks and potentially, new players in the floral transition in leaf, such as ABI5, ABF1, or
TCP21. TCP21 is involved in the circadian clock regula-tion and controls CCA1 expression [81]. The identifica-tion of TCP21 as candidate regulator here is in agreement with the large proportion (84.2%) of circadian clock–associated genes differentially expressed, during the SD-LD switch (Fig.4b). ABI5 was reported as a floral repressor [82], which is consistent with its down-regula-tion here during the SD-LD switch and its putative in-teractions with the downstream deregulated TFs. ABA is involved in the control of flowering time with opposite effects according to environmental conditions [83–85]. For instance, ABA was shown to promote flowering time in a LD-dependent manner and in response to water resource availability, by modulating GIGANTEA (GI) activity on FT and TSF [84, 85]. However, the down-regulation of GI here suggests that the ABA-dependent promotion of flowering may not be in-volved in the SD-LD transition, but a loss of repression mediated by ABI5 may possibly occur. The hormonal contribution of the GA-dependent promoting pathway [10] may also play a role. Most of the hormone pathways being affected during the switch, albeit to different de-grees, performing hormone dosages may help to untan-gle their contribution to flowering time.
Endoreduplication events accompanying the floral transition in leaves
The acceleration of the cell division was reported in the SAM during the floral transition in A. thaliana [29,86]. Here, we report that endocycles escort the floral transi-tion in leaves. Thus, the floral inductransi-tion is accompanied by modulations of the cell cycle in both leaves and meri-stems, but with differences in cell cycle exits according to the organs, endocycle or mitosis, respectively. Our re-sult is supported by the changes in expression of key cell cycle phase markers, such as CYCA2;3, but also histone variants and endocycle-related genes. Consistently with a loss of function stimulating endocycles [87], CYCD3 genes were down-regulated in our experiments. The spindle assembly checkpoint (SAC) genes were also shown to impact both the floral transition and the tim-ing of the endocycle onset [88]. Here, only BUBR1/ MAD3 from the SAC family was slightly down-regulated, but its function in the Arabidopsis mi-totic checkpoint control remain poorly documented. (See figure on previous page.)
Fig. 7 Analyses of lncRNAs during the photoperiodic inductive switch. a Heat maps of the lncTU distribution in the nine chromatin states and the PCFS4 target regions. The fold change was calculated based on the ratio between observed and randomly distributed lncRNAs. b Hierarchical clustering of the DE-lncTUs. c Hierarchical clustering of the dynamic DE-lncTUs. d DE-lncTUs in NAT orientation with genes differentially expressed at the same time point and corresponding potential NATs, as annotated in TAIR. e Venn diagram between the different DE-lncTU sets with FLC, SOC1 or SVP binding sites in their vicinities. f Distribution of the TFBSs of FLC, SOC1 or SVP inside (in), at the 5′ or 3′ end, overlapping on the 3′ or 5′ end of the lncTUs. g Venn diagram between lncTUs in CS2, lncTUs with SVP, FLC or SOC1 binding sites (TFs) in their vicinities and DE-lncTUs forming NAT couples
Hormone signaling pathways participate to the con-trol of the mitotic-to-endocycle transition: the endo-cycle repression is induced by high auxin contents [39, 89]. Consistently, we observed alterations of the auxin pathways during the photoperiodic inductive switch. The SUMO E3 ligase HPY2, described as an endocycle repressor, which may link auxin signaling and cell cycle program [89, 90], as well as two other negative regulators of endocycles, were up-regulated at the T0/T2 transition, suggesting that the entry into the endocycle program in the mature leaves may re-sult from a fine dosage between the different control-ling pathways.
Previous studies showed that the increase in light in-tensity [91] and UV-B radiation [92] are associated with changes in ploidy levels. A proposed hypothesis is that the ploidy dynamics might be an adaptive response to damage possibly induced by solar radiation. Finally, we could also speculate that the increase in ploidy level in mature leaves during the floral transition may contribute to an increase in energy production required for the de-velopmental switch, an increase in metabolites and en-dogenous signaling molecules, or a modulation of transcription thresholds.
Conclusions
Our detailed study provides a novel molecular frame-work to further question the roles of new putative regu-lators in leaves during the floral transition, such as new putative lncRNAs, whose polyadenylation status will re-quire further confirmation. Furthermore, it points at the relationship between flowering and endoreduplication and at the complex interplay between several plant hor-mones, which open new perspectives.
Methods
Plant materials and growth conditions
All Arabidopsis thaliana lines were in the Col-0 back-ground. Seeds of the pAP1::GUS transgenic line were kindly provided by Prof. Dr. G. Angenent (unpublished material). The AP1 promoter fragment was fused to a GUS-GFP cassette as described in [93], using the binary pBGWFS7 vector from VIB [94]. Plants were grown in growth chamber under SD (8 h light/16 h dark) or LD (16 h light/8 h dark) conditions. White fluorescent light was used. The photosynthetic photon flux density was 120μmol m− 2s− 1in SD and LD. In SD, the temperature was 21 °C during the light and 18 °C during the dark period, and the humidity (65%) remained constant. In LD, the temperature (21 °C) and the humidity (70%) remained constant, 21 °C and 70%, respectively. Plants were cultured for 3, 4 or 5 weeks in soil, in individual pot. The transfer was done at the end of SD light, pre-ceding the LD dark period. Flowering time indicators
were recorded as previously described [53](Additional file 1: Figure S1a). The percentages of cauline leaf tively to the total leaf number (CL%) quantifies the rela-tionship between bolting and floral transition events [95]. For plants grown 3, 4 and 5 weeks in SD and trans-ferred in LD it similar to the CL% in continuous LD (17.6%), and higher compared to continuous SD (11.9%) [96]. This preliminary assay showed that the SD-LD switch mimicked LD growth conditions. For a good com-promise between time and material quantity, analyses were then pursued on plants grown for 4 weeks in SD.
For RNA extraction, plants were collected at Zeitgeber time 7 (ZT7) in SD, and ZT15 in LD, ZT0 marking the transition from dark to light. For leaf growth analysis, in-dividual leaves were harvested at different time points, flattened on white paper and then digitally scanned. Leaf areas (blade and petiole) were calculated from the binary images using ImageJ software (http://rsb.info.nih.gov/ij/). Leaves from 10 to 15 plants were analyzed.
Ploidy analysis
Leaves 1 to 4 were harvested, chopped with a razor blade in 800μl of Galbraith buffer, filtered over a 30 μm mesh, and 150μl of a propidium iodide solution (100μg/ml) was added [97]. The quantification of the nuclear DNA content was performed on a CyFlow® cyt-ometer using the FloMax® software (Sysmex Partec, France) as described [98]. The endoreduplication index was calculated by using the formula: EI = 0x(% of 2C) + 1x(% of 4C) + 2x(% of 8C) + 3x(% of 16C) + 4x(% of 32C).
Expression analysis
Total RNAs were prepared from rosette material, treated and reverse transcribed, as previously described [99]. Quantitative real-time PCR was performed on a BioRad CFX96 apparatus using the SYBR green Master Mix (BioRad) following manufacturer’s instructions. UBIQUI-TIN10 was used as reference gene. Primers are listed in Additional file 22. For GUS histochemical staining, plants were collected in the staining solution (1 mM X-Gluc (5-bromo-4-chloro-3-indolyl-ß-D-glucuronide), 0.1 M sodium phosphate buffer, pH 7.0, 2 mM potassium ferrocyanide, 2 mM potassium ferricyanide, and 0.5% Triton X-100), infiltrated under vacuum 3 times, for 5 min each, and incubated at 37 °C overnight. Samples were then washed in 70% ethanol and observed under a light microscope.
RNA extraction, library preparation and sequencing Total RNA was extracted with the Plant RNeasy Mini kit (QIAGEN). 10μg of RNA was treated with TURBO DNA-free kit (Ambion Ref. AM1907) and cleaned-up from enzymatic reactions with RNeasy
MinElute Cleanup Kit (QIAGEN Ref. 74,204), follow-ing the manufacture instructions. RNA integrity and concentration were analyzed with the Agilent 2100 Bioanalyzer and the Agilent RNA 6000 Nano Kit (Ref. 5067–1511). For one replicate, leaves 3–4 were dis-sected from 20 plants and pooled. Three independent replicates were performed for each time point. Strand specific sequencing libraries were prepared from polyA RNAs using the Illumina Tru-Seq stranded RNA sample preparation v2 kit. Four libraries were multiplexed per lane and paired-end (PE) sequenced on an Illumina HiSeq 2000. Over 40 millions of 150 bp reads were generated per sample. All steps of the experiment, from growth conditions to bioinformatic analyses, were recorded in CATdb database [100]
(http://tools.ips2.u-psud.fr/CATdb/) Project ID
NGS2015_01_Transition according to the inter-national standard MINSEQE minimum information about a high-throughput sequencing experiment.
RNA-Seq data analysis
RNA-Seq samples were processed using the following pipeline: the read pre-processing criteria included trimming library adapters and performing quality con-trol checks using FastQC. The raw data (fastq) were trimmed using the FastX toolkit (Phred Quality Score > 20, read length > 30 bases). The Bowtie 2 mapper [101] was used to align reads against the A. thaliana TAIR 10 transcriptome. On average, 99% passed the quality filter and were uniquely mapped to the TAIR 10 reference genome. We extracted 33,602 genes from TAIR10 version database [102] with one isoform per gene corresponding to the representative gene model (longest coding sequence) given by TAIR10. The abundance of each gene was calculated by a local script, which parses SAM files and counts only paired-end reads for which both reads map un-ambiguously one gene, and by removing multi-hits. According to these rules, around 96% of PE reads were associated with a gene, 2% PE reads unmapped and 2% of PE reads with multi-hits were removed.
For differential expression analysis, we discarded genes, which did not have at least 1 read after a count per million (CPM) normalization, in at least one half of the samples. The library sizes were normalized using the TMM method. The count distribution was modelled with a negative binomial Generalized Linear Model (GLM) where the harvest date was considered. Disper-sion was estimated by the edgeR method [103] in the statistical software‘R’ (R Core team, 2015). The p-values were adjusted by the Benjamini-Hochberg procedure to control FDR. A gene was differentially expressed when its adjusted p-value was lower than 0.05.
Analysis of lncRNAs
We gathered a non-redundant dataset (IJPB_lncDB) of 14,621 putative lncRNA sequences from published lncRNAs datasets [26,104–106]. Redundant information was removed. Datasets were organized into three subsets according to strand information (+, −, Not Available (NA)). For each subset, we merged overlapping or “book-ended” lncRNA in a single transcription unit (lncTU). Three FASTA files of lncTUs were established: one with 5055 TUs on the positive strand, another one with 4851 putative TUs on the negative strand, and the last one with 4715 TUs, without strand information. All reads were mapped against the IJPB_lncDB using the Bowtie 2 mapper [107] using the same count criteria. Whereas 96% of the paired-end reads mapped to the TAIR10 genome as expected, the mean mapping per-centage to the lncRNA dataset was 0.78%. To establish the differentially expressed lncTUs, we used the GLM of edgeR, without or with filter using either the Bonferroni or Benjamini-Hochberg (BH) test corrections. All lncTUs differentially expressed identified using Bonfer-roni test were present in the list of DE lncTUs identified using BH test. We further analyzed BH DE lncTUs. No bias was observed for the distribution of the DE-lncRNAs on the two strands.
To determine overlaps between lncRNA and anno-tated chromatin states we used the online BEDTools suite. We established intersects for all lncRNAs, the DE lncRNAs and randomly reshuffled regions of identical size to compute the fold changes between observed and randomly distributed lncRNAs. The hierarchical cluster-ing analysis was performed uscluster-ing the Multiexperiment Viewer tool (MeV 4_8) with the average linkage method, gene leaf order optimization and Pearson correlations. Model for the co-expression analysis
Co-expression analysis was carried out on differen-tially expressed transcripts and lncRNAs using the R package coseq [108] ( https://bioconductor.org/pack-ages/devel/bioc/vignettes/coseq/inst/doc/coseq.html). We ran two clustering methods (K-means algorithm and Gaussian mixture models) for two different count data transformation functions (the centred log ratio (CLR) and logCLR for K-means; Logit and arcsin for Gaussian mixture models). Ten technical replicates were performed for each combination of method/ transformation to prevent initialization problems. We computed 30 models from K = 10 to K = 40 (K = num-ber of clusters). For each method, the best K was se-lected via the slope heuristics approach for K-means methods or via the Integrated Completed Likelihood (ICL) criterion for Gaussian mixture models. The transformation function, which minimizes the within clusters variability (for K-means algorithm) or the ICL
criterion (for Gaussian mixture models) was retained. Since the K-means algorithm seemed more sensitive to extreme expression data, we finally retained the Gaussian mixture model method with the arcsin transformation function and K = 24. This method pro-vided a more homogeneous number of transcripts per cluster.
For each cluster, a Singular Enrichment Analysis (SEA) of GO terms (AgriGO v2.0) [109] was performed (Fisher test with a FDR cut-off at 0.01 and a minimum number of mapping entries of 10), using a customized reference corresponding to expressed genes during the time course experiment. An heatmap comparing the results of individual cluster’s SEA were obtained using the SEA-COMPARE program (AgriGO v2.0).
Bioinformatics analysis
We extracted 413 genes (FLGs) from FLOR-ID [16], com-prising the 306 core flowering time genes, genes involved in flower meristem identity and flower development (FMI-FD) and pending annotated flowering time genes. For the analysis of the TFs we used the PlantTFDB 4.0 (http://planttfdb.cbi.pku.edu.cn/). Chromatin-associated genes were described in [38]. Hierarchical clustering was performed using the Multiple Experiment Viewer tool (MeV) with the Pearson correlation metric and average linkage clustering as linkage method [110]. We performed functional annotation and classification using the “AgriGO” Gene Ontology tool [109] and the Classifica-tion SuperViewer Tool from BAR [111]. For each cluster, we extracted the biological process (BP) GO terms with the best FDR and the best specialized and enriched“child” GO terms (Additional file23). Venn diagrams were gener-ated using the online tool provided by T. Hulsen (http:// bioinformatics.psb.ugent.be/webtools/Venn/).
Motif detection
The “Preferentially Located Motifs” algorithm is based on the over-representation of a motif around the Tran-scription Start Site (TSS), region − 300 from TSS to 5’UTR, compared to its distribution in the region of − 1000 to− 300 (learning region) before the TSS [46]. We also explored a list of 419 motifs merged from PLACE [112] and AGRIS (http://agris-knowledgebase.org/ AtcisDB/bindingsites.html) to find enrichment (p-value < 0.05) around the TSS compared to all Arabidopsis gen-ome (Additional file23).
Accession number
The accession number into the international GEO re-pository is GSE116123.
Additional files
Additional file 1:Figure S1. Characterization of the SD-LD switch. (a) Flowering time according to the number of weeks in SD. Rosette and cauline leaves were recorded on plants when the first flowers appeared. The bolting time was quantified when the stem was 0.5 cm high from sowing. Three biological replicates were performed with 12 plants, each. (b) Expression of the AP1::GUS reporter gene in the apical shoots of plants grown 4 weeks in SD, and then transferred to LD. Day after transfer (dat). (PDF 772 kb)
Additional file 2:Figure S2. Growth of rosette leaves in response to SD or a SD-LD switch. (a) Measurements of the total rosette leaf areas. (b) Area measurement of the first six leaves. Col-0 plants were grown in SD for 4 weeks, then kept in SD (continuous line) or transferred in LD (dash line). Two biological replicates were performed with 10 plants, each. Ex-perimental values are mean ± SEM. (PDF 70 kb)
Additional file 3:Figure S3. RNA-Seq experiments and expressed gene distributions. (a) Library sizes of the biological replicates. (b) Read mapping for the different time points and biological replicates. (c) Distribution of the expressed genes in the genomes. (d) Differentially expressed genes (DEGs) and Venn diagram with the three main comparisons. (e) Distribution of the expressed genes in the main gene classes. (PDF 194 kb)
Additional file 4:Figure S4. Analysis of lncRNAs. (a) Resources used to construct the lncTU dataset. (b) lncTUs differentially expressed for each comparison using the Benjamini-Hochberg (BH) test. (PDF 51 kb)
Additional file 5:List of lncTUs. (XLSX 639 kb)
Additional file 6:List of genes per cluster. (XLSX 187 kb)
Additional file 7:Best enriched biological process (BP) GO terms for the 24 clusters. The best BP GO term was extracted with its FDR from each SEA analysis. (XLSX 11 kb)
Additional file 8:Figure S5. Differentially expressed endoreduplication-related genes extracted from the ThaleMine database. Log2 (Fold-Change) is reported. In black, non-statistically significant fold change values. (PDF 44 kb)
Additional file 9:Distributions of differentially expressed genes of the FLOR-ID database in the clusters. (XLSX 28 kb)
Additional file 10:Hormone-related genes supported by genetic evidence in clusters. (XLSX 22 kb)
Additional file 11:Figure S6. Floral transition and hormone pathways. (a) Distribution of AHD genes in clusters. (b) Genes associated with gibberellin metabolism and responses. (PDF 56 kb)
Additional file 12:Hormone-related genes involved in several hormonal pathways in the clusters. (XLSX 10 kb)
Additional file 13:Motifs identified with the PLM algorithm. (XLSX 87 kb)
Additional file 14:Distribution of the TFs among the clusters. (XLSX 38 kb)
Additional file 15:TFs from the FLOR-ID. (XLSX 12 kb)
Additional file 16:Figure S7. Screenshots of the TF2network user interface using the 64 TFs differentially regulated and belonging to FLOR-ID. The three Cytoscape panels show the gene regulatory networks with the first 5 best-ranked regulators (blue diamonds). Green diamonds repre-sent TFs and green circles, non-TF genes, according to the TF2Network interface annotations. The dashed arrows indicated PWM motifs for the corresponding regulators. The blue lines indicate protein-protein interac-tions. (PDF 524 kb)
Additional file 17:Differentially expressed genes associated with chromatin biology. (XLSX 19 kb)
Additional file 18:Distribution of differentially expressed genes associated with chromatin biology. CR: chromatin remodeling. (XLSX 9 kb)
Additional file 20:Figure S8. Expression of MAF5 and its antisense lncTU located in the 3′ end of MAF5 region at T0, T2 and T3. (a) Fold changes. (b) Browser snapshot showing the expression profiles. BR1: biological replicate number 1. (PDF 77 kb)
Additional file 21:Distribution of the TFBFs in the regions of the lncTUs. (XLSX 21 kb)
Additional file 22:List of oligonucleotides. (XLSX 8 kb)
Additional file 23:Information in PLACE and AGRIS databases on the identified motifs. (XLSX 38 kb)
Abbreviations
DEG:Differentially expressed gene; FT: Transcription factor; GO: Gene ontology; LD: Long days; lnc: Long non-coding; SD: Short days; TU: Transcription unit; ZT: Zeitgeber
Acknowledgements
We thank Bruno Letarnec and Hervé Ferry for plant care in the greenhouses. We thank Prof. Dr. Gerco Angenent and Dr. Suraj Jamge for the seeds of the API::GUS transgenic line (unpublished material) in the frame of the ITN Project EpiTRAITS. We are very grateful to Dr. Ortrun Mittelsten Scheid and the VBCF platform for preliminary sequencing tests. We thank Johanne Thevenin and the plant cytology and imaging platform (PCIV)” of the IJPB Plant Observatory for the technical support on flow cytometry. We are very grateful to Dr. Jeffrey Leung for careful reading and comments. We are very grateful to and thank Prof. Dr. Ronald E. Koes (Amsterdam University) for providing SDP a PhD short-term fellowship from the University of Amsterdam. The funding of SDP is gratefully acknowledged.
Funding
SDP was supported by a PhD fellowship provided by the European Commission Seventh Framework-People-2012-ITN Project EpiTRAITS (no-316965), a short-term INRA grant and by a PhD short-term fellowship from the Swammerdam Institute for Life Sciences of the University of Amsterdam. The sequencing platform (POPS-IPS2) and the IJPB benefit from the support of the LabEx Saclay Plant Sciences-SPS (ANR-10-LABX-0040-SPS). The funding agencies played no role in the design of the study and collection, analysis, and interpretation of data and in writing the manuscript.
Availability of data and materials
The datasets used and analyzed during the current study are available from the corresponding author on reasonable request.
Authors’ contributions
SDP performed experiments and analyses. LST performed libraries and sequencing. AM, DC, NB, CG, VB, and FG performed bioinformatics analyses. VG analyzed data and coordinated the analyses. SDP, PF and VG wrote the manuscript. All authors read and approved the final manuscript.
Ethics approval and consent to participate
The experimental research on plants performed in this study complies with institutional, national and international guidelines.
Consent for publication Not applicable.
Competing interests
The authors declare that they have no competing interests.
Publisher’s Note
Springer Nature remains neutral with regard to jurisdictional claims in published maps and institutional affiliations.
Author details
1Institut Jean-Pierre Bourgin, INRA, AgroParisTech, CNRS, Université
Paris-Saclay, INRA Centre de Versailles-Grignon, Bât. 2, RD10 Route de Saint-Cyr, 78000 Versailles, France.2Institute of Plant Sciences Paris-Saclay (IPS2), CNRS, INRA, Université Paris-Sud, Université Evry, Université Paris-Saclay, Bâtiment 630, Plateau du Moulon, 91192 Gif-sur-Yvette, France.
3Institute of Plant Sciences Paris-Saclay (IPS2), CNRS, INRA, Université Paris
Diderot, Sorbonne Paris-Cité, Bâtiment 630, Plateau du Moulon, 91192 Gif-sur-Yvette, 91405 Orsay, France.4Swammerdam Institute for Life Sciences,
University of Amsterdam, 1098XH Amsterdam, The Netherlands.
Received: 4 October 2018 Accepted: 24 March 2019
References
1. Hepworth J, Dean C. Flowering Locus C's lessons: conserved chromatin switches underpinning developmental timing and adaptation. Plant Physiol. 2015;168(4):1237–45.
2. Pajoro A, Biewers S, Dougali E, Leal Valentim F, Mendes MA, Porri A, Coupland G, Van de Peer Y, van Dijk AD, Colombo L, et al. The (r)evolution of gene regulatory networks controlling Arabidopsis plant reproduction: a two-decade history. J Exp Bot. 2014;65(17):4731–45.
3. Putterill J, Robson F, Lee K, Simon R, Coupland G. The CONSTANS gene of Arabidopsis promotes flowering and encodes a protein showing similarities to zinc finger transcription factors. Cell. 1995;80:847–57.
4. Bernier G, Perilleux C. A physiological overview of the genetics of flowering time control. Plant Biotechnol J. 2005;3(1):3–16.
5. Song YH, Shim JS, Kinmonth-Schultz HA, Imaizumi T. Photoperiodic flowering: time measurement mechanisms in leaves. Annu Rev Plant Biol. 2015;66:441–64.
6. Corbesier L, Vincent C, Jang S, Fornara F, Fan Q, Searle I, Giakountis A, Farrona S, Gissot L, Turnbull C, et al. FT protein movement contributes to long-distance signaling in floral induction of Arabidopsis. Science. 2007; 316(5827):1030–3.
7. Corbesier L, Gadisseur I, Silvestre G, Jacqmard A, Bernier G. Design in Arabidopsis thaliana of a synchronous system of floral induction by one long day. Plant J. 1996;9(6):947–52.
8. McClung CR, Lou P, Hermand V, Kim JA. The importance of ambient temperature to growth and the induction of flowering. Frontiers Plant Sci. 2016;7:1266.
9. Bratzel F, Turck F. Molecular memories in the regulation of seasonal flowering: from competence to cessation. Genome Biol. 2015;16:192. 10. Conti L. Hormonal control of the floral transition: can one catch them all?
Dev Biol. 2017;430(2):288–301.
11. Mahrez W, Shin J, Munoz-Viana R, Figueiredo DD, Trejo-Arellano MS, Exner V, Siretskiy A, Gruissem W, Kohler C, Hennig L. BRR2a affects flowering time via FLC splicing. PLoS Genet. 2016;12(4):e1005924.
12. Kwak JS, Son GH, Song JT, Seo HS. Post-translational modifications of FLOWERING LOCUS C modulate its activity. J Exp Bot. 2017;68(3):383–9. 13. Whittaker C, Dean C. The FLC Locus: a platform for discoveries in
epigenetics and adaptation. Annu Rev Cell Dev Biol. 2017;33:555–75. 14. Duan HC, Wei LH, Zhang C, Wang Y, Chen L, Lu Z, Chen PR, He C, Jia G.
ALKBH10B is an RNA N(6)-Methyladenosine demethylase affecting Arabidopsis floral transition. Plant Cell. 2017;29(12):2995–3011. 15. Berry S, Dean C. Environmental perception and epigenetic memory:
mechanistic insight through FLC. Plant J. 2015;83(1):133–48.
16. Bouche F, Lobet G, Tocquin P, Perilleux C. FLOR-ID: an interactive database of flowering-time gene networks in Arabidopsis thaliana. Nucleic Acids Res. 2016;44(D1):D1167–71.
17. Yamada M. Functions of long intergenic non-coding (linc) RNAs in plants. J Plant Res. 2017;130(1):67–73.
18. Krzyczmonik K, Wroblewska-Swiniarska A, Swiezewski S. Developmental transitions in Arabidopsis are regulated by antisense RNAs resulting from bidirectionally transcribed genes. RNA Biol. 2017;14(7):838–42.
19. Kim DH, Xi Y, Sung S. Modular function of long noncoding RNA, COLDAIR, in the vernalization response. PLoS Genet. 2017;13(7):e1006939. 20. Heo JB, Sung S. Vernalization-mediated epigenetic silencing by a long
intronic noncoding RNA. Science. 2011;331(6013):76–9.
21. Swiezewski S, Liu F, Magusin A, Dean C. Cold-induced silencing by long antisense transcripts of an Arabidopsis Polycomb target. Nature. 2009; 462(7274):799–802.
22. Liu F, Marquardt S, Lister C, Swiezewski S, Dean C. Targeted 3′ processing of antisense transcripts triggers Arabidopsis FLC chromatin silencing. Science. 2010;327(5961):94–7.
23. Shin JH, Chekanova JA. Arabidopsis RRP6L1 and RRP6L2 function in FLOWERING LOCUS C silencing via regulation of antisense RNA synthesis. PLoS Genet. 2014;10(9):e1004612.
24. Henriques R, Wang H, Liu J, Boix M, Huang LF, Chua NH. The antiphasic regulatory module comprising CDF5 and its antisense RNA FLORE links the circadian clock to photoperiodic flowering. New Phytol. 2017;216(3):854–67.
25. Wang KC, Chang HY. Molecular mechanisms of long noncoding RNAs. Mol Cell. 2011;43(6):904–14.
26. Di C, Yuan J, Wu Y, Li J, Lin H, Hu L, Zhang T, Qi Y, Gerstein MB, Guo Y, et al. Characterization of stress-responsive lncRNAs in Arabidopsis thaliana by integrating expression, epigenetic and structural features. The Plant J. 2014; 80(5):848–61.
27. Yuan C, Wang J, Harrison AP, Meng X, Chen D, Chen M. Genome-wide view of natural antisense transcripts in Arabidopsis thaliana. DNA Res. 2015;22(3): 233–43.
28. Bouche F, D'Aloia M, Tocquin P, Lobet G, Detry N, Perilleux C. Integrating roots into a whole plant network of flowering time genes in Arabidopsis thaliana. Sci Rep. 2016;6:29042.
29. Klepikova AV, Logacheva MD, Dmitriev SE, Penin AA. RNA-seq analysis of an apical meristem time series reveals a critical point in Arabidopsis thaliana flower initiation. BMC Genomics. 2015;16:466.
30. Torti S, Fornara F, Vincent C, Andres F, Nordstrom K, Gobel U, Knoll D, Schoof H, Coupland G. Analysis of the Arabidopsis shoot meristem transcriptome during floral transition identifies distinct regulatory patterns and a leucine-rich repeat protein that promotes flowering. Plant Cell. 2012; 24(2):444–62.
31. Schmid M, Uhlenhaut NH, Godard F, Demar M, Bressan R, Weigel D, Lohmann JU. Dissection of floral induction pathways using global expression analysis. Development. 2003;130(24):6001–12.
32. You Y, Sawikowska A, Neumann M, Pose D, Capovilla G, Langenecker T, Neher RA, Krajewski P, Schmid M. Temporal dynamics of gene expression and histone marks at the Arabidopsis shoot meristem during flowering. Nat Commun. 2017;8:15120.
33. Samach A, Onouchi H, Gold SE, Ditta GS, Schwarz-Sommer Z, Yanofsky MF, Coupland G. Distinct roles of CONSTANS target genes in reproductive development of Arabidopsis. Science. 2000;288(5471):1613–6.
34. Wigge PA, Kim MC, Jaeger KE, Busch W, Schmid M, Lohmann JU, Weigel D. Integration of spatial and temporal information during floral induction in Arabidopsis. Science. 2005;309(5737):1056–9.
35. Michaels SD, Himelblau E, Kim SY, Schomburg FM, Amasino RM. Integration of flowering signals in winter-annual Arabidopsis. Plant Physiol. 2005;137(1): 149–56.
36. Yamaguchi A, Kobayashi Y, Goto K, Abe M, Araki T. TWIN SISTER OF FT (TSF) acts as a floral pathway integrator redundantly with FT. Plant Cell Physiol. 2005;46(8):1175–89.
37. Somssich M, Khan GA, Persson S. Cell Wall heterogeneity in root development of Arabidopsis. Front Plant Sci. 2016;7:1242. 38. Chupeau MC, Granier F, Pichon O, Renou JP, Gaudin V, Chupeau Y.
Characterization of the early events leading to totipotency in an Arabidopsis protoplast liquid culture by temporal transcript profiling. Plant Cell. 2013;25(7):2444–63.
39. Kalve S, De Vos D, Beemster GT. Leaf development: a cellular perspective. Front Plant Sci. 2014;5:362.
40. Dewitte W, Riou-Khamlichi C, Scofield S, Healy JM, Jacqmard A, Kilby NJ, Murray JA. Altered cell cycle distribution, hyperplasia, and inhibited differentiation in Arabidopsis caused by the D-type cyclin CYCD3. Plant Cell. 2003;15(1):79–92.
41. Imai KK, Ohashi Y, Tsuge T, Yoshizumi T, Matsui M, Oka A, Aoyama T. The A-type cyclin CYCA2;3 is a key regulator of ploidy levels in Arabidopsis endoreduplication. Plant Cell. 2006;18(2):382–96.
42. Jiang Z, Liu X, Peng Z, Wan Y, Ji Y, He W, Wan W, Luo J, Guo H. AHD2.0: an update version of Arabidopsis hormone database for plant systematic studies. Nucleic Acids Res. 2011;39(Database issue):D1123–9. 43. Shu K, Chen Q, Wu Y, Liu R, Zhang H, Wang S, Tang S, Yang W, Xie Q.
ABSCISIC ACID-INSENSITIVE 4 negatively regulates flowering through directly promoting Arabidopsis FLOWERING LOCUS C transcription. J Exp Bot. 2016;67(1):195–205.
44. Zhang J, Vankova R, Malbeck J, Dobrev PI, Xu Y, Chong K, Neff MM. AtSOFL1 and AtSOFL2 act redundantly as positive modulators of the endogenous content of specific cytokinins in Arabidopsis. PLoS One. 2009; 4(12):e8236.
45. Argyros RD, Mathews DE, Chiang YH, Palmer CM, Thibault DM, Etheridge N, Argyros DA, Mason MG, Kieber JJ, Schaller GE. Type B response regulators of
Arabidopsis play key roles in cytokinin signaling and plant development. Plant Cell. 2008;20(8):2102–16.
46. Bernard V, Brunaud V, Lecharny A. TC-motifs at the TATA-box expected position in plant genes: a novel class of motifs involved in the transcription regulation. BMC Genomics. 2010;11:166.
47. Gupta S, Stamatoyannopoulos JA, Bailey TL, Noble WS. Quantifying similarity between motifs. Genome Biol. 2007;8(2):R24.
48. Franco-Zorrilla JM, Lopez-Vidriero I, Carrasco JL, Godoy M, Vera P, Solano R. DNA-binding specificities of plant transcription factors and their potential to define target genes. Proc Natl Acad Sci U S A. 2014;111(6):2367–72. 49. O'Malley RC, Huang SC, Song L, Lewsey MG, Bartlett A, Nery JR, Galli M,
Gallavotti A, Ecker JR. Cistrome and Epicistrome features shape the regulatory DNA landscape. Cell. 2016;165(5):1280–92.
50. Michael TP, McClung CR. Phase-specific circadian clock regulatory elements in Arabidopsis. Plant Physiol. 2002;130(2):627–38.
51. Wang H, Li Y, Pan J, Lou D, Hu Y, Yu D. The bHLH transcription factors MYC2, MYC3, and MYC4 are required for Jasmonate-mediated inhibition of flowering in Arabidopsis. Mol Plant. 2017;10(11):1461–4.
52. Molitor A, Latrasse D, Zytnicki M, Andrey P, Houba-Herin N, Hachet M, Battail C, Del Prete S, Alberti A, Quesneville H, et al. The Arabidopsis hnRNP-Q protein LIF2 and the PRC1 subunit LHP1 function in concert to regulate the transcription of stress-responsive genes. Plant Cell. 2016;28:2197–211. 53. Gaudin V, Libault M, Pouteau S, Juul T, Zhao G, Lefebvre D, Grandjean O.
Mutations in LIKE HETEROCHROMATIN PROTEIN 1 affect flowering time and plant architecture in Arabidopsis. Devevlopment. 2001;128:4847–58. 54. Zhang X, Germann S, Blus BJ, Khorasanizadeh S, Gaudin V, Jacobsen SE. The
Arabidopsis LHP1 protein colocalizes with histone H3 Lys27 trimethylation. Nat Struct Mol Biol. 2007;14(9):869–71.
55. Zhang B, Wang L, Zeng L, Zhang C, Ma H. Arabidopsis TOE proteins convey a photoperiodic signal to antagonize CONSTANS and regulate flowering time. Genes Dev. 2015;29(9):975–87.
56. Jin J, Tian F, Yang DC, Meng YQ, Kong L, Luo J, Gao G. PlantTFDB 4.0: toward a central hub for transcription factors and regulatory interactions in plants. Nucleic Acids Res. 2017;45(D1):D1040–5.
57. Gangappa SN, Botto JF. The BBX family of plant transcription factors. Trends Plant Sci. 2014;19(7):460–70.
58. Khanna R, Kronmiller B, Maszle DR, Coupland G, Holm M, Mizuno T, Wu SH. The Arabidopsis B-box zinc finger family. Plant Cell. 2009;21(11):3416–20. 59. Cheng XF, Wang ZY. Overexpression of COL9, a CONSTANS-LIKE gene,
delays flowering by reducing expression of CO and FT in Arabidopsis thaliana. Plant J. 2005;43(5):758–68.
60. Hassidim M, Harir Y, Yakir E, Kron I, Green RM. Over-expression of CONSTANS-LIKE 5 can induce flowering in short-day grown Arabidopsis. Planta. 2009;230(3):481–91.
61. Zhao H, Wu D, Kong F, Lin K, Zhang H, Li G. The Arabidopsis thaliana nuclear factor Y transcription factors. Front Plant Sci. 2016;7:2045. 62. Swain S, Myers ZA, Siriwardana CL, Holt BF 3rd. The multifaceted roles of
NUCLEAR FACTOR-Y in Arabidopsis thaliana development and stress responses. Biochim Biophys Acta. 2017;1860(5):636–44.
63. Kumimoto RW, Zhang Y, Siefers N, Holt BF 3rd. NF-YC3, NF-YC4 and NF-YC9 are required for CONSTANS-mediated, photoperiod-dependent flowering in Arabidopsis thaliana. Plant J. 2010;63(3):379–91.
64. Kumimoto RW, Adam L, Hymus GJ, Repetti PP, Reuber TL, Marion CM, Hempel FD, Ratcliffe OJ. The nuclear factor Y subunits NF-YB2 and NF-YB3 play additive roles in the promotion of flowering by inductive long-day photoperiods in Arabidopsis. Planta. 2008;228(5):709–23.
65. Foyer CH, Karpinska B, Krupinska K. The functions of WHIRLY1 and REDOX-RESPONSIVE TRANSCRIPTION FACTOR 1 in cross tolerance responses in plants: a hypothesis. Philos Trans R Soc Lond B Biol Sci. 2014;369(1640): 20130226.
66. Cai Q, Guo L, Shen ZR, Wang DY, Zhang Q, Sodmergen. Elevation of pollen mitochondrial DNA copy number by WHIRLY2: altered respiration and pollen tube growth in Arabidopsis. Plant Physiol. 2015;169(1):660–73. 67. Kulkarni SR, Vaneechoutte D, Van de Velde J, Vandepoele K. TF2Network:
predicting transcription factor regulators and gene regulatory networks in Arabidopsis using publicly available binding site information. Nucleic Acids Res. 2018;46(6):e31.
68. Sequeira-Mendes J, Araguez I, Peiro R, Mendez-Giraldez R, Zhang X, Jacobsen SE, Bastolla U, Gutierrez C. The functional topography of the Arabidopsis genome is organized in a reduced number of linear motifs of chromatin states. Plant Cell. 2014;26(6):2351–66.