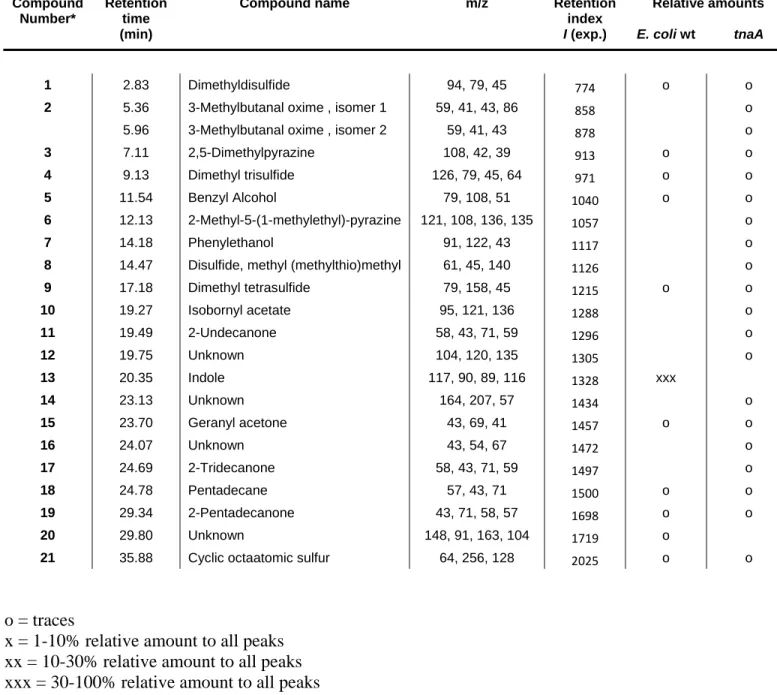
Table S1: List of volatile organic compounds emitted by E. coli JM105 and corresponding tnaA mutant grown on solid agar Luria-Bertani medium.
Compound Number*
Retention time
Compound name m/z Retention
index
Relative amounts
(min) I (exp.) E. coli wt tnaA
1 2.83 Dimethyldisulfide 94, 79, 45 774 o o
2 5.36 3-Methylbutanal oxime , isomer 1 59, 41, 43, 86 858 o 5.96 3-Methylbutanal oxime , isomer 2 59, 41, 43 878 o
3 7.11 2,5-Dimethylpyrazine 108, 42, 39 913 o o
4 9.13 Dimethyl trisulfide 126, 79, 45, 64 971 o o
5 11.54 Benzyl Alcohol 79, 108, 51 1040 o o
6 12.13 2-Methyl-5-(1-methylethyl)-pyrazine 121, 108, 136, 135 1057 o
7 14.18 Phenylethanol 91, 122, 43 1117 o
8 14.47 Disulfide, methyl (methylthio)methyl 61, 45, 140 1126 o
9 17.18 Dimethyl tetrasulfide 79, 158, 45 1215 o o 10 19.27 Isobornyl acetate 95, 121, 136 1288 o 11 19.49 2-Undecanone 58, 43, 71, 59 1296 o 12 19.75 Unknown 104, 120, 135 1305 o 13 20.35 Indole 117, 90, 89, 116 1328 xxx 14 23.13 Unknown 164, 207, 57 1434 o 15 23.70 Geranyl acetone 43, 69, 41 1457 o o 16 24.07 Unknown 43, 54, 67 1472 o 17 24.69 2-Tridecanone 58, 43, 71, 59 1497 o 18 24.78 Pentadecane 57, 43, 71 1500 o o 19 29.34 2-Pentadecanone 43, 71, 58, 57 1698 o o 20 29.80 Unknown 148, 91, 163, 104 1719 o
21 35.88 Cyclic octaatomic sulfur 64, 256, 128 2025 o o
o = traces
x = 1-10% relative amount to all peaks xx = 10-30% relative amount to all peaks xxx = 30-100% relative amount to all peaks *Compound numbering refers to Fig. 1b.
Figure S1: Bacterial VOCs remotely affect root growth and development. A. thaliana seeds
were co-cultured for 21 days after germination with physically separated wild-type E. coli, Burkholderia or Pseudomonas species. Top, emerged lateral root numbers and primary root lengths were monitored after 14 days and shoots were excised after 21 days for biomass determination. Results shown are representative of biological duplicates and are expressed as mean ± s.e.m. Asterisks indicate statistical significance according to one-way ANOVA followed by Dunnet’s post-hoc test (n = 45, p < 0.001). Bottom, representative pictures of 14 dag growth. (n.s., p > 0.05; *, p ≤ 0.05; **, p ≤ 0.01; ***, p ≤ 0.001)
Figure S2: Effects of indole on the primary root tip extension of excised seedlings. Seedlings
were handled as described in Fig. 2c. Root tip extension was measured 10 days after excision. Results shown are representative of biological duplicates and are expressed as mean ± s.e.m. Letters indicate different statistical significance according to one-way ANOVA followed by Tukey’s post-hoc test (n = 24, p < 0.001).
Figure S3: Volatile indole moves in planta and accumulates in sites of auxin action. (a)
Agarose beads containing [14C]-indole were applied to either the middle of the root or root-shoot-junction of 15-day-old seedlings and autoradiograms presented here were obtained after 24 h of treatment. Arrows indicate the position of the applied radioactive source. Asterisks emphasize remarkable accumulations of the radioactive signal. Bar = 10 mm. (b) Seedlings were handled as described in (a), except that the agarose bead containing 50 nM [14C]-indole was placed in the middle of the compartment defined by the stainless steel ring. Here are shown representative samples at 5 (left) and 12 (right) days after germination. Asterisks emphasize remarkable accumulations of the radioactive signal. Bar = 10 mm.
Figure S4: indole alters responses to synthetic auxins (a) Adventitious roots number
appearing after photostimulation and further growth in light. Percentages above columns represent the proportions of seedlings developing at least one adventitious root on their hypocotyl. Results shown are representative of biological duplicates and are expressed as mean ± s.e.m. Asterisks indicate statistical significance according to Student’s t test (n = 24, p < 0.01). (b) 5 dag seedlings were vertically transferred to fresh plates containing the indicated treatments
and lateral root numbers were counted 8 dat. Results shown are representative of biological duplicates and are expressed as mean ± s.e.m. Asterisks indicate statistical significance when compared to control or hormone treatment alone, according to Student’s t test (n = 20, p < 0.01). (c) Representative micrographs of 2,4-D treatments in (c). Bar = 500 µm. (d) Root tip elongation under the indicated treatments was measured as in Fig. 5c. Results shown are representative of biological triplicates and are expressed as mean ± s.e.m. Asterisks indicate statistical significance according to Student’s t test (n = 12, p < 0.01). (e) Top row, representative fluorescence micrographs of DR5::GFP activity under indicated treatments. 5 dag control-germinated seedlings were vertically transferred to fresh treatment plates and let grow another 5 days. Middle row, representative confocal LASER scanning micrographs of root meristems under indicated treatments. Bottom row, representative micrographs of the root tip morphological changes after treatments under indicated treatments. Arrowheads represent the position of the root tip at the time of transfer. Bars = 200 µm. (n.s., p > 0.05; *, p ≤ 0.05; **, p ≤ 0.01; ***, p ≤ 0.001)
Figure S5: Indole treatment increases DR5::GFP signal intensity in the root tip and at the root-shoot junction but does not alter tissue distribution. (a) Representative micrographs of
the root tip DR5::GFP signal of 5-day-old seedlings germinated in control or indole conditions and transferred for 16 h onto fresh growth medium supplemented with the indicated treatments. Numbers above pictures represent the DR5::GFP signal mean grey values and integrated densities (in brackets) and are expressed as percentages of control treatment values. Results shown are representative of biological duplicates and are expressed as mean ± s.d. (n = 15). Bar = 100 µm. (b) Representative micrographs of the root-shoot-junction DR5::GFP signal of 5-day-old seedlings germinated in control or indole conditions and transferred for 16 h onto fresh growth medium supplemented with the indicated treatments. Bar = 200 µm.
Figure S6: Continuous indole treatments trigger apical DR5::GUS signal patterns similar to E. coli wt VOCs in primary root tips. (a) Quantification of the root tip DR5::GUS signal of
5-day-old seedlings germinated in control, indole or IAA conditions. Results are expressed as means (n = 15) (b) Representative micrographs of (a). Bar = 100 µm. (c) Representative micrographs of GUS histochemical staining of primary root tips of seedlings grown for 15 days in the continuous presence or absence of wild-type E. coli and tnaA mutant VOCs (n = 20). Bar
= 200 µm. (d) Enzymatic quantification of DR5 expression in VOCs-treated seedlings. DR5::GUS seedlings were handled as in (c) and 5 mm sections from the root tip of 15 plants were pooled per sample. Results shown are the means ± s.e.m of biological triplicates (n = 9). Asterisks indicate statistical significance according to one-way ANOVA followed by Dunnet’s post-hoc test (n = 3, p < 0.01). (n.s., p > 0.05; ***, p ≤ 0.001)
Figure S7: Indole can slowly be converted to tryptophan and free IAA. (a), quantification of
free IAA contents in seedlings subjected to 24 h 10 µM indole treatments. No statistical difference was detected compared to control treatments according to Student’s t-test (n=4, p < 0.001). (b) Left, free endogenous and 13C-labelled IAA quantification in seedlings treated with increasing amounts of [13C]-indole for 24 h. Right, relative abundance of endogenous and 13 C-labelled tryptophan in corresponding samples. Results shown are expressed as mean ± s.e.m (n = 4, p < 0.001).
Figure S8: Indole but not tryptophan releases the primary root tip growth inhibition induced by 50 nM IAA. 5-day-old control-germinated seedlings were handled as in Fig. 5c.
Results shown are representative of biological duplicates and are expressed as mean ± s.e.m (n = 30-100).
Figure S9: Indole-auxin co-application prevents auxin-induced AXR3/IAA17 degradation.
HS::AXR3-GUS reporter lines were handled as described in the text. Results shown are representative of biological duplicates and are expressed as mean ± s.e.m. Asterisks indicate statistical significance according to Student’s t test when compared to control treatmnes (n = 4, p < 0.01). (n.s., p > 0.05; *, p ≤ 0.05; **, p ≤ 0.01).
Figure S10: the auxin transport mutants abcb19 and abcb1x19 respond similarly to E. coli VOCs and indole treatments. Mutant and wt seedlings were handled as in Fig. 1a. Results
shown are representative of biological duplicates and are expressed as mean ± s.e.m. Each treatment result was found significantly different to control treatment in their respective background according to Student’s t test (n = 30-45, p < 0.001).