HAL Id: insu-03039716
https://hal-insu.archives-ouvertes.fr/insu-03039716
Submitted on 4 Dec 2020
HAL is a multi-disciplinary open access
archive for the deposit and dissemination of
sci-entific research documents, whether they are
pub-lished or not. The documents may come from
teaching and research institutions in France or
abroad, or from public or private research centers.
L’archive ouverte pluridisciplinaire HAL, est
destinée au dépôt et à la diffusion de documents
scientifiques de niveau recherche, publiés ou non,
émanant des établissements d’enseignement et de
recherche français ou étrangers, des laboratoires
publics ou privés.
Propagation analysis of plasmaspheric hiss using Polar
PWI measurements
O. Santolík, Michel Parrot, L. Storey, J. Pickett, D. Gurnett
To cite this version:
O. Santolík, Michel Parrot, L. Storey, J. Pickett, D. Gurnett. Propagation analysis of plasmaspheric
hiss using Polar PWI measurements. Geophysical Research Letters, American Geophysical Union,
2001, 28 (6), pp.1127-1130. �10.1029/2000GL012239�. �insu-03039716�
GEOPHYSICAL RESEARCH LETTERS, VOL. 28, NO. 6, PAGES 1127-1130, MARCH 15, 2001
Propagation analysis
of plasmaspheric
hiss using Polar PWI
measurements
O. Santol•,
1'• M. Parrot,
1 L. R. O. Storey?
J. $. Pickett,
4 and
D. A. Gurnett
4
Abstract. We have analyzed high-rate waveform data, taken Storey et al. [1991] however observed hiss emissions even
by the POLAR Plasma
Wave Instrument
at high altitudes
in when, after long periods
of magnetic
calm, the plasmapause
the equatorial plasmasphere, to study plasmaspheric hiss in the was absent. They also found that the waves often propagate at range of frequencies between 100 Hz and several kHz. These large angles from B0, even in the equatorial region. This means
emissions
are found
almost
everywhere
in the plasmasphere,
these
waves
cannot
be generated
exactly
in the way Kennel
and their origin
is still controversial.
Our analysis
of several and Petschek
[1966] suggested.
These
results
do not directly
cases shows that most of the waves were propagating more or contradict the theory of Thorne et al. [ 1973, 1979], but they do less parallel to the Earth's magnetic field, but sometimes a few suggest that under certain circumstances some other mechanism of them were propagating obliquely with their normals near may be acting. Indeed, highly oblique wave propagation fits a
the Gendrin
angle. Evidence
of amplification
was found
near theory
developed
by Draganov
et al. [ 1992],
though
due
initially
the geomagnetic equator. The results suggest that waves with to H. C. Koons; see page 19,486 of Storey et al. [1991]. On this
normals
both parallel
and anti-parallel
to the magnetic
field view, hiss is simply
explained
by the accumulation
of many
were being amplified by the classical mechanism that involves whistlers trapped in the plasmasphere.
gyroresonant interaction with energetic electrons. The purpose of this letter is to present the initial results from an investigation of hiss, using multi-component wave measure-
ments by the High Frequency Waveform Receiver (HFWR) on
Introduction the Polar satellite [Gurnett et al., 1995]. The theory of Thorne et al. [1979] predicts that, near the equator, waves propagat-
Plasmaspheric
hiss
consists
of intense
electromagnetic
waves
ing
both
northwards
and
southwards,
more
or less
parallel
and
in the
frequency
range
between
100
Hz and
several
kHz.
Satel- anti-parallel
to B0 respectively,
should
be
present
together.
A
lite
observations
at altitudes
of several
Earth
radii
in the
plasma-
composite
wave
field
like
this
cannot
be
regarded,
even
approx-
sphere
revealed
that
these
natural
emissions
are
almost
always
imately,
as being
that
of a single
plane
wave.
Therefore
we
present
[Thorne
et al., 1973].
It is widely
thought
that
the
hiss have
studied
the
data
by means
of wave
distribution
function
waves
get
their
energy
from
gyroresonant
interaction
with
the (WDF)
analysis
[Storey
and
Lefeuvre,
1979],
which
is able
to
electrons
of the
inner
radiation
belt
near
the
plane
of the
mag- distinguish
between
waves
going
in different
directions.
netic equator [Kennel and Petschek, 1966]. This amplification process acts best for waves with their normals parallel to the am-
bient
magnetic
field
(B0). High
amplification
rates
have
been
Data analysis
reported on occasions [Solomon et al., 1988], but with the com-We use data acquired in the high-rate telemetry mode of
monly
observed
electron
distribution
functions
the
hiss
waves
the
Polar
HFWR
instrument,
with
a sampling
frequency
of
are
expected
to
be
amplified
by
only
a few
dB
on
crossing
the 71.4
kHz.
They
are
full
vector
measurements
of
both
the
electric
equatorial
plane.
Hence
Thorne
et
al. [1979]
suggested
that,
and
magnetic
wave
fields,
made
in snapshots
of
0.445
s sepa-
beginning
from
background
thermal
noise,
the
waves
reach
the rated
by
gaps
of
8.755
s [Gurnett
et
al.,
1995].
In
preparation
for
observed
intensities
by
crossing
the
amplification
region
many
the
analysis,
the
six
waveforms
in
each
snapshot
are
processed
times. This theory supposes that the waves travel on paths that
as follows:
firstly
they
are "de-spun"
by transforming
them
to a
bring
them
repeatedly
back
to
the
equator
with
their
normals
reference
frame
where
one
axis
is
the
satellite
spin
axis,
while
close
to
the
magnetic
field
direction.
Thorne
et
al. [ 1979]
and,
the
other
two
are
fixed
with
respect
to
the
Sun-Earth
line;
then
a
more recently, Abel and Thorne [1998] have shown that this can happen if, at some points along their paths, the hiss waves are reflected from the plasmapause.
1LPCE/CNRS, Orltans, France.
:t Charles University, Prague, Czech Republic.
a Quarfier Luch•ne, Cueuron, France.
4Department of Physics and Astronomy, University of Iowa, Iowa City.
Copyright 2001 by the American Geophysical Union.
Paper number 2000GL012239.
0094-8276/01/2000GL012239505.00
Fast
Fourier
Transform
(FFT) is done
on each
of them;
and
lastly
the transformed
data
are expressed
in physical
units,
taking
into
account the known transfer functions of the instrument.
The data are searched
for the presence
of intense
plasmas-
pheric hiss near the equator. we exclude all passes on which the electric antennas were oscillating, as they often did in the plasmasphere [Kolesnikova and Beghin, 2000]. Some interest-
ing passes
are
illustrated
in Figures
1 and
3. The quantity
shown
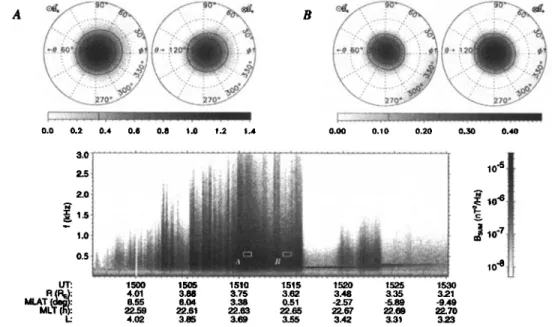
on a gray scale is the sum of the short-term power spectra of the three magnetic-field components. Our choices of the times and frequencies at which to make the WDF analyses are marked on the figures by the small white rectangles labelled A, B, etc.
1128 SANTOLIK ET AL.: PROPAGATION ANALYSIS OF PLASMASPHERIC HISS
The magnetic-field data from all three of the search coils, together with the electric-field data from only the two long antennas, are used in the analyses. The input data for each analysis come from the set of FFTs for the snapshots in the chosen time interval (typically 30-50 s); they are the components of the FFTs of these five electromagnetic-field components in a narrow band centered on the chosen frequency. The choice of bandwidth, typically 50-110 Hz, is a compromise between the needs for high resolution in frequency and for low statistical fluctuations; the integration period is limited to the 0.445 s duration of a snapshot. The five FFT data sets are then used to estimate the elements of the 5 x5 spectral matrix of the five
field
compor•ents,
and
these
25 estimates
are
the actual
input
data for the WDF analysis. In this final step, the unknown WDF is estimated by fitting a multi-parameter model to these data. The model portrays the shape of the WDF at the chosen frequency, versus the wave-normal direction. Our method of analysis, titled "Model of Discrete Regions", is described in Appendix 3 of Santoh7• and Parrot [2000].
Usually
a WDF is displayed
as a pair
of polar
diagrams,
one
for each hemisphere of possible wave-normal directions. We
use the reference frame with the z-axis parallel to Bo, while
the x-axis lies in the magnetic meridian plane and is directed away from the Earth. Some examples are given in Figures 1 and 3. In each pair, the diagram on the left concerns waves
propagating towards geographic North, the one on the fight
waves propagating towards geographic South. The polar angle
0 is the angle between the wave normal and Bo; the azimuthal . angle •b has its origin at the x-axis.
Results
Figure 1 shows a magnetic spectrogram of plasmaspheric hiss recorded in the evening sector during a southbound pass
through the equator on May 2, 1997. Notice that the hiss stops
suddenly when the satellite reaches the equator. The electron
density derived from the frequency of upper-hybrid emissions
(not shown) also drops abruptly at this time, even though the satellite is inside the plasmasphere and moving towards the Earth. The most probable cause is a fairly rare phenomenon known as a plasmaspheric density cavity, seen previously in the data from CRRES [Carpenter et al., 2000].
WDF analyses have been performed at the two points marked on the spectrogram. The results, on the top of Figure 1, show
that the wave energy is mainly concentrated near the center of
each polar diagram. This means that two sets of waves, with their normals more or less parallel to Bo in one set and anti- parallel in the other, are present simultaneously in both cases.
Such waves could be amplified by the electron gyroresonance
instability, as was suggested by Kennel and Petschek [ 1966]. If
this were the case, we would expect the waves coming out of an
amplifying region to be stronger than the waves going into it.
Whenever the satellite passed through such a region, we would
see a reversal in the predominant direction of flow of the wave
energy. This is exactly what we see when we compare these two WDFs: at the point A the north-going waves are slightly stronger than the south-going ones, while at B, south of A, the opposite is true (see Figure 2). Our results are consistent with an amplification of about 1.3 dB in a region centered 1.8 ø north
of the magnetic equator; the WDF estimates for other points
support this interpretation.
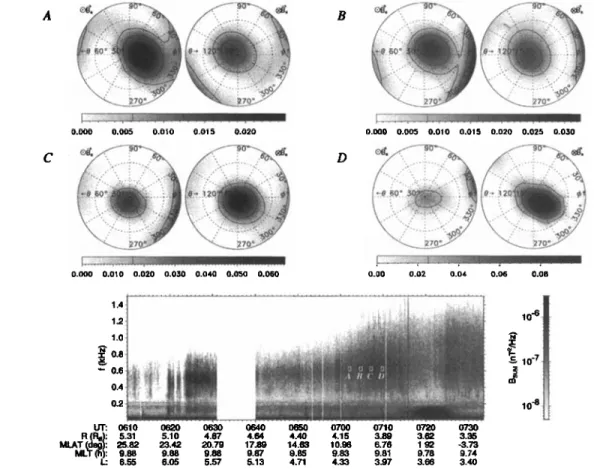
Another spectrogram of plasmaspheric hiss is shown in Figure
3. The data were recorded in the morning sector on November 24, 1996, and the equator was crossed at roughly L = 3.6. A strong emission of equatorial electromagnetic waves [Gurnett,
1976] was observed around 100 Hz, but our concern was with
the continuous hiss emission observed from 0623 UT (L = 5.8) until the end of the data record after 0733 UT (L = 3.3). The start
2.5 •: 1• 15• 1510 1515 1520 1•5 1•0 R RE: 4.01 3.• 3.75 3.62 3.• 3.• 3.21
M•T
(•:
8.55 6.•
3.•
0.51 -2.57 -5.89 -9.49
10 -510.6
.
10'7
i•.i
'
10-8 :--:Figure
1. Data
taken
on May 2, 1997.
(bottom)
Spectrogram
of the
magnetic
components
of the wave
field
in the band
0-3 kHz; the gray
scale
is on the right. Universal
time (UT), radial
geocentric
distance
(R) in
Earth
radii,
the magnetic
latitude
(MLAT) in degrees,
the magnetic
local
time (MLT) in hours,
and
Mcllwain's
parameter
(L) are below
the spectrogram.
(top) Estimated
WDFs for the time-frequency
intervals
marked
on
the spectrogram
by small
white
rectangles.
The gray
scale
below
each
pair
of plots
gives
the WDF values,
in
units of 10 -•$ J m-aHz-•sr -•.SANTOLIK ET AL.' PROPAGATION ANALYSIS OF PLASMASPHERIC HISS 1129 A -e. 1.0 .,.. 0.8 o 0.6 u. 0.4 ß 0.2 0 50 100 150 8 (degrees) B 0.50 ' 0.40 0.30 0.20 0.10 0 50 100 150 0 (degrees)
Figure 2. The values of the two WDFs of Figure 1 plotted as functions of 0 with the azimuth fixed at •b = 0 ø.
of the hiss activity corresponds to a rapid increase of the plasma density, and the widening of the frequency band after 0700 UT also accompanies a rising density (not shown). The condition of the plasmasphere is consistent with the relatively long quiet
period that preceded these observations: in the previous 24 hours the Kp index did not exceed 2-, and was about 1- on
the average. Figure 3 also shows a sequence of four WDFs, computed for the four points marked in the spectrogram. As before, we see a general tendency for the wave energy to be concentrated around the directions parallel and anti-parallel to the Earth's magnetic field, but in this case we also find some energy in directions much inclined to the field. These waves propagate close to the Gendrin angle [Gendrin, 1960], here about 85 ø , at an azimuth directed towards higher L-shells; they
appear at the same azimuth in nearly all of the WDFs that we
have estimated at other points in the time-frequency plane. They do not carry the major part of the wave energy, however. The main feature to notice in this figure is the clear-cut reversal
in the predominant direction of energy flow that we see on comparing the WDFs for points A and B with those for points C
and D. It is consistent with an amplification of about 3 dB in a
region centered roughly 8.5 ø north of the geomagnetic equator.
Similar results have been obtained from analyses over different
frequency ranges, both higher and lower than the ones shown.
Discussion
Our analysis shows that, in the equatorial plasmasphere, hiss waves often propagate simultaneously around at least two prin- cipal directions, parallel and anti-parallel to the Earth's magnetic field. This result indicates that the waves may be amplified by the electron gyroresonance instability, as suggested by Kennel and Petschek [1966] and by Thorne et al. [1973, 1979]. Some of their energy, however, is found at wave-normal directions highly inclined to the Earth's magnetic field, near the Gendrin angle; recall that at this angle the energy again propagates along the Earth's magnetic field [Gendrin, 1960]. These oblique waves are like those observed by Storey et al. [1991] in the ISEE- 1 data. In contrast, the present results show only a few of the waves propagating obliquely. This difference may be caused by the presence of the plasmapause in our cases, and by its absence in the cases that Storey et al. [1991] selected for this reason; Thorne et al. [1979] and Abel and Thorne [1998] have argued that reflection of the waves from the plasmapause is vital for the generation of hiss by the electron gyroresonance instability. Hence we conclude that, on some occasions, the hiss may be
0.000 0.005 0,010 0.015 0.020 0.000 0.005 0.010 0.015 0.020 0.025 0.030 D :: .-..-;:']';.,i:::i :'•"•'•'•"-'•---' "••,•:': . ======================.:'.'.'.'::": .': "'..' 0.00 0.02 0.04 0.06 0.08 •: •10 •20 • •0 •0 07• 0710 0720 07• R (R[): 5.31 5.10 4.87 4.• 4.40 4.15 3.89 3.• 3.• M•T (d•): 25.82 •.42 •.79 17.89 14.• 10.• 6.76 1.• -3.73 MLT (h): 9.• 9.• 9.88 g.• •.• 9.• 9.81 9.78 9.74 L: 6.55 6.05 5.57 5.13 4.71 4.• 3.97 3.• 3.•
Figure 3. Data
taken
on November
24, 1996,
and
displayed
in the same
way as in Figure
1, except
that
the
upper limit of the frequency band is now 1.5 kHz.1130 SANTOLiK ET AL.: PROPAGATION ANALYSIS OF PLASMASPHERIC HISS
generated by a different mechanism, but for our cases we can- not rule out the possibility that all of the waves originated with
their normals close to B0, and subsequently a small part of the
energy escaped to the Gendrin angle either by propagation or by
scattering from plasma density irregularities.
In the cases for May 2, 1997, and November 24, 1996, dis- cussed above, the region of wave amplification may be located
near the equator, at the magnetic latitudes q-1.8 ø and +8.5 ø
respectively.
Theory
predicts
that
the
amplification
should
peak
at the "minimum-B equator", the surface where the magnetic field strength has a minimum with respect to distance along any
field line. Using the IGRF model of the Earth's field together with the T89c model for the contributions from external sources
[Tsyganenko, 1989], we find that Polar crossed the minimum-B
equator at the magnetic latitudes - 1.5 ø and +0.6 ø respectively
in the present cases. Thus our regions of apparent amplification are not centered on the minimum-B equator. The explanation may be that the condition for maximum wave amplification in- volves both the properties of the wave and those of the medium. The theory assumes that the medium is symmetrical with re- spect to the minimum-B surface. This is approximately true for the magnetic field and for the energetic electrons, but it is not necessarily true for the thermal plasma. If the distribution of electron density is different in the two hemispheres the region of amplification could be displaced as our data suggest.
We are not sure of our identification of the amplification re- gions, because the trajectory of the satellite is not parallel to the magnetic field. In both of the cases presented above, Po- lar is moving inward to lower L-shells as well as southward in
magnetic latitude; the angle between the trajectory and B0 is about 60 ø . Changes in the total intensity of the hiss, observed
during both sequences of estimated WDFs, may well be due
to this cross-L motion. Indeed, around 0651 on November 24, 1996, we observe another reversal of the direction of the net
wave-energy flux, further away from the minimum-B equator than the two reversals discussed above. Moreover it has the
opposite sign, corresponding to apparent absorption rather than amplification, and for this reason we regard it as an effect of
Acknowledgments. We warmly thank J. Dowell who prepared
the HWFR data for analysis. O. Santol• acknowledges the support of
the International Program of Scientific Cooperation (PICS) 469, and
of grants 205/98/0691 and 205/99/1712 from the Czech Grant Agency. D. Gurnett and J. Pickett were supported by the NASA Goddard Space
Flight Center under Grant No. NAG5-7943.
References
Abel, B., and R. M. Thorne, Electron scattering loss in Earth's inner
magnetosphere: 2. Sensitivity to model parameters, J. Geophys. Res.,
103, 2,397-2,407, 1998.
Carpenter D. L., R. R. Anderson, W. Calvert, and M. B. Moldwin,
CRRES observations of density cavities inside the plasmasphere,
J. Geophys. Res., 105, 23,323-23,338, 2000.
Draganov, A. B., U.S. Inan, V. S. Sonwalkar, and T. F. Bell, Magne- tospherically reflected whistlers as a source of plasmaspheric hiss,
Geophys. Res. Lett., 19, 233-236, 1992.
Gendrin, R., Le guidage des whistlers par le champ magnitique,
Planet. Space Sct, 5, 274--282, 1960.
Gurnett, D. A., Plasma wave interactions with energetic ions near the
magnetic equator, J. Geophys. Res., 81, 2,765-2,770, 1976.
Gurnett, D. A., A.M. Persoon, R. F. Randall, D. L. Odem, S. L. Rem-
ington, T. E Averkamp, M. M. DeBower, G. B. Hospodarsky,
R. L. Huff, D. L. Kirchner, M. A. Mitchell, B. T. Pham, J. R. Phillips,
W. J. Schintler, P. Sheyko, and D. Tomash, The Polar Plasma Wave
Instrument, Space Sci. Rev., 71,597-622, 1995.
Kennel, C. F., and H. E. Petschek, Limit on stably trapped particle
fluxes, J. Geophys. Res., 71, 1-28, 1966.
Kolesnikova, E., and C. Beghin, The instability problem of the electric field antennas on the POLAR spacecraft, Radio Sci., in print, 2000.
Santol•, O., and M. Parrot, Application of wave distribution function
methods to an ELF hiss event at high latitudes, J. Geophys. Res., 105,
18,885-18,894, 2000.
Solomon, J., N. Cornilleau-Wehrlin, A. Korth, and G. Kremser, An
experimental study of ELF/VLF hiss generation in the Earth's mag-
netosphere, J. Geophys. Res., 93, 1,839-1,847, 1988.
Storey, L. R. O., and F. Lefeuvre, The analysis of 6-component measure-
ments of a random electromagnetic wave field in a magnetoplasma,
1, The direct problem, Geophys. J. R. Astron. Soc., 56, 255-270,
1979.
Storey, L. R. O., F. Lefeuvre, M. Parrot, L. Cair6, and R. R. Anderson,
Initial survey of the wave distribution functions for plasmaspheric
hiss observed by ISEE 1, J. Geophys. Res., 96, 19,469-19,489, 1991.
the cross-L
motion.
That is to say,
the satellite
moves
from an Thorne,
R. M., E. J. Smith,
R. K. Burton,
and
R. E. Holzer,
Plasma-
L-shell where the net energy flux has one direction to anotherwhere it has the opposite direction, observing an apparent re- versal in the net flux, although, had it been moving solely in
latitude on either of these L-shells, no reversal would have been
observed. Conceivably all of the reversals can be explained in this way, as being due to motion across L instead of motion
in latitude. Though with data from just two passes we cannot resolve this issue, it should be possible to do so statistically with data from many passes. If amplification is occurring in the observed range of L, then the reversals corresponding to
apparent amplification should be more common than those cor-
responding to apparent absorption, and they should be clustered
near the magnetic equator. If these predictions are confirmed,
the next step should be to compare the observed amplification factors with the values given by the theory of the electron gyro- resonance instability, using the energetic-electron distribution
functions from some other instruments on Polar. These tasks
are in our plans for future work.
spheric hiss, J. Geophys. Res., 78, 1,581-1,596, 1973.
Thorne, R. M., S. R. Church, and D. J. Gorney, On the origin of
plasmaspheric hiss: the importance of wave propagation and the
plasmapause, J. Geophys. Res., 84, 5,241-5,247, 1979.
Tsyganenko, N. A., A magnetospheric magnetic field model with a
warped tail current sheet, Planet. Space Sci., 37, 5-20, 1989.
D. A. Gurnett, J. S. Pickett, and O. Santol•, Department of Phy-
sics and Astronomy, University of Iowa, Iowa City, IA 52242-1479,
U.S.A. (e-mail: [email protected]. edu; [email protected].
uiowa. edu; ondrej.santolik@ mff. cuni.cz)
M. Parrot, Laboratoire de Physique et Chimie de l'Environnement,
CNRS, 3A, Avenue de la Recherche Scientifique, F-45071 Orl6ans
cedex 02, France. (e-mail: [email protected])
L. R. O. Storey, Quartier Luchi•ne, Route du Luberon, F-84160
Cucuron, France. (e-mail: [email protected])