HAL Id: hal-00302416
https://hal.archives-ouvertes.fr/hal-00302416
Submitted on 21 Dec 2004
HAL is a multi-disciplinary open access
archive for the deposit and dissemination of
sci-entific research documents, whether they are
pub-lished or not. The documents may come from
teaching and research institutions in France or
abroad, or from public or private research centers.
L’archive ouverte pluridisciplinaire HAL, est
destinée au dépôt et à la diffusion de documents
scientifiques de niveau recherche, publiés ou non,
émanant des établissements d’enseignement et de
recherche français ou étrangers, des laboratoires
publics ou privés.
observed in the auroral return current region by Cluster
G. T. Marklund, T. Karlsson, S. Figueiredo, T. Johansson, P.-A. Lindqvist,
M. André, S. Buchert, L. M. Kistler, A. Fazakerley
To cite this version:
G. T. Marklund, T. Karlsson, S. Figueiredo, T. Johansson, P.-A. Lindqvist, et al.. Characteristics of
quasi-static potential structures observed in the auroral return current region by Cluster. Nonlinear
Processes in Geophysics, European Geosciences Union (EGU), 2004, 11 (5/6), pp.709-720.
�hal-00302416�
SRef-ID: 1607-7946/npg/2004-11-709
Nonlinear Processes
in Geophysics
© European Geosciences Union 2004
Characteristics of quasi-static potential structures observed in the
auroral return current region by Cluster
G. T. Marklund1, T. Karlsson1, S. Figueiredo1, T. Johansson1, P.-A. Lindqvist1, M. Andr´e2, S. Buchert2, L. M. Kistler3, and A. Fazakerley4
1Division of Plasma Physics, Alfv´en Laboratory, Royal Institute of Technology, SE 10044 Stockholm, Sweden 2Swedish Institute of Space Physics, Box 534, SE 75121 Uppsala, Sweden
3University of New Hampshire, Space Sciences Centre, Durham, NH 03824, USA
4Mullard Space Science Laboratory, University College London, Holmbury St. Mary, Dorking, Surrey RH5 6NT, United
Kingdom
Received: 21 September 2004 – Revised: 9 December 2004 – Accepted: 10 December 2004 – Published: 21 December 2004 Part of Special Issue “Advances in space environment turbulence”
Abstract. Temporal and spatial characteristics of intense
quasi-static electric fields and associated electric potential structures in the return current region are discussed using Cluster observations at geocentric distances of about 5 Earth radii. Results are presented from four Cluster encounters with such acceleration structures to illustrate common as well as different features of such structures. The electric field structures are characterized by (all values are projected to 100 km altitude) peak amplitudes of ≈1 V/m, bipolar or unipolar profiles, perpendicular scale sizes of ≈10 km, occurrence at auroral plasma boundaries associated with plasma density gradients, downward field-aligned currents of
≈10 µA/m2, and upward electron beams with characteristic energies of a few hundred eV to a few keV. Two events il-lustrate the temporal evolution of bipolar, diverging electric field structures, indicative of positive U-shaped potentials in-creasing in magnitude from less than 1 kV to a few kV on a few 100 s time scale. This is also the typical formation time for ionospheric plasma cavities, which are connected to the potential structure and suggested to evolve hand-in-hand with these. In one of these events an energy decay of inverted-V ions was observed in the upward field-aligned current region prior to the acceleration potential increase in the adjacent downward current region, possibly suggesting that a potential redistribution took place between the two cur-rent branches. The other two events were characterized by intense unipolar electric fields, indicative of S-shaped poten-tial contours and were encountered at the polar cap bound-ary. The total observation time for these events was typically 10–20 s, too short for monitoring the evolution of the struc-ture, but yet of interest for revealing their short term stabil-ity. The locations of the two bipolar events at the poleward boundary of the central plasma sheet and of the two
unipo-Correspondence to: G. T. Marklund
lar events at the polar cap boundary, suggest that the special profile shape depends on whether plasma populations, dense enough to support upward field-aligned currents and closure of the return current, exist on both sides, or on one side only, of the boundary.
1 Introduction
A key issue in auroral research is how the quasi-static auroral potential structures are formed and maintained and how they contribute, in addition to Alfv´en waves, to the acceleration of auroral particles and to the energy transport towards and away from the auroral ionosphere. Up to the late 80’s the common viewpoint was that acceleration by quasi-static po-tential structures mainly took place in the region of upward field-aligned currents. This current, carried by precipitat-ing electrons accelerated towards Earth producprecipitat-ing the aurora, is always accompanied by an oppositely directed downward current, the auroral return current, carried by upward flow-ing ionospheric electrons. Together these adjacent and oppo-sitely directed currents are connected in a common current circuit, the auroral current circuit. Before the Freja and FAST satellite missions in the early and mid 90’s, the return current was believed to be carried by cold electrons supplied by an almost infinite ionospheric reservoir. Marklund et al. (1994) reported on the first observations of intense, and very narrow-scale diverging electric fields at relatively low altitudes in the return current region based on Freja data. The intensity and occurrence of such electric fields was found to peak during conditions of low plasma density and ionospheric conductiv-ity, such as close to winter solstice and local midnight. The Freja results clearly demonstrated that the picture of the re-turn current as simply a passive element in the auroral current circuit had to be revised.
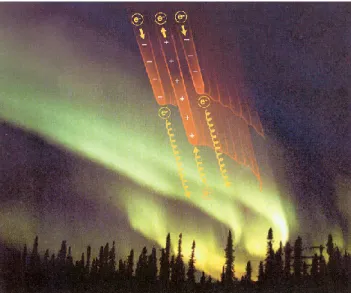
Fig. 1. Negative and positive potential structures and associated downward and upward flow of accelerated electrons carrying the upward and downward field-aligned currents, respectively, for the case of two parallel discrete auroral arcs embedding a region of black aurora.
The first conclusive evidence of the existence of positive potential structures associated with downward parallel elec-tric fields in the auroral return current region was presented by Marklund et al. (1997) based on both event studies (Mark-lund et al., 1994; 1995) and statistical studies (Karlsson and Marklund, 1996) of intense diverging electric fields and asso-ciated particle characteristics observed by Freja. The positive potential structures, developing in conjunction with black au-rora, were proposed to form the counterpart to the negative potential structures, developing in the upward current region and responsible for producing the discrete aurora. Figure 1 illustrates the negative and positive potential structures and associated downward and upward flow of accelerated elec-trons, respectively, for the case of two parallel discrete arcs embedding a region of black aurora. Observations by the FAST auroral satellite later confirmed these findings and pro-vided, in addition, unprecedented details of the particle and wave characteristics in the return current region (Carlson et al., 1998; Ergun et al., 1998). The parallel potentials were for some events shown to have the form of monotonic potential ramps, localized to about 10 Debye lengths, and accompa-nied by intense electrostatic waves and electron phase-space holes (Ergun et al., 2001; Andersson et al., 2002).
Quasi-static bipolar, divergent electric fields are indica-tive of posiindica-tive U-shaped potential contours whereas unipo-lar electric fields suggest S-shaped potential contours (e.g. Marklund et al., 1997). Sometimes one electric field profile dominates on a certain scale whereas another profile domi-nates on a different scale which results in combinations of U-and S-shaped equipotential contours, as discussed by e.g. Chiu et al. (1981). How are these structures formed and maintained and how time independent are they? What are
Fig. 2. Positions and trajectories of the Cluster spacecraft, projected to the 100 km altitude level and using a Corrected Geomagnetic Latitude-Magnetic Local Time diagram, for each of the four events. The Cluster spacecraft 1, 2, 3, and 4 are represented by black, red, green, and blue colours, respectively.
the conditions behind the development of the U-shaped and S-shaped configuration, respectively? Do the electric field structures map quasi-statically to high altitudes or do they close above the acceleration region?
Data from the Polar satellite at geocentric distances of 4– 7 RE have shown the existence of electric field structures
with perpendicular electric field magnitudes that can exceed 100 mV/m (Keiling et al., 2001). The magnitude-versus-altitude distribution of these electric fields was consistent with both the assumption of propagating shear Alfv´en waves and with electrostatic structures extending over this altitude range. In their study no distinction was made between di-vergent and condi-vergent electric field structures in the return current region and primary current region, respectively. Jan-hunen et al. (1999) used Polar data to investigate whether converging electric fields associated with negative potential structures extended up to Polar altitudes. They concluded that the lack of such events at Polar altitudes could be ex-plained by an O-shaped potential model, which, however, provides no net energy gain for the electrons. To identify the nature of the electric field variations is, however, difficult from Polar and other single satellite observations. Multi-point measurements from Cluster crossings of auroral field
Fig. 3. Overview of the locations of the four electric field events, with respect to the auroral oval and plasma boundaries. The corre-sponding Cluster orbit segments have been projected to the north-ern auroral ionosphere using an Invariant Latitude-Magnetic Local Time polar diagram. Events 1 and 2 were encountered at the bound-ary between the plasma sheet boundbound-ary layer (blue color) and the central plasma sheet (green color) and events 3 and 4 were encoun-tered at the polar cap boundary.
lines provide, however, a very powerful means for separating between temporal and spatial variations, such as associated with waves and quasi-static structures.
This study uses data from four Cluster crossings of au-roral field lines at geocentric distances of 4–5 Earth Radii. Two events are from early 2001 when the inter-spacecraft separation was large and the spacecraft configured, close to perigee, nearly as pearls-on-a-string with about 100 s time separation between consecutive crossings. For the other two events from spring 2002, the separations between the Clus-ter spacecraft were an order of magnitude smaller and the configuration slightly more tetrahedron-like with typical time separations between consecutive crossings of 10–20 s. Fig-ure 2 a-d show the positions of the four Cluster spacecraft projected to 100 km altitude in a Corrected Geomagnetic Lat-itude and Magnetic Local Time diagram for each of the four events discussed here. The arrows indicate the direction of the spacecraft motion in this projection.
The data used for this study were obtained by the Electric Field and Wave experiment (EFW, Gustafsson et al., 1997), the Flux-Gate Magnetometer (FGM, Balogh et al., 1997), and the Plasma Electron and Current Experiment (PEACE, Johnstone et al., 1997), all described in ”The Cluster and Phoenix Missions” (special issue of Space Science Reviews, 1997). In one event for which electron data were missing we have instead used CIS ion data (Cluster Ion Spectrometer, R`eme et al., 1997) to investigate the particle characteristics associated with the electric field structure.
2 Overview of the events
Figure 3 shows the four selected Cluster auroral oval cross-ings, projected to the northern auroral ionosphere and plotted in an Invariant Latitude-Magnetic Local Time polar diagram.
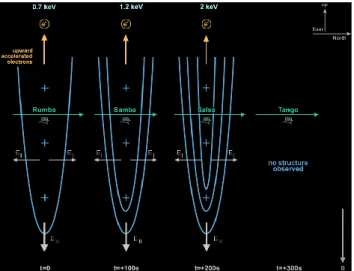
Fig. 4. Proposed scenario for event 1. The Cluster spacecraft crossed the high-altitude flanks of a positive U-shaped potential structure in roughly the same orbits and separated in time by about 100 s. The perpendicular potentials, derived from the measured electric field, equal the acceleration potential inferred from the char-acteristic energy of the upward electrons, indicative of a positive U-shaped potential structure. The structure intensifies on a time scale of a few 100 s (first three crossings) similar to the time scale for evacuating the E-region and lower F-region electrons, suggesting that the two processes are related and evolve hand in hand. At the time of the last Cluster crossing the structure had died out.
The events all took place at nightside auroral plasma bound-aries. Events 1 and 2 from early 2001 were both encountered at the boundary between the plasma sheet boundary layer (PSBL, represented by blue color) and the central plasma sheet (CPS, represented by green color), whereas events 3 and 4 were encountered at the polar cap boundary. Note that all Cluster parameter values discussed below have been pro-jected to be representative at the ionospheric level.
2.1 Poleward oval crossing 14 January 2001 at about
04:30 UT and 03:00 MLT (Northern hemisphere, geo-centric distance of ≈4.3 RE)
This event from 14 January 2001 has been discussed in some detail by Marklund et al. (2001) and the main results are illus-trated schematically by Fig. 4. The Cluster spacecraft mon-itored the evolution of a positively charged U-shaped poten-tial structure, crossing its high-altitude flanks in roughly the same orbits (except for spacecraft 2 which was slightly dis-placed in longitude) and separated in time by about 100 s. The perpendicular potential across the structure, as derived from the measured electric field, agreed well for all four spacecraft with the acceleration potential (or parallel po-tential), inferred from the characteristic energy of the up-ward moving electrons, indicative of a U-shaped potential structure with the acceleration region well below the Clus-ter spacecraft. The acceleration potential of the structure increased from 0.5 kV at T =0 (s/c 1 crossing), to 1.1 kV at
(a) (b)
(c) (d)
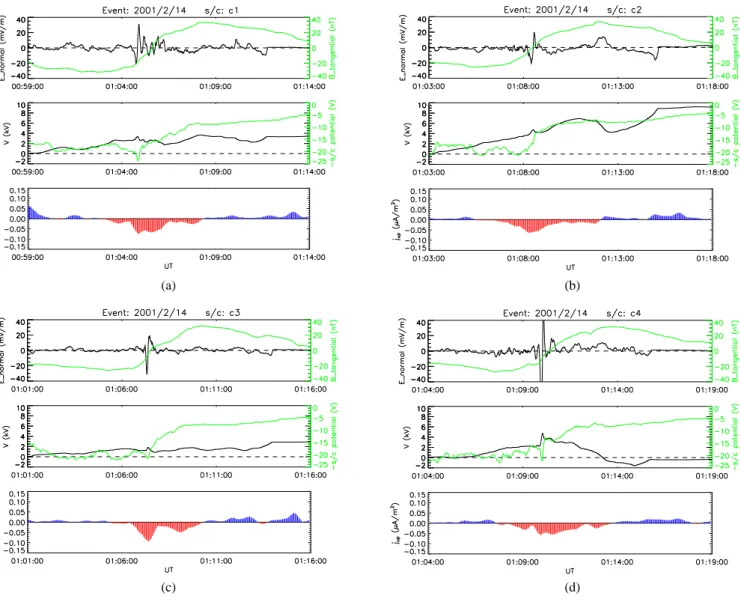
Fig. 5. Electric and magnetic field data for event 2, for each of the spacecraft (a)–(d). The top panel shows the normal electric field (black line) and the tangential magnetic field (green line) components; the middle panel shows the electric potential (black line) and the negative of the spacecraft potential indicative of relative plasma density variations (green line); and the bottom panel shows the FAC distribution (up-and downward directed FACs in blue (up-and red color, respectively). The divergent bipolar electric field structure is associated with a localized FAC intensification within a large-scale downward FAC, a plasma density drop on a large-scale density gradient, and a positive potential peak. The positive potential peak maintained a fairly stable value of 1 kV between the first and the third crossing and increased to 2.7 kV by the time of the last crossing, on a time scale of 100 s.
(s/c 2 crossing), followed by a sudden drop to below 0.8 kV at T =300 s (s/c 4 crossing). During this evolution, the asso-ciated downward FAC, carried by ionospheric upgoing elec-trons, maintained roughly a constant magnitude, but flowed in progressively widening sheets.
The similarity between the time scale of evolution of the structure and for the density hole formation (a few 100 s) sug-gests a close connection between the two processes. As the upward flow of electrons emptied the electron supply in the ionosphere below the structure, the current sheet widened to make available a sufficient supply of electrons to maintain the constant current. At the time of the last crossing, the current sheet was almost ten times larger than initially, making avail-able current carriers from the surrounding ionosphere not yet
effected by the evacuation process. At this time the accel-eration structure had almost disappeared, as indicated by the drop in the acceleration energy of the electrons, the disap-pearence of the electric field and of the plasma density gradi-ent (see Marklund et al., 2001 for more details on this evgradi-ent).
2.2 Equatorward oval crossing 14 February 2001 at about
01:10 UT and 00:00 MLT (Southern hemisphere, geo-centric distance of ≈4.2 RE)
This event took place above the southern hemisphere auroral oval, between 00:45 and 01:15 UT on 14 February, 2001, near 00:20 MLT in the growth phase of a weak substorm peaking around 02:00 UT. Since the Cluster crossing took place over the southern auroral ionosphere, not monitored
100 1000 10000 SC1 H + (eV) 100 1000 10000 1 10000 1/cm 2-s-sr-(eV/e) 0 100 200 300 SC1 H+ 3-10 k eV 0 100 200 300 1 1000 0 100 200 300 SC1 H+ 0.3-3 k eV 0 100 200 300 1 1000 1/cm 2-s-sr-(eV/e) 0 100 200 300 SC1 H+ 0.03-0.3 k eV 0 100 200 300 10 10000 100 1000 10000 SC1 O + (eV) 100 1000 10000 0.1 1000.0 1/cm 2-s-sr-(eV/e) 0 100 200 300 SC1 O+ 3-10 k eV 0 100 200 300 0.1 100.0 0 100 200 300 SC1 O+ 0.3-3 k eV 0 100 200 300 1 1000 1/cm 2-s-sr-(eV/e) 0040 -2.1 -2.0 -3.6 4.6 0100 -2.7 -1.9 -2.9 4.3 0120 -3.1 -1.7 -2.1 4.1 0 100 200 300 SC1 O+ 0.03-0.3 k eV 0040 -2.1 -2.0 -3.6 4.6 0100 -2.7 -1.9 -2.9 4.3 0120 -3.1 -1.7 -2.1 4.1 0 100 200 300 10 10000 hhmm 2001 Feb 14 XGSE YGSE ZGSE DIST 100 1000 10000 SC1 H + (eV) 100 1000 10000 1 10000 1/cm 2-s-sr-(eV/e) 100 1000 10000 SC1 O + (eV) 100 1000 10000 0.1 1000.0 100 1000 10000 SC3 H + (eV) 100 1000 10000 1 10000 1/cm 2-s-sr-(eV/e) 100 1000 10000 SC3 O + (eV) 100 1000 10000 0.1 1000.0 100 1000 10000 SC4 H + (eV) 100 1000 10000 1 10000 1/cm 2-s-sr-(eV/e) 0030 -1.7 -2.1 -4.0 4.9 0100 -2.5 -1.9 -3.0 4.4 0130 -3.2 -1.7 -1.9 4.1 100 1000 10000 SC4 O + (eV) 0030 -1.7 -2.1 -4.0 4.9 0100 -2.5 -1.9 -3.0 4.4 0130 -3.2 -1.7 -1.9 4.1 100 1000 10000 0.1 1000.0 hhmm 2001 Feb 14 XGSE YGSE ZGSE DIST (a) (b)
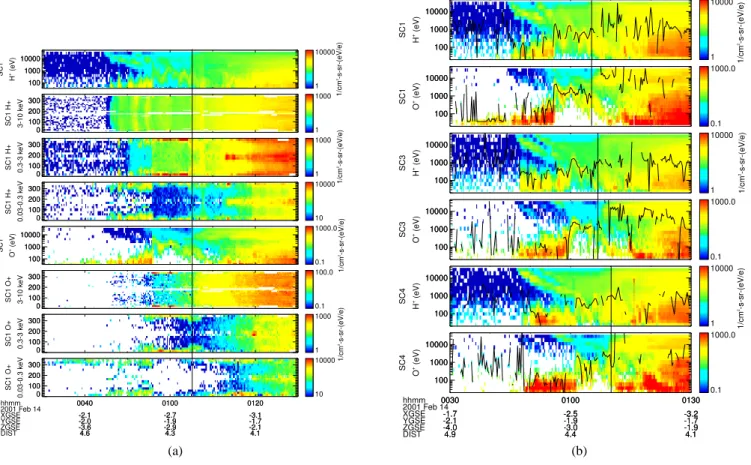
Fig. 6. (a) Time-energy spectrograms and pitch-angle distributions for H+ ions (panels 1–4) and O+ions (panels 5–8) in three energy
ranges measured by spacecraft 1 from 00:30 UT to 01:30 UT on 14 February 2001 (event 2). The electric field structure was encountered at 01:04:40 UT at the PSBL/CPS boundary, also forming the equatorward edge of an inverted-V region associated with weak upward FACs.
(b) Time-energy spectrograms for H+ions (panels 1–3) and O+ions (panels 4–6) measured by spacecraft 1, 3, and 4, respectively. Note
the structured inverted-V region encountered prior to (poleward of) the electric field structure at the PSBL/CPS boundary and seen for both
H+ions and O+ions on all three spacecraft. Note also that the characteristic energy of the inverted-V ions, indicated by the vertical lines,
decreases between the crossings by spacecraft 1, 3, and 4.
by space-borne auroral imagers, we only note here that at the time of the Cluster crossing intense discrete auroras were present in the duskside and midnight sectors of the northern auroral oval according to the IMAGE satellite images (not shown here). The event location is illustrated in Figs. 2b and 3.
Figures 5a–5d show electric field (EFW) and magnetic field (FGM) data measured by the four Cluster spacecraft for 15 min periods containing the electric field structure and starting at 00:59, 01:03, 01:01, and 01:04 UT for space-craft 1, 2, 3, and 4, respectively. The black lines in the top panels show the electric field component perpendicular to the magnetic field and normal to the local orientation of the structure (derived by minimum and maximum variance of the magnetic and electric field, respectively), and posi-tive in the equatorward direction. The green lines in the top panels show the perpendicular magnetic field component tan-gential to the structure and positive in the eastward direction. The middle panels show the perpendicular potential (black line), derived by integrating the perpendicular electric field,
and the negative of the spacecraft potential (green line), in-dicative of the relative variations of the plasma density. The bottom panels show the FACs, calculated from the tangential magnetic field component after subtraction of a polynomial fit to the data over a two-hour interval of time. Upward and downward FACs are represented by blue and red colors, re-spectively. The downward FAC peaks are co-located with the electric field structure. The small-scale FAC associated with the electric field structure is embedded within a more exten-sive downward FAC, which remains relatively stable in terms of magnitude and width for the four crossings between 00:59 and 01:19 UT, but reveals internal current density variations from one crossing to another.
The electric field structure was encountered at
01:04:40 UT by spacecraft 1, at 01:07:20 UT by spacecraft 3, at 01:08:20 UT by spacecraft 2, and at 01:10:00 UT by spacecraft 4. The structure is associated with a narrow-scale density cavity superposed on a large-scale plasma density
gradient, as inferred from the −Vs/c variations in panel
Cluster 4 PEACE Electrons at 0,90,180 deg V wrt to B 10-6 10-5 10-4 10-3 ergs/cm**2-s-str-eV dEF 10-6 10-5 10-4 ergs/cm**2-s-str-eV 10-6 10-5 10-4 ergs/cm**2-s-str-eV 102 103 104 electron volts eV 102 103 electron volts eV 2002/117 SM Lat ILAT MLT SM Radius 101 102 103 electron volts eV 19:37 -43.50 71.78 19.90 5.23 19:40 -42.17 71.30 19.90 5.19 19:43 -40.81 70.82 19.96 5.14 19:46 -39.43 70.34 20.02 5.10
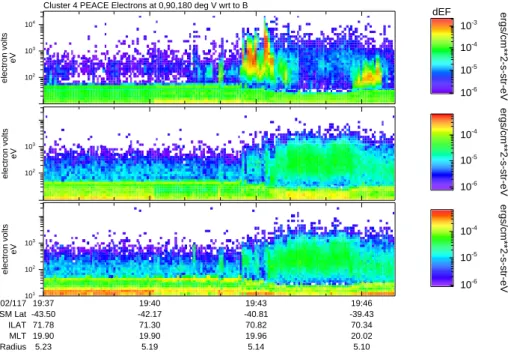
Fig. 7. Time energy spectrograms of PEACE electron data in the directions parallel, perpendicular, and anti-parallel to the geomagnetic field, B, for event 3 on 27 April 2002. Note that the upward electron beam (top panel) is split up in two flux enhancements, one wider region with a characteristic energy of ≈0.7 keV, and a more narrow region with a characteristic energy of ≈3 keV.
increase from about 30 mV/m and 0.4 kV, respectively, on spacecraft 1, to 150 mV/m and 2.7 kV, respectively, on spacecraft 4, most of the increase taking place between the last two crossings, i.e. on a time scale of about 100 s. The observed intensification of the electric field and of the associated positive potential peak on a 100 s time scale are similar characteristics to those observed in the previous event and thus supporting a similar scenario.
Figure 6a shows time-energy spectrograms and corre-sponding pitch-angle distributions for H+ (panels 1–4) and
O+(panels 5–8) ions in three energy ranges for spacecraft 1
from 00:30 UT to 01:30 UT. The black vertical line marks the encounter with the electric field structure at 01:04:40 UT, at the equatorward boundary of the plasma sheet boundary layer (and of an enclosed large-scale inverted-V associated with a weak upward FAC). The inverted-V region is traversed by spacecraft 1 between 00:56 UT and 01:04:40 UT and is characterized by upward field-aligned ion fluxes (low/middle energy range for H+and middle/high energy range for O+). The poleward flank of the inverted-V is characterized by lower-energy and more conic-like ion distributions and the equatorward flank by a similar but denser conic-like popula-tion with regions of more isotropic ion fluxes.
In Fig. 6b are shown time-energy spectrograms for H+and O+for spacecraft 1, 3, and 4 between 00:30 and 01:30 UT. Note that the characteristic energy of the inverted-V ions as-sociated with the upward FAC distribution seen prior to the electric field structure in Fig. 5, decreases clearly between the first, the third, and the fourth crossing. Thus, a decrease in the acceleration potential is observed in the upward current region some minutes prior to the encounter with the growing
positive potential structure in the adjacent downward current region. The inverted-V potential decrease is roughly equal to the subsequent perpendicular potential increase, such that the sum of the two acceleration potentials is roughly con-stant. The scenario with a decaying inverted-V in the up-ward FAC region followed by an increasing acceleration po-tential in the downward FAC region, suggest that a possible potential redistribution took place between the two current branches. However, since the observations of the inverted-V and of the return current structure were not made at the same time but delayed by several minutes, and since the downward FAC closure is not known in detail, such a scenario can not be conclusively proven by the data.
2.3 Equatorward oval crossing 27 April 2002 at about
19:40 UT and 20:00 MLT (Southern hemisphere, geo-centric distance of ≈5.1 RE)
This and the following event took place in late spring 2002, when the spacecraft separation was an order of magni-tude smaller and the spacecraft configuration slightly more tetrahedron-like than for the previous events. We show here only data from spacecraft 3 to illustrate the characteristics of the encountered structures (data from all four Cluster cross-ings are shown by Johansson et al., 2004).
Figure 7 shows time energy spectrograms of PEACE elec-tron data in the directions parallel, perpendicular, and anti-parallel to the geomagnetic field, B. Note that the upward electron flux (top panel) enhancement takes place in two ad-jacent regions, one wider region with a characteristic energy of ≈0.7 keV and a more narrow region with a characteristic energy of ≈3 keV. Figure 8 shows the corresponding electric
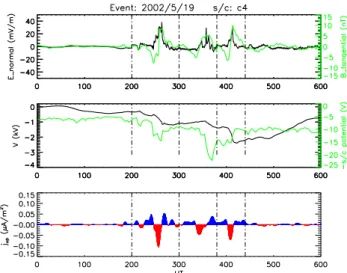
Fig. 8. Electric and magnetic field data from Cluster spacecraft 4 for vent 3, using the same format as in Fig. 5. The vertical dashed lines indicate the time interval dominated by spatial or quasi-static elec-tric field variations. These include an intense unipolar elecelec-tric field structure reaching 140 mV/m and ahead of this a weaker bipolar structure reaching 30 mV/m (top panel), corresponding to the two minor potential peaks or kinks, superposed on the large-scale po-tential increase (panel 2), each associated with a narrow downward FAC (panel 3) and an upward electron flux enhancement (Fig. 7, panel 1) with characteristic energies in the range of the associated perpendicular potential peaks (cf. Table 1).
and magnetic field data using the same format as in Fig. 5. The panels show, from top to bottom: the normal electric field (black line) and the tangential magnetic field (green line) components, the electric potential (black line) and the negative of the spacecraft potential (green line), and the cal-culated FAC distribution (upward and downward FACs in blue and red, respectively) for the same interval of time as in Fig. 7. For this and the following event we have chosen to present the FAC distributions presented by Johansson et al. (2004), who used another way for removing the back-ground magnetic field, namely by subtraction of a running-window average (1 min wide and steps of 10 s) rather than subtracting a polynomial fit to the data. The latter method may be more suitable for FAC estimates that are representa-tive at larger scales.
The electric field seen within the two vertical lines (where the variations are found to be spatial or quasi-static) is com-posed of one weaker, roughly bipolar electric field structure reaching ≈30 mV/m and one intense, unipolar electric field puls reaching 140 mV/m. The first of these is associated with a small positive potential peak and the other with a minor peak followed by a steep slope, appearing as local maxima or kinks on the continuous large-scale potential increase (Fig. 8, panel 2). They are co-located with narrow downward FACs (Fig. 8, panel 3) and with upward electron beams (Fig. 7, panel 1) with characteristic energies roughly consistent with the net perpendicular potentials (cf. Table 1).
Fig. 9. Electric and magnetic field data from Cluster spacecraft 4 for event 4, using the same format as in Figs. 5 and 8. Here, two time intervals were found to be dominated by spatial or quasi-static electric field variations, as indicated by the first two and the last two vertical lines. The electric field peaks in these two regions are both unipolar and show up in panel 3 as local, weak potential peaks fol-lowed by steep negative slopes, each associated with a downward FAC surrounded by upward FACs, and superposed on a slowly de-caying large-scale potential.
2.4 Equatorward oval crossing 19 May 2002 at about
05:30 UT and 20:00 MLT (Southern hemisphere, geo-centric distance of ≈5.0 RE)
Figure 9 shows electric and magnetic field data for this event using the same format as in Figs. 5 and 8. Three electric field structures are seen, the first and the third being of spatial na-ture and the less intense middle strucna-ture of temporal nana-ture, as concluded by Karlsson et al. (2004). The electric field peaks in regions 1 and 3 are essentially unipolar and show up in panel 2 as minor local maxima followed by negative slopes, superposed on the slowly decaying large-scale poten-tial. Each peak is further associated with a downward FAC surrounded by upward FACs. Figure 10 shows time energy spectrograms of electron fluxes in the directions parallel, per-pendicular, and anti-parallel to B for this event. Note that the first and the third upward electron beam in the top panel are co-located with the electric fields peaks in regions 1 and 3 and to the downward FAC peaks.
Note the close similarities between the electric field peaks in region 1 and 3 and between the signatures of their asso-ciated current, electron, and potential profiles. This raises the question whether the Cluster spacecraft passed above a folded auroral form, such as a surge, crossing its boundary twice but at different locations. The detailed minimum vari-ance and cross-correlation analysis performed by Karlsson et al. (2004) gave an orientation for the electric field struc-ture and associated FAC sheet that deviated from an
east-west alignment by roughly +45 for region 1 and −45◦ for
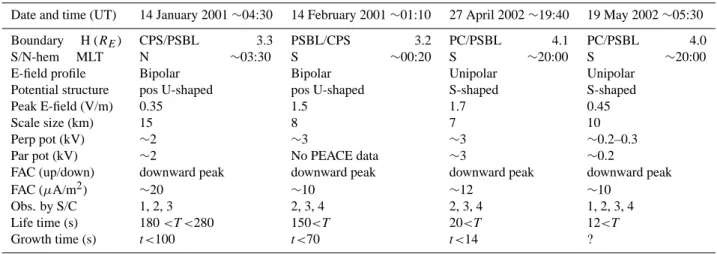
Table 1. Summary of characteristics of return current electric field events observed by Cluster.
Date and time (UT) 14 January 2001 ∼04:30 14 February 2001 ∼01:10 27 April 2002 ∼19:40 19 May 2002 ∼05:30
Boundary H (RE) CPS/PSBL 3.3 PSBL/CPS 3.2 PC/PSBL 4.1 PC/PSBL 4.0
S/N-hem MLT N ∼03:30 S ∼00:20 S ∼20:00 S ∼20:00
E-field profile Bipolar Bipolar Unipolar Unipolar
Potential structure pos U-shaped pos U-shaped S-shaped S-shaped
Peak E-field (V/m) 0.35 1.5 1.7 0.45
Scale size (km) 15 8 7 10
Perp pot (kV) ∼2 ∼3 ∼3 ∼0.2–0.3
Par pot (kV) ∼2 No PEACE data ∼3 ∼0.2
FAC (up/down) downward peak downward peak downward peak downward peak
FAC (µA/m2) ∼20 ∼10 ∼12 ∼10
Obs. by S/C 1, 2, 3 2, 3, 4 2, 3, 4 1, 2, 3, 4
Life time (s) 180 <T <280 150<T 20<T 12<T
Growth time (s) t <100 t <70 t <14 ?
structures in the two regions and deviations from an east-west alignment indicates that these structures were associated with one or more strongly folded auroral forms. By assuming that the structures observed in region 1 and 3 were encoun-tered at the western and eastern flanks of a surge propagat-ing westward at a constant velocity, with components nor-mal to the western and eastern flank taken from the results of the cross-correlation, the surge velocity was estimated to be about 20 km/s locally and 2 km/s at the ionospheric level.
Given this scenario, the number of regions characterized by intense electric and magnetic field variations, thus re-duce from three to two regions. One poleward region, char-acterized by a unipolar electric field associated with an in-tense downward FAC and an upward electron beam, and closely tied to the poleward boundary of the surge (the po-lar cap boundary) and associated plasma density gradient. Equatorward of this is a region dominated by less intense, time-varying electric and magnetic fields (10–20 mHz) of Alfv´enic nature, a common feature of the poleward part of the nightside active auroral oval, sometimes developing into poleward boundary intensifications.
2.5 Event summary
The main characteristics of the selected electric field struc-tures are summarized in Table 1, where all values have been projected to the 100 km altitude level. The two bipolar elec-tric field events were encountered at the CPS/PSBL bound-ary and are indicative of positive U-shaped potential struc-tures. The unipolar electric field structures were encountered at the polar cap boundary and are indicative of narrow-scale S-shaped potential structures. The electric field amplitudes range from 0.35 to 1.7 V/m, values exceeding the maximum electric fields observed in the ionosphere and thus indicative of parallel electric fields below the Cluster spacecraft. The perpendicular scale sizes, in a direction normal to the struc-ture and perpendicular to B, range between 7 and 15 km. The calculated perpendicular potentials range from less than one
kV to a few kV, the latter representing the peak potentials observed during their evolution, and consistent with the ob-served characteristic energy of the associated upward elec-tron beams as well as with statistical results from FAST by Cattell et al. (2004). The associated FACs, which are all downward, have maximum current densities between 10 and 20 µA/m2.
The life and growth time estimates given in Table 1 are very crude, considering the few events, the “short sampling time” (especially for the 2002 events when the separation dis-tances were small) and the ”poor sampling rate” (especially for the 2001 events when the separations were large). The time scale of a few 100 s, derived for the two events from 2001 is, however, believed to be representative for the time of evolution of the structures, supported by its similarity to the formation time of ionospheric plasma density cavities.
3 Discussion
This study is focussed on Cluster observations in the return current region where downward field-aligned electric fields associated with quasi-static U-or S-shaped (or combinations thereof) equipotential structures, accelerate beams of elec-trons away from Earth and ions towards Earth (undetectable by Cluster but detectable by low-altitude orbiting satellites, such as Freja, Hultqvist, 2002). The quasi-static accelera-tion is often accompanied by Alfv´en wave acceleraaccelera-tion (Jo-hansson et al., 2004), sometimes adjacent to, sometimes co-located with, the quasi-static acceleration. The return current acceleration typically occurs between 1000 km and 4000 km altitude, i.e. much closer to Earth than the primary accelera-tion region. For both the return current and the primary ac-celeration regions the intensity and the altitude of the accel-eration depend strongly on the ambient plasma density and ionospheric conductivity such that, the darker the ionosphere (lower plasma density and lower ionospheric conductivity),
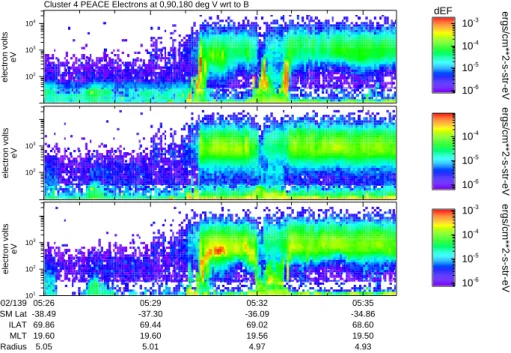
Cluster 4 PEACE Electrons at 0,90,180 deg V wrt to B 10-6 10-5 10-4 10-3 ergs/cm**2-s-str-eV dEF 10-6 10-5 10-4 ergs/cm**2-s-str-eV 10-6 10-5 10-4 10-3 ergs/cm**2-s-str-eV 102 103 104 electron volts eV 102 103 electron volts eV 2002/139 SM Lat ILAT MLT SM Radius 101 102 103 electron volts eV 05:26 -38.49 69.86 19.60 5.05 05:29 -37.30 69.44 19.60 5.01 05:32 -36.09 69.02 19.56 4.97 05:35 -34.86 68.60 19.50 4.93
Fig. 10. Time energy spectrograms of PEACE electron data in the directions parallel, perpendicular, and anti-parallel to B, for the same time interval as in Fig. 9 (event 4). Note that the first and the third upward electron beam in the top panel are co-located with the electric fields and the downward FAC peaks in region 1 and 3.
the lower is the altitude of, and the more intense is, the ac-celeration (cf. Marklund et al., 1997).
The temporal evolution of a divergent electric field struc-ture associated with black aurora was illustrated schemati-cally in Fig. 4 for event 1 from 14 January 2001. The posi-tive potential structure, accelerating electrons away from the auroral ionosphere, and the associated ionospheric density cavity below, are proposed to evolve hand in hand, closely tied to the supply of return current carriers (Marklund et al., 2001). The same general scenario applies for event 2, with a dipolar, divergent electric field encountered at the CPS/PSBL boundary, increasing in magnitude from less than one kV to a few kV on a time scale of some 100 s.
By using inter-spacecraft correlation combined with minimum-B and maximum-E variance analysis Karlsson et al. (2004) presented a powerful tool to separate temporal and spatial variations as well as to reconstruct the geometry of a structure and its motion relative to the Cluster spacecraft. This method was applied on events 3 and 4, for which the spacecraft configuration close to perigee could not simply be described as equidistant pearls-on-a-string (as was the case for events 1 and 2). The contribution by quasi-static struc-tures and by Alfv´en waves for the acceleration of auroral par-ticles and for the energy transport was addressed by Johans-son et al. (2004). They found that the variations identified as spatial were significantly larger than the variations identified as temporal, indicating that the quasi-static acceleration was relatively more important for these two events. Furthermore the structures were found to be relatively stable on the time scales between consecutive crossings, typically 10–20 s.
The four return current acceleration structures are
char-acterised by (all values being projected to the ionospheric level): electric field amplitudes of about 0.5–1 V/m, per-pendicular scale sizes of 10 km, bipolar (indicative of pos-itive U-shaped equipotential structures) or unipolar (indica-tive of S-shaped potential structures) shapes, occurrence at plasma boundaries associated with plasma density gradients
and downward FACs of 10–20 µA/m2. The time of
observa-tion of these structures ranged between 20 s<t <180 s. The lower limit of 20 s is too short for revealing the life cycle of the acceleration structures but yet of interest for reveal-ing their short-term stability. The upper limit of a few 100 s is, however, representative for the time of growth of the ac-celeration structures for the two events from 2001, and for the typical time for formation of ionospheric plasma density
cavities for a FAC density of 10–20 µA/m2and an average
ionospheric plasma density background. For a FAC density a factor of 10 larger (smaller) the transport is more (less) effi-cient and the life time estimates will be a factor of 10 smaller (larger). We believe there is a close connection between the evolution of the acceleration structures and the formation of plasma density cavities in the ionosphere, as explained by Marklund et al. (2001) but more events are needed to prove such a connection conclusively.
Figure 3 illustrates the locations of the two bipolar electric field events (1 and 2) at the CPS/PSBL boundary and of the unipolar events (3 and 4) at the polar cap boundary. There are many conditions that may influence the specific shape of the electric field and four events are clearly not sufficient to allow any firm conclusions. However, the different profiles may depend on the different plasma conditions and ability for current closure of the downward FAC to upward FACs
at the different boundaries. Consider, for simplicity, the case of a small convection electric field and a homogeneous ionospheric conductivity. A diverging electric field structure above the acceleration region will correspond to a diverging electric field also at the ionospheric level, with reduced mag-nitudes but with the same orientations as the high-altitude field. For the diverging, bipolar cases (events 1 and 2) iono-spheric closure can be accomplished by oppositely directed (diverging) Pedersen currents linked to upward FACs both poleward and equatorward of the boundary. For the unipolar cases (events 3 and 4) closure is more likely accomplished by one single equatorward Pedersen current linked to upward FACs in the PSBL. Thus, the presence of relatively dense plasma populations on both sides of the boundary, such as for the two events from early 2001 at the CPS/PSBL boundary, could be a condition that favours the bipolar electric field pro-file (and associated U-shaped potential structure). The lack of a relatively dense plasma population on one side of the boundary, as for the case of the polar cap boundary, is a con-dition that might favour the unipolar electric field profile (and associated S-shaped potential structure) observed for events 3 and 4.
The Cluster results presented here demonstrate clearly that the equipotential structures, associated with the down-ward field-aligned electric field located between 1000 km and 4000 km, map quasi-statically up to Cluster altitudes at 4–5 RE geocentric distance, although this does not always
have to be the case. Of the Cluster auroral studies conducted so far it appears as if intense diverging electric field struc-tures are relatively more common in the data than converging electric field structures at Cluster altitude, raising the ques-tion if the quasi-static mapping of converging electric fields in the upward current region, does not hold in the way as proven here for the diverging electric fields. The typically larger scale size and less intense field magnitudes of the con-vergent structures may be one reason why such structures are less outstanding in the Cluster data.
There are many features and problems related to the na-ture of the acceleration strucna-tures that need to be further clar-ified and better understood in addition to the problems dis-cussed here. A complicated, but neverthess interesting, topic is the generator or generators, which drive the auroral cur-rent circuit and thus strongly influences how diffecur-rent circuit elements behave and impact on each other. In event 1, the downward FAC associated with the evolving structure varied in density and width but remained at roughly a constant mag-nitude throughout the crossings by the Cluster spacecraft. The electric field adjusted itself to the changing plasma den-sity conditions and increased as the plasma denden-sity and iono-spheric conductivity decreased. However, the threefold in-crease in the perpendicular potential was only partly related to the electric field intensification. Of equal importance was the widening of the structure.
For event 2, a decrease in the acceleration potential was observed in the upward current region some minutes prior to the encounter with a growing positive potential structure in the adjacent downward current region. The inverted
V-potential decrease was roughly equal to the subsequently
observed perpendicular potential increase. The
accelera-tion potentials in the two adjacent and oppositely directed FAC sheets thus varied over time such that their sum stayed roughly constant, indicating a strong coupling and possibly that a potential redistribution took place between the two cur-rent sheets. However, such a scenario can not be conclu-sively proven, considering the time delay of several minutes between the observations in the two regions, and the uncer-tainty regarding the FAC closure. From statistical studies of the return current electric field an inverse relationship be-tween the magnitude and width of structures was found, such that the most intense fields were associated with the smallest scale sizes and larger-scale fields were typically not so in-tense (Karlsson and Marklund, 1996; Marklund et al., 1997). The maximum perpendicular potentials associated with the return current structures seldom exceed 3 kV which agrees well with the maximum energies of upward electron beams (Cattell et al., 2004).
The results discussed here have demonstrated some spatial and temporal features of the small-scale return current struc-tures identified in the Cluster data. The continued study of the Cluster dataset with identification and analysis of more events, and statistical studies, provide a unique possibility to improve our understanding of the small-scale aurora and re-turn current phenomena in general, and of the acceleration and energy transfer processes in particular.
4 Summary
Observations from four Cluster encounters with auroral return current acceleration structures have been analysed thouroghly and compared with the purpose to identify both common and different features of such structures, and how these may be understood. The two selected events from 2001 were ideally suited for studying the temporal evolution of the structures, given the pearl-on-a-string configuration of the Cluster spacecraft close to perigee and the 100 s time lag be-tween consecutive crossings. The main results of this study are summarized below.
1. The return current electric field structures were charac-terized by (all values projected to the ionospheric level) typ-ical peak magnitudes of ≈1 V/m, perpendicular scale sizes of ≈10 km, occurrences at plasma boundaries associated with plasma density gradients, downward FACs peaking at
≈10 µA/m2, and upward fluxes of electrons with energies from a few 100 eV up to a few keV.
2. An evolution of a positive potential structure from less than 1 kV up to a few kV on some 100 seconds occured for events 1 and 2. For event 1, this evolution scenario was supported by an energy increase of the upflowing electrons consistent with the perpendicular potential growth. The few 100 s time scale is also typical for the formation of iono-spheric plasma cavities, connected to the potential structures and suggested to evolve hand-in-hand with these. These re-sults support the existence of quasi-static U-shaped positive
potential structures in the return current region, the exten-sion of such structures up to (and possibly beyond) Cluster altitudes, and an evolution scenario which is closely tied to the formation of ionospheric plasma cavities
3. For event 2, an energy decay of inverted-V ions was ob-served in the upward current region prior to the acceleration potential increase in the adjacent downward current region. The inverted-V potential decrease was roughly similar to the subsequent acceleration potential increase, such that the sum of the two adjacent acceleration potentials remained roughly at a constant value, suggesting that a potential redistribution took place between the two adjacent current branches. Such a scenario can, however, not be conclusively confirmed from the data, because of the time delay between the observations in the two regions and because of uncertainties regarding the FAC closure.
4. The maintenance of a constant FAC magnitude in one event, and of the sum of the acceleration potentials in an-other, over a few 100 s, represent features of the small-scale return current structures which are insufficient for reveal-ing how the circuit is driven (which requires knowledge of the impedance distribution in the full circuit). However, the results from the on-going Cluster auroral studies will con-tribute, together with results from other spacecraft covering other altitude regions of the current circuit, to improve our understanding of the small-scale aurora and return current phenomena, and of the acceleration and energy transfer pro-cesses associated with these.
5. The locations of the two bipolar events at the
CPS/PSBL boundary and of the two unipolar events at the polar cap boundary, suggest that the shape of the electric field profiles depend on whether plasma populations, dense enough to support upward field-aligned currents (by which the return current can close), exist on both sides, or on one side only, of the boundary.
6. Three regions of intense electric field variations, two spatial regions embedding one temporal region, were iden-tified by Karlsson et al. (2004) for event 4. The many sim-ilarities for the two spatial regions (unipolar electric fields, intense downward FACs and upward electron beams) and the large differences in the estimated sheet orientations (+45◦ and −45◦ relative to gm east), suggest that the two spatial regions correspond to different intersections of the poleward boundary of a surge, at its western and eastern flank, respec-tively. For an assumed westward surge propagation, with components normal to the western and eastern flank given by the cross-correlation, the surge velocity was estimated at 2 km/s in the ionosphere. Equatorward of this is a region dominated by less intense, time-varying electric and mag-netic fields of Alfv´enic nature, a common feature of the pole-ward part of the nightside active auroral oval.
Acknowledgements. The authors are grateful to the large number
of people who have contributed to the success of the Cluster project. We are indepted to G. Gustavsson who was the Principal Investigator for the Electric Field and Wave instrument until 2000. The Cluster project was supported by the European Space Agency and NASA and this study by the Swedish National Space Board.
Edited by: A. Chian Reviewed by: one referee
References
Andersson, L., Ergun, R. E., Main, D. et al.: Characteristics of Par-allel Electric Fields in the Downward Current Region of the Au-rora, Physics of Plasmas, 9, 3600, 2002.
Balogh, A., Dunlop, M. W., Cowley, S. W. H. et al.: The Cluster Magnetic Field Investigation, Space Sci. Rev., 79, 65–92, 1997. Carlson, C. W., McFadden, J. P., Ergun, R. E. et al.: FAST
observa-tions in the downward auroral current region: Energetic upgoing electron beams, parallel potential drops, and ion heating, Geo-phys. Res. Lett., 25, 2017–2024, 1998.
Cattell, C., Dombeck, J., Yusof, W., Carlson, C., and McFadden, J.: FAST observations of the solar illumination dependence of upflowing electron beams in the auroral zone, J. Geophys. Res., 109, A02209, 2004.
Chiu Y. T., Newman, A. L., and Cornwall, J. M.: On the structures and mapping of auroral electrostatic potentials, J. Geophys. Res., 86, 10 029–10 037, 1981.
Ergun, R. E., Carlson, C. W., McFadden, J. P. et al.: FAST satel-lite observations of electric field structures in the auroral zone, Geophys. Res. Lett., 25, 2025–2028, 1998.
Ergun, R. E., Su, Y. J., Andersson, L. et al.: Direct Observation of Localized Parallel Electric Fields in a Space Plasma, Phys. Rev. Lett., 87, 045003, 4, 2001.
Gustafsson, G., Bostiom, R., Holback, B. et al.: The Electric Field and Wave Experiment for the Cluster Mission, Space Sci. Rev., 79, 137–157, 1997.
Hultqvist, B.: Downward ion acceleration at auroral latitudes: Cause of parallel electric field, Ann. Geophysicae, 20, 1117– 1136, 2002.
Janhunen, P., Olsson, A., Mozer, F. S., and Laakso, H.: How does the U-shaped potential close above the acceleration region?, A study using Polar data, Ann. Geophysicae, 17, 1276–1293, 1999. Johansson, T., Figueiredo, S., Karlsson, T., Marklund, G. T., Faza-kerley, A., Buchert, S., Lindqvist, P.-A., and Nilsson, H.: In-tense High-Altitude Auroral Electric Fields – Temporal and Spa-tial Characteristics, Ann. Geophysicae, 22, 2485–2495, 2004. Johnstone, A. D., Alsep, C., Burge, S. et al.: PEACE: A Plasma
Electron and Current Experiment, Space Sci. Rev., 79, 351–398, 1997.
Karlsson, T. and Marklund, G. T.: A Statistical Study of Intense Low-Altitude Electric Fields Observed by Freja, Geophys. Res. Lett., 23, 1005–1008, 1996.
Karlsson, T. and Marklund, G. T.: Simulations of small-scale auro-ral current closure in the return current region, Physics of Space Plasmas, 15, 401–406, 1998.
Karlsson, T., Marklund, G. T., Figueiredo, S., Johansson, T., and Buchert, S.: Separating Spatial and Temporal Variations in Au-roral Electric and Magnetic Fields by Cluster Multipoint Mea-surements, Ann. Geophysicae, 22, 2463–2472, 2004.
Keiling, A., Wygant, J. R., Cattell, C. et al.: Properties of large
electric fields in the plasma sheet at 4–7 REmeasured with Polar,
J. Geophys. Res., 105, 5779–5798, 2001.
Marklund, G. T., Blomberg, L. G., F¨althammar, C.-G., and Lindqvist, P.-A.: On Intense Diverging Electric Fields Associ-ated with Black Aurora, Geophys. Res. Lett., 21, 1859–1862, 1994.
Marklund, G., Blomberg, L., F¨althammar, C.-G., Lindqvist, P.-A., and Eliasson, L.: On the Occurrence and Characteristics of In-tense Low-Altitude Electric Fields Observed by Freja, Ann. Geo-physicae, 13, 704–712, 1995.
Marklund, G., Karlsson, T., and Clemmons, J.: On Low-Altitude Particle Acceleration and Intense Electric Fields and their Rela-tionship to Black Aurora, J. Geophys. Res., 102, 17 509–17 522, 1997.
Marklund, G. T., Ivchenko, N., Karlsson, T., Fazakerley, A., Dun-lop, M., Lindqvist, P.-A., Buchert, S., Owen, C., Taylor, M., Vaivads, A., Carter, P., Andr´e, M., and Balogh, A.: Tempo-ral Evolution of the Electric Field Accelerating Electrons Away From the Auroral Ionosphere, Nature, 414, 724–727, 2001. Reme, H., Bosqued, J. M., Sauvaud, J. A. et al.: The Cluster Ion