HAL Id: hal-00298789
https://hal.archives-ouvertes.fr/hal-00298789
Submitted on 30 Nov 2005HAL is a multi-disciplinary open access
archive for the deposit and dissemination of sci-entific research documents, whether they are pub-lished or not. The documents may come from teaching and research institutions in France or abroad, or from public or private research centers.
L’archive ouverte pluridisciplinaire HAL, est destinée au dépôt et à la diffusion de documents scientifiques de niveau recherche, publiés ou non, émanant des établissements d’enseignement et de recherche français ou étrangers, des laboratoires publics ou privés.
Model-based analysis of nutrient retention and
management for a lowland river
D. Kneis, R. Knoesche, A. Bronstert
To cite this version:
D. Kneis, R. Knoesche, A. Bronstert. Model-based analysis of nutrient retention and management for a lowland river. Hydrology and Earth System Sciences Discussions, European Geosciences Union, 2005, 2 (6), pp.2549-2579. �hal-00298789�
HESSD
2, 2549–2579, 2005 Analysis of nutrient retention and management for a lowland river D. Kneis et al. Title Page Abstract Introduction Conclusions References Tables Figures J I J I Back CloseFull Screen / Esc
Print Version
Interactive Discussion
EGU
Hydrol. Earth Syst. Sci. Discuss., 2, 2549–2579, 2005 www.copernicus.org/EGU/hess/hessd/2/2549/
SRef-ID: 1812-2116/hessd/2005-2-2549 European Geosciences Union
Hydrology and Earth System Sciences Discussions
Papers published in Hydrology and Earth System Sciences Discussions are under open-access review for the journal Hydrology and Earth System Sciences
Model-based analysis of nutrient retention
and management for a lowland river
D. Kneis1, R. Knoesche2, and A. Bronstert1
1
Institute of Geoecology, Potsdam University, Germany
2
Institute of Biology and Biochemistry, Potsdam University, Germany
Received: 19 September 2005 – Accepted: 10 October 2005 – Published: 30 November 2005 Correspondence to: D. Kneis ([email protected])
HESSD
2, 2549–2579, 2005 Analysis of nutrient retention and management for a lowland river D. Kneis et al. Title Page Abstract Introduction Conclusions References Tables Figures J I J I Back CloseFull Screen / Esc
Print Version
Interactive Discussion
EGU
Abstract
In the context of the European Water Framework Directive options for improving the wa-ter quality of the lowland river Havel (Germany) were assessed. The lower section of this river is actually a polytrophic river-lake system suffering from high external nutrient loading and exhibiting significant in-river turnover. In order to gain a better
understand-5
ing of present conditions and to allow integrated scenarios of nutrient management to be evaluated the catchment models SWIM and ArcEGMO-Urban were coupled with a simple, newly developed nutrient TRAnsport Model (TraM). Using the TraM model, the retention of nitrogen and phosphorus in a 55 km reach of the Lower Havel River was quantified and its temporal variation was analyzed. It was examined that about 30%
10
of the external nitrogen input to the Lower Havel is retained within the surveyed river section. A comparison of simulation results generated with and without consideration of phosphorus retention/release revealed that summer TP concentrations are currently increased by 100–200% due to internal loading. Net phosphorus release rates of about 20 mg P m−2d−1 in late summer were estimated for the Havel lakes. Scenario
simula-15
tions with lowered external nutrient inputs revealed that persistent phosphorus limita-tion of primary produclimita-tion cannot be established within the next decade. It was shown that a further reduction in nitrogen concentrations requires emissions to be reduced in all inflows. Though the TraM model needs further extension it proved to be appropriate for conducting integrated catchment and river modeling.
20
1. Introduction
In many river basins eutrophication appears to be one of the most important water quality problems. In search of adequate restoration strategies eco-hydrological models are frequently used to assess the impact of landuse management on nutrient emis-sions from river basins (e.g.Schreiber et al.,2005;Kronvang et al.,1999). However,
25
HESSD
2, 2549–2579, 2005 Analysis of nutrient retention and management for a lowland river D. Kneis et al. Title Page Abstract Introduction Conclusions References Tables Figures J I J I Back CloseFull Screen / Esc
Print Version
Interactive Discussion
EGU
is especially true for regulated rivers and river-lake systems, which exhibit a unique behavior with respect to nutrient retention. Since the European Water Framework Di-rective (WFD) focuses on the ecological status of individual river sections and lakes, there is an increasing need for linking catchment models to water quality models of adequate space-time resolution and complexity (Van Griensven and Bauwens,2003).
5
Within a study on the water quality of the Havel River (NE-Germany) a conceptual nutrient TRAnsport Model (TraM) adapted to lowland rivers was developed. It provides a suitable method to integrate the output of catchment models into a simple transport scheme and enables in-river concentrations of total phosphorus (TP) and total nitro-gen (TN) to be estimated. The model was applied to the Havel River downstream of
10
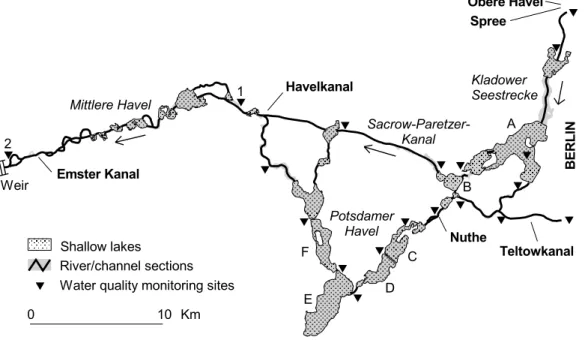
Berlin (Fig. 1) with two goals in mind: First, the relevance and seasonality of nutri-ent retnutri-ention had to be figured out quantitatively by evaluating data from official water quality monitoring programs. Secondly, the impact of different strategies of catchment management on total nutrient concentrations of the river was assessed.
The studied river section is characterized by a large number of interconnected lakes
15
and is regulated by weirs. Since external nutrient input is significant, the Lower Havel River is strongly eutrophic and in-river turnover of nitrogen and phosphorus was ex-pected to be extraordinarily high. Although nutrient loading decreased in the 1990s, phosphorus concentrations remained high, because a large P-pool has accumulated in the lakes’ sediment over the last decades. Today the lakes act as net sources of P
20
as it is typical after reduction of nutrient loads in the inflow (Søndergaard et al.,2003;
Kozerski and Kleeberg,1998;Jeppesen et al.,1991).
This paper introduces the basic concept of the nutrient transport model TraM and its application within a catchment modeling framework. A special focus is put on the estimation of N and P retention with high temporal resolution and its representation in
25
the model. Selected results of scenario analyses carried out with TraM are presented and discussed in the context of water quality management.
HESSD
2, 2549–2579, 2005 Analysis of nutrient retention and management for a lowland river D. Kneis et al. Title Page Abstract Introduction Conclusions References Tables Figures J I J I Back CloseFull Screen / Esc
Print Version
Interactive Discussion
EGU
2. Methods
2.1. The transport model TraM
In the TraM model water bodies can be represented by two basic concepts commonly used in water quality modeling (Chapra,1997): River reaches where advective trans-port is dominant are represented by plug-flow reactors (PFR) whereas the shallow well
5
mixed lakes shown in Fig.1are approximated by continuous flow stirred tank reactors (CFSTR). Table1 summarizes the features of both types of reactors as implemented in the TraM model.
The first step in setting up the model is to subdivide the river system into a number of PFR and CFSTR. Longer river reaches are further discretized into separate PFR since
10
every reactor is parametrized by a single average cross-section. As the water surface slope of impounded lowland rivers is usually no more than a few cm/km a single stage hydrograph is assigned to every PFR. The length of a plug flow reactor usually falls in the range from less than 100 to several hundred meters. The system shown in Fig.1was split into 88 reactors. To form a network with defined upstream-downstream
15
relations suitable for routing calculations, all CFSTR and PFR are linked automatically based on GIS data.
At runtime, the load hydrograph at the downstream end of a reactor is computed using the static and dynamic input data listed in Table1. Within a complete model run, the computation is carried out for each single reactor and advances from the upstream
20
end(s) of the river network to the downstream model boundary. In the current version of TraM only a single substance can be simulated at a time and retention is described according to zero or first order kinetics (see Sect.2.3).
2.2. Linking river transport, hydrodynamic and catchment models
As depicted in the lower part of Table1 hydrological time series as well as data on
25
dis-HESSD
2, 2549–2579, 2005 Analysis of nutrient retention and management for a lowland river D. Kneis et al. Title Page Abstract Introduction Conclusions References Tables Figures J I J I Back CloseFull Screen / Esc
Print Version
Interactive Discussion
EGU
charge and concentration hydrographs were provided by the Brandenburg state water authorities. However, in case of scenario analyses all boundary conditions must be simulated as well. In this study, nutrient loads and discharges that enter the system shown in Fig.1were calculated by a catchment modeling work group using the mod-els SWIM (Krysanova et al.,2000) and ArcEGMO-Urban (Biegel et al.,2004). SWIM
5
computes the discharge of tributaries and the corresponding P and N loads result-ing from non-point emissions. In contrast, the Urban module of ArcEGMO estimates N and P losses from point sources only. Discharge and nutrient loads of the tributary Spree were approximated based on observed flow and concentration data also for sce-nario simulations. The internal flow distribution as well as stage hydrographs for the
10
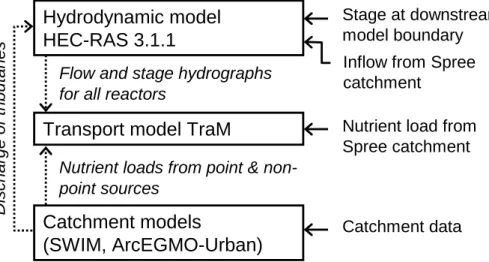
investigated river section were simulated with the unsteady 1D hydrodynamic model HEC-RAS (USACE, 2002). It proved to be particularly suitable because it handles looped river networks and supports the input of geometric data via GIS. The HEC-RAS data base for the system shown in Fig.1comprises about 1100 cross-sections and 27 junctions. The interaction between the applied models is illustrated in Fig.2.
15
2.3. Estimation of nutrient retention
Water quality is monitored biweekly by the authorities at many stations along the Lower Havel River (Fig.1). To assess nutrient retention, data from the period 1991–2004 were used. Since this study focused on total nitrogen and total phosphorus no differentiation into distinct N or P species was made. Nitrogen losses are mainly caused by
den-20
itrification and sedimentation (Jensen et al., 1992b; Seitzinger, 1988). Both, nitrate reduction (Chapra,1997) and settling of particulate N (Scheffer,1998) are dependent on the respective concentrations. SinceJensen et al.(1992b) found denitrification in lakes to be closer related to TN concentrations (CTN) rather than to NO−3, a lumped first order term was tested for the description of total nitrogen retention (Eq.1).
25
−d CTN
HESSD
2, 2549–2579, 2005 Analysis of nutrient retention and management for a lowland river D. Kneis et al. Title Page Abstract Introduction Conclusions References Tables Figures J I J I Back CloseFull Screen / Esc
Print Version
Interactive Discussion
EGU
Initial estimates of the loss rate kTN (d−1) for all major lakes were deduced from Eq. (2).
kTN= Q V ∗
(CTN,obs− CTN,sim)
CTN,sim (2)
CTN,obs is the observed concentration (mg l−1) at the lake outlet and CTN,sim is the corresponding concentration that can be calculated from the TN load in the inflow
treat-5
ing the lake as a conservative CFSTR. Q is the flow rate (m3 d−1) and V (m3) is the lake volume. For the river reach between the monitoring stations 1 and 2 (Fig.1) kTN could be estimated from the ratio of total nitrogen concentration (CTN) at these stations using the corresponding mean travel time Tm (d). The calculation is based on Eq. (3) which can easily be derived from Eq. (1).
10 kTN= 1 Tm ∗ l n CTN,upstream CTN,downstream ! (3)
Tm was determined for a range of steady flows by simulating the propagation of ar-tificial load pulses. Monthly values of kTN were estimated according to Eq. (3) using MQmonth in the calculation of the mean travel time Tm. Monthly median values of the concentration ratio were used to account for outliers in the TN data. The estimates of
15
kTN obtained by the above methods were further refined in manual model calibration. The objective was to achieve best agreement of observed and simulated monthly me-dian TN concentrations at 12 monitoring stations shown in Fig.1. One set of monthly kTNvalues was calibrated for each lake or river reach between neighboring monitoring stations, respectively.
20
The seasonal dynamics of phosphorus retention rTP was obtained from mass bal-ances for the five largest lakes over the years 1995–2000. rTP was calculated similarly to kTN by relating the observed phosphorus load at the lake outlet (LTP,obs) to values that could be expected due to the P load in the lake’s inflow (LTP,sim), assuming the
HESSD
2, 2549–2579, 2005 Analysis of nutrient retention and management for a lowland river D. Kneis et al. Title Page Abstract Introduction Conclusions References Tables Figures J I J I Back CloseFull Screen / Esc
Print Version
Interactive Discussion
EGU
lake to be a conservative CFSTR. The difference (LTP,obs−LTP,sim) was divided by the lake’s surface area to yield values of rTP in (mg P m−2 d−1). Negative values of rTP indicate P retention whereas in times of net phosphorus release rTP becomes greater than zero. Phosphorus retention in river and channel sections was neglected in this study, because the sediment surface area is small and residence time is short
com-5
pared to that of the lakes. Also, it is known from on site inspection that P enriched organic sediments rarely exist in the river and channel sections.
3. Results and discussion
3.1. Significance of phosphorus retention and release
The seasonal dynamics of phosphorus retention as it was calculated from mass
bal-10
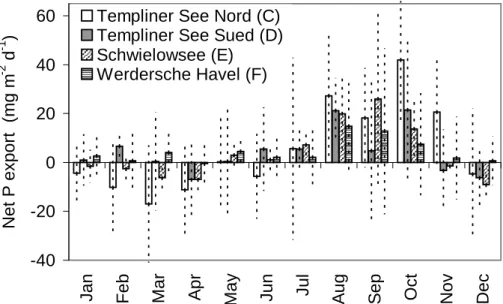
ances (see Sect.2.3) is shown in Fig.3. A phenomenon observed in all investigated lakes is a period of net phosphorus export from July–November with maximum net re-lease rates from August–October. In winter and spring the settling of particulate phos-phorus balances the phosphos-phorus release from the sediment or even results in slight net retention. Analogous seasonal patterns were identified for a river-lake system in the
15
nearby Nieplitz catchment. The net release rates shown in Fig.3 result in a massive increase of pelagic P concentrations during summer. Phosphorus limitation of primary production does not occur under these conditions.
Reliable predictions of future phosphorus concentrations require the lakes’ sedi-ments to be included in TraM as an additional model compartment. This is necessary
20
as in the long term the P pool in the sediment will decrease due to continued net phos-phorus export (Fig.3) and thus P release will do. Although corresponding models have been developed in the past (e.g. Van der Molen, 1991) the establishment of trans-ferable relations between sediment characteristics (including P content) and internal loading is still a major challenge of limnological research (Søndergaard et al.,2003).
25
HESSD
2, 2549–2579, 2005 Analysis of nutrient retention and management for a lowland river D. Kneis et al. Title Page Abstract Introduction Conclusions References Tables Figures J I J I Back CloseFull Screen / Esc
Print Version
Interactive Discussion
EGU
lakes was beyond the scope of this study.
However, since scenario simulations for the time period 2003–2015 were requested, reasonable assumptions on future P release had to be made. Therefore, annual net phosphorus export rates from the Havel lakes were related to the amount of inorganic bound P stored in the upper 30 cm sediment layer. This layer seems to be relevant for
5
P export, because upward diffusion of phosphate in the sediment pore water reaches down to a maximum depth of about 30 cm according to SRP profiles (Schettler,1995). The sediment P and Fe contents were estimated from core samples collected in sum-mer 2004. Balance calculations revealed that several decades of continued net P export will be necessary to cause a decrease in the sediment P/Fe ratio to a value
10
of about 0.12 (atomic ratio). The latter ratio is of special relevance since iron hydrox-ides very effectively adsorb phophorus especially under oxic conditions, making the P/Fe ratio an indicator for P release potential of the sediment. Jensen et al. (1992a)
andMaassen et al.(2005) found that sediments with P/Fe ratios below 0.16–0.12 show
significantly decreased phosphorus remobilisation. In addition one has to consider that
15
in connected river-lake systems the phosphorus exported from one location will partly settle in lakes further downstream causing a delay in “self-purification”. Consequently, all scenario simulations discussed in Sect. 3.4 were carried out on the assumption that phosphorus release rates shown in Fig.3remain unchanged until 2015 (see also Sect.3.3).
20
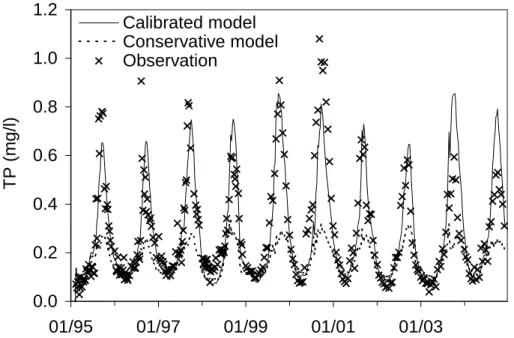
In Fig. 4simulated concentrations of TP at the monitoring station Ketzin (label 1 in Fig. 1) are plotted against biweekly observations. As expected, the goodness of the model prediction (solid graph in Fig.4) varies from year to year due to the use of av-erage P retention rates (see Table3). Actually, the seasonal succession of plankton shows significant variability and certain groups of algae make different proportions of
25
phytoplankton biomass every year. E.g. one could expect net P release rates above av-erage when algae with low settling losses become dominant because less particulate P is retained. This mechanism might be an explanation for the heavy underestima-tion of P concentraunderestima-tions by the model in summer 2000 (see Fig.4) as the biomass of
HESSD
2, 2549–2579, 2005 Analysis of nutrient retention and management for a lowland river D. Kneis et al. Title Page Abstract Introduction Conclusions References Tables Figures J I J I Back CloseFull Screen / Esc
Print Version
Interactive Discussion
EGU
cyanobacteria was extraordinarily high in this year according to official monitoring data. However, the effect of sedimentation on net P export is ambiguous, since a high settling rate may increase P retention on the one hand but it may favor the release of redox-sensitive bound P on the other hand by stimulating mineralization. In addition, short periods of temporary stratification may occur in some years. These events can hardly
5
be predicted but may be of relevance for the redox conditions at the water-sediment in-terface and thus for P release (Welch and Cooke,2005;Kleeberg and Kozerski,1997). Against this background, it seems too early to speculate on the strong overestima-tion of P concentraoverestima-tions in summer 2003 and 2004 by the model (Fig. 4). The next years will prove, if this can be attributed to interannual variability or whether the
the-10
sis (see above), according to which the effects of todays net P export will not become perceptible before decades, needs correction.
As can been seen in Fig.4the conservative model which neglects phosphorus re-tention (dashed graph) and the calibrated model produce similar results in winter and spring, indicating that P concentrations are almost completely attributed to external
15
loads during these seasons. But from July onwards, the model results heavily diverge and it can be stated that internal loading increases summer TP concentrations by a factor of 2–3 compared to a situation without net phosphorus release from sediments. 3.2. Significance of Nitrogen Retention
Since the underlying processes of nitrogen losses were not differentiated, the
cali-20
brated values of the retention parameter kTN(Eq.1) reflect the effects of both denitrifi-cation and N sedimentation. As shown in Fig.5nitrogen retention is low in winter with kTN in the range 0–0.02 (d−1). In summer N losses range from 0.005–0.03 (d−1) in most sections of the river-lake network. Maximum values of about 0.04 (d−1) indicate that up to 4% of total nitrogen may be eliminated in one day. The absolute values of N
25
retention (Table2) are of the same magnitude as those reported from shallow Danish lakes (Windolf et al.,1996).
reten-HESSD
2, 2549–2579, 2005 Analysis of nutrient retention and management for a lowland river D. Kneis et al. Title Page Abstract Introduction Conclusions References Tables Figures J I J I Back CloseFull Screen / Esc
Print Version
Interactive Discussion
EGU
tion between water bodies in terms of kTN. A satisfying explanation of the observed patterns would require more detailed investigations that do not focus on total nitrogen alone but include all relevant N species. However, some first hypothesis shall be given here:
One obvious feature emerging in lakes B, C, E, and F is that highest nitrogen losses
5
occur already in spring, long before water temperature or plankton biomass reach their maximum values. Possibly, this could be explained by the dominance of diatoms in spring and early summer. Due to the silica shells this group of algae suffers from higher sinking losses compared with other phytoplankton. Thus, diatom blooms should result in enhanced sedimentation of N. Furthermore, nitrification, the crucial step prior
10
to denitrification, may be enhanced in spring due to deeper penetration of oxygen into the sediment. Another phenomenon observed in these lakes is a depression in kT N values in late summer (Fig.5), which possibly can be attributed to nitrogen fixation by blue-green algae. As detailed species information are unavailable, this can hardly be proven by monitoring data. However, data show that the maximum of cyanobacteria
15
biomass usually occurs in the relevant time. Taking into account the very low nitrogen to phosphorus ratios at many of the monitoring stations (TN/TP <5 from August–October, DIN/SRP <1 in August and September) the occurence of nitrogen fixing blue-green algae seems likely (see Windolf et al., 1996, for a discussion). As mentioned in the context of P retention, low settling rates could alternatively be responsible for a
de-20
crease in N retention.
In case of the Teltowkanal, the low seasonal variation in kTN probably results from a steady supply of nitrate (about 80% of TN) by several large wastewater treatment plants accompanied by increased water temperatures in winter.
Beyond doubt, further investigation is needed to explain the spatial and temporal
25
differences in N retention, e.g. the extraordinarily high values of kTN in some of the lakes (Fig. 5). Shortcomings in the model boundary conditions as well as errors in the simulation of flow distribution must also be considered since both may result in misleading estimates of retention parameters. Furthermore, the approximation of TN
HESSD
2, 2549–2579, 2005 Analysis of nutrient retention and management for a lowland river D. Kneis et al. Title Page Abstract Introduction Conclusions References Tables Figures J I J I Back CloseFull Screen / Esc
Print Version
Interactive Discussion
EGU
retention as a first order process may turn out to be too simple when DIN/TN ratios vary largely.
A simple way to figure out nitrogen retention quantitatively is to compare cumulated N loads calculated by the calibrated TraM model with cumulated N loads from a con-servative model run (Fig.6). The latter simulation delivers nitrogen loads at a gage
5
that would occur if N retention was negligible. As can be deduced from Fig. 6about 30% of the total nitrogen which is discharged into the studied river section via its trib-utaries is retained. This results in a significant reduction of N export to downstream waters. Compared to estimated in-stream nitrogen retention in a Danish lowland river
(Svendsen et al.,1998) nitrogen losses in the Havel River are remarkably high. Since
10
denitrification is most effective at the sediment-water interface (Seitzinger,1988), this might be explained to a substantial extend by the large surface area of the Havel Lakes (see alsoBehrendt and Opitz,2000). Figure 6 illustrates that the deviation between model simulation and observation is rather small when looking at cumulated TN loads. However, as Table3indicates the temporal variability in TN concentrations is replicated
15
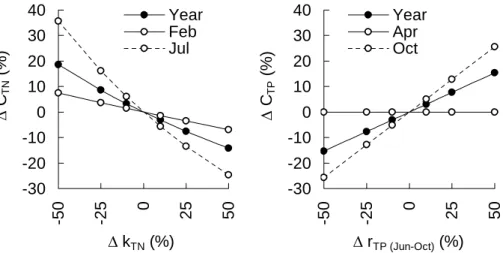
by the model much less accurately. 3.3. Analysis of parameter sensitivity
As Figs. 3 and 5 indicate, the nitrogen retention parameter kTN as well as the net phosphorus retention rate rTP are subject to large spatial and interannual variation. The average parameter values used in model simulations are therefore associated
20
with potentially high uncertainty. Thus, the sensitivity of simulation results to changes in parameter values was tested (Fig.7). In case of kTNthe values found in calibration for each river section (Fig.5) were varied by ±10, 25 and 50%, respectively. The values of rTP were altered in the same range but only the months June–October with net P release (rTP>0) were included.
25
As Fig. 7 shows, TN concentrations in summer are much more susceptible to er-rors in the retention parameter kTN than winter concentrations. Multiplying kTN by a scaling factor of 0.5 results in an increase in the monthly average TN concentration
HESSD
2, 2549–2579, 2005 Analysis of nutrient retention and management for a lowland river D. Kneis et al. Title Page Abstract Introduction Conclusions References Tables Figures J I J I Back CloseFull Screen / Esc
Print Version
Interactive Discussion
EGU
by about 36% in July but only 8% in February. Scaling factors of 1.1, 1.25 and 1.5 (retention enhanced by 10–50%) result in decreasing TN concentrations. Again the changes are more pronounced in the month with the lowest TN concentration (July) than in the month with highest CTN(February). The outcome of the analysis can easily be interpreted: as expected, percental changes in the retention parameter show the
5
largest effect when kTN is high. Winter concentrations are less affected since nitrogen retention is low and CTN is largely controlled by external loads. When looking at aver-age TN concentations over the whole year the model seems robust since errors in kTN must exceed 50% before CTN changes by more than 20%.
For phosphorus (right graph in Fig. 7) results of the sensitivity analysis are again
10
presented for the month with lowest (April) and highest (October) TP concentrations CTP. Obviously, changes in phosphorus release rates in the period June–October do not have any effect on CTP in April, indicating that P enriched lake water is completely flushed in winter at higher discharges. As expected CTP shows a strong reaction to altered values of rTPin October, since concentrations are heavily controlled by internal
15
loading in late summer and autumn (see Sect.3.1). Annual averages of CTP are less susceptible to errors in rTP estimates. Even a ∆rTP of ±50% results in average TP concentrations changed by not more than 15%.
3.4. The impact of reduced phosphorus emissions
Two selected scenarios of phosphorus control measures are presented here. In the first
20
scenario (“P1”) it was assumed that phosphorus emissions from point sources were di-minished all over the Havel basin except for the subbasin of the tributary Spree, which was not in the focus of this study (Table4). The reduction in P emissions from wastew-ater treatment plants was quantified by the use of the ArcEGMO-Urban model (Biegel
et al.,2004) taking into account possible enhancements in P elimination. The second
25
scenario (“P2”) includes scenario P1 but comes with the additional assumption that the average TP load emitted from the Spree catchment is reduced by approximately 50% to reach a concentration level of about 80 µg l−1. That is, the load reduction in the
HESSD
2, 2549–2579, 2005 Analysis of nutrient retention and management for a lowland river D. Kneis et al. Title Page Abstract Introduction Conclusions References Tables Figures J I J I Back CloseFull Screen / Esc
Print Version
Interactive Discussion
EGU
Spree River was chosen to meet a certain target concentration (immission approach) as defined by a wastewater management plan (SSB,2001). The base scenario with unchanged P emissions was called “P0”.
The relative effects of the pollution control measures are presented in Table4. As indicated by the average emissions (g s−1) for the base scenario P0, the Spree
catch-5
ment alone contributes over 50% of the total P input to the Lower Havel River. Con-sequently, the reduction of P emissions from all other subcatchments by about 13% (scenario P1) has only little effect on the total P input (−5.2%). On the other hand, a 50% decrease in P loads of the Spree River and its side branch, the Teltowkanal, results in a significant change in total P input (−35.2%). The alteration of the average
10
TP concentration of the Havel River turns out to be much lower than the change in average total emissions. This can directly be attributed to net phosphorus release from the lakes’ sediments, which (see Sect.3.1) was assumed to be unaffected by altered external P loading.
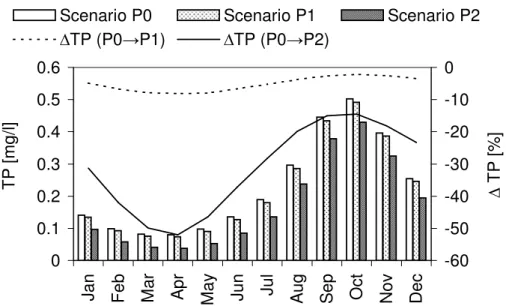
Whereas Table4only shows long term average concentrations, the effect of reduced
15
P emissions on the concentrations’ seasonality is pointed out in Fig.8. The absolute decrease in mg l−1 is similar for all month. The relative rates of change (∆ TP (%)) however show substantial intraannual differences, since absolute concentrations also vary significantly due to internal loading and the natural flow regime of the Havel River. Whereas scenario P2 causes a reduction in TP concentration of up to 50% in spring
20
the corresponding value for August–November is only 20% or less.
The consequences for water quality management are obvious: The TP concentra-tion in late summer and autumn cannot be reduced to a level that results in phosphorus limitation of the phytoplankton, even if drastic pollution control measures would be im-plemented (see Sas, 1989, for a pragmatic definition of limiting concentrations). In
25
contrast, concentrations in spring are more sensitive to decreased external phospho-rus loading. As Fig.8 illustrates, TP falls below 40 µg l−1 in April under scenario P2. Considering a TP/SRP ratio of about 0.3 in spring (data from lake E; see Fig.1) dis-solved phosphorus concentrations are dropped to a level where algal blooms might
HESSD
2, 2549–2579, 2005 Analysis of nutrient retention and management for a lowland river D. Kneis et al. Title Page Abstract Introduction Conclusions References Tables Figures J I J I Back CloseFull Screen / Esc
Print Version
Interactive Discussion
EGU
possibly be prevented by P limitation. As studies from the nearby M ¨uggelsee (Spree catchment) by K ¨ohler et al. (2000) suggest, initial nutrient concentrations control al-gal growth not only in spring but may also influence the succession of plankton over the whole year. Hence, a further reduction of external P load might be effective for eutrophication control in spite of persistent sediment P release.
5
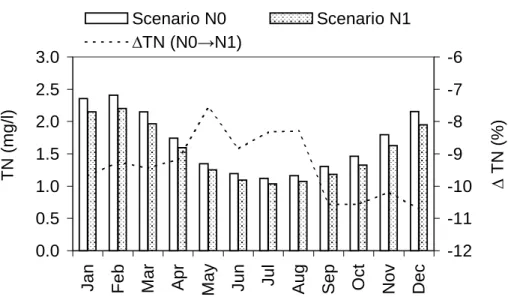
3.5. The effect of reduced nitrogen emissions
As with phosphorus, different cases of reduced nitrogen emissions were analyzed with the TraM model but only a single scenario will be discussed here. In this scenario (“N1”) it was assumed that non-point nitrogen emissions were reduced all over the Havel basin, again excluding the Spree subbasin. For this, landuse maps of present
10
conditions (scenario “N0”) were modified (Jacobs and Jessel, 2003), e.g. portions of arable land were converted to grassland and another portion was set aside. In addition, the growing of intercrops was considered in scenario N1 in order to minimize N losses. The change in N export from the catchment was calculated at the Potsdam Institute for Climate Impact Research using the SWIM model. Though TN loads from all considered
15
subbasins were reduced by about 29% on average, the TN concentration of the Havel River decreases only slightly (Fig.9). This emphasizes the outstanding impact of nitro-gen loads emitted from the Spree catchment, which were not altered in scenario N1. That is, a significant reduction in average TN concentrations of the Lower Havel River would require massive emission control measures to be taken in the Spree catchment
20
which comprises a number of large point sources. However, the effect of reduced N input on primary production is hard to predict: Summer DIN concentrations temporarily fall below 0.1 mg l−1 already under present conditions. It is uncertain whether a fur-ther decrease could induce prolonged N limitation or just favors N-fixing cyanobacteria as long as P concentrations are high. Another point in the discussion on reduced N
25
emission are the costs, because it is expensive to upgrade N elimination in wastewater treatment whereas retention in the river system (see Sect.3.2) is “for free”.
HESSD
2, 2549–2579, 2005 Analysis of nutrient retention and management for a lowland river D. Kneis et al. Title Page Abstract Introduction Conclusions References Tables Figures J I J I Back CloseFull Screen / Esc
Print Version
Interactive Discussion
EGU
4. Conclusions
By means of the simple nutrient transport model TraM it was shown that in-river turnover significantly influences total nutrient concentrations of the lowland river Havel. Hence, the quantification of nitrogen and phosphorus retention rates turned out to be essen-tial not only for understanding the present state of water quality but also for
evaluat-5
ing possible strategies of river basin management. The TraM model, adapted to the characteristics of the Havel River, proved to be a useful and necessary extension to mesoscale catchment models. As TraM uses empirical rates to account for N and P retention, the applicability of the current model version is limited. Distinct changes in natural boundary conditions or management practice might render empirical coe
ffi-10
cients examined by calibration invalid. Therefore, more complex models, which take into account all relevant species and reaction terms of the N and P cycle seem de-sirable. However, one must keep in mind the large number of parameters introduced by those models. Many of them are well defined in theory but hard to measure in the field and they are therefore prone to uncertainty. Effective settling velocities and the
15
parameters involved in sediment phosphorus release are just two common examples, not to mention the problem of spatial heterogeneity. We think the approach taken in this study is a reasonable compromise, suitable for pointing out options and limits of nutrient concentration management. The next version of the TraM model will overcome some of its actual deficiencies. That is, a sediment compartment will be implemented
20
to force closed mass balances (Reichert et al.,2001) and a generic reaction module is currently tested, which allows very simple to rather sophisticated kinetic models to be created by the user. In our opinion robust water quality models of adaptable complex-ity are needed to better integrate both, catchment nutrient dynamics and in-river/lake turnover into a modeling framework applicable in the context of the WFD.
25
Acknowledgements. We thank the federal and state water authorities (BfG, LUA and WSA Brandenburg) for access to water quality monitoring data and hydrological time series. We acknowledge the work of the “catchment modeling group”, namely M. Biegel, T. Gr ¨aff, and
HESSD
2, 2549–2579, 2005 Analysis of nutrient retention and management for a lowland river D. Kneis et al. Title Page Abstract Introduction Conclusions References Tables Figures J I J I Back CloseFull Screen / Esc
Print Version
Interactive Discussion
EGU
A. Habeck, who ran the SWIM and ArcEGMO-Urban simulations and supplied lots of input data for the TraM model. We thank J. Jacobs, R. Thiel, and W. Wendler who finally established the set of management scenarios. This study was funded by the German Federal Ministry of Education and Research.
References
5
Behrendt, H. and Opitz, D.: Retention of nutrients in river systems: Dependence on specific runoff and hydraulic load, Hydrobiologia, 410, 111–122, 2000. 2559
Biegel, M., Schanze, J., and Krebs, P.: ArcEGMO-URBAN Urban water Modelling on the River Basin Scale, in: Proceedings of the 6th international Conference on Urban Drainage Mod-elling, Dresden, Germany, 15–17 September 2004, 543–550,http://urban.arcegmo.de/pdf/
10
UDM04 Biegel.pdf, 2004. 2553,2560
Chapra, S. C.: Surface water quality modeling, McGraw-Hill, 1997. 2552,2553
Jacobs, J. and Jessel, B.: Design of landuse scenarios for river basin management (in Ger-man), UVP-Report 3+4, UVP-Gesellschaft e.V., 117–121, 2003. 2562
Jensen, H. S., Kristensen, P., Jeppesen, E., and Skytthe, A.: Iron:phosphorus ratio in surface
15
sediment as an indicator of phosphate release from aerobic sediments in shallow lakes, Hydrobiologia, 235/236, 731–743, 1992a. 2556
Jensen, J. P., Jeppesen, E., Kristensen, P., Christensen, P. B., and Søndergaard, M.: Nitrogen loss and denitrification as studied in relation to reductions in nitrogen loading in a shallow hypertrophic lake, Int. Revue ges. Hydrobiol., 77, 29–42, 1992b. 2553
20
Jeppesen, E., Kristensen, P., Jensen, J. P., Søndergaard, M., Mortensen, E., and Lauridsen, T.: Recovery resilience following a reduction in external phosphorus loading of shallow eutrophic Danish lakes: Duration, regulating factors and methods for overcoming resilience, Mem. Ist. ital. Idrobiol., 48, 127–148, 1991. 2551
Kleeberg, A. and Kozerski, H. P.: Phosphorus release in lake Grosser M ¨uggelsee and its
impli-25
cations for lake restoration, Hydrobiologia, 342, 9–26, 1997. 2557
K ¨ohler, J., Behrendt, H., and Hoeg, S.: Long-term response of phytoplankton to reduced nutri-ent load in the flushed Lake M ¨uggelsee (Spree system, Germany), Archiv f ¨ur Hydrobiologie, 148, 209–229, 2000. 2562
Kozerski, H. P. and Kleeberg, A.: The sediments and benthic-pelagic exchange in the shallow
HESSD
2, 2549–2579, 2005 Analysis of nutrient retention and management for a lowland river D. Kneis et al. Title Page Abstract Introduction Conclusions References Tables Figures J I J I Back CloseFull Screen / Esc
Print Version
Interactive Discussion
EGU
lake M ¨uggelsee (Berlin, Germany), International Review of Hydrobiology, 83, 77–112, 1998. 2551
Kronvang, B., Svendsen, L. M., Jensen, J. P., and Dorge, J.: Scenario analysis of nutrient management at the river basin scale, Hydrobiologia, 410, 207–212, 1999. 2550
Krysanova, V., Wechsung, F., Arnold, J., Srinivasan, R., and Williams, J.: SWIM (Soil and
5
Water Integrated Model), User manual, PIK Report No. 69, Potsdam Institute for Climate Im-pact Research,http://www.pik-potsdam.de/pik web/publications/pik reports/reports/reports/ pr.69/pr69.pdf, 2000. 2553
Maassen, S., Uhlmann, D., and R ¨oske, I.: Sediment and pore water composition as a basis for the trophic evaluation of standing waters, Hydrobiologia, 543, 55–70, 2005. 2556
10
Reichert, P., Borchardt, D., Henze, M., Rauch, W., Shanahan, P., Somlyody, L., and Vanrol-leghem, P. A.: River water quality model No. 1, IWA Publishing, 2001. 2563
Sas, H., ed.: Lake restoration by reduction of nutrient loading: Expectations, experiences, extrapolations, Academia Verlag, 1989. 2561
Scheffer, M.: Ecology of shallow lakes, Chapman & Hall, 1 edn., 1998. 2553
15
Schettler, G.: The sediments of the Havel Lakes and their seasonal dynamics (in German), Studien und Tagungsberichte, Landesumweltamt Brandenburg, 8, 46–57, 1995. 2556 Schreiber, H., Behrendt, H., Constantinescu, L. T., Cvitanic, I., Drumea, D., Jabucar, D.,
Ju-ran, S., Pataki, B., Snishko, S., and Zessner, M.: Nutrient emissions from diffuse and point sources into the River Danube and its main tributaries for the period of 1998–2000: Results
20
and problems, Water Science and Technology, 51, 283–290, 2005. 2550
Seitzinger, S. P.: Denitrification in freshwater and coastal marine ecosystems: Ecological and geochemical significance, Limnol. Ocenaogr., 33, 702–724, 1988. 2553,2559
Søndergaard, M., Jensen, J. P., and Jeppesen, E.: Role of sediment and internal loading of phosphorus in shallow lakes, Hydrobiologia, 506, 135–145, 2003. 2551,2555
25
SSB: Abwasserbeseitigungsplan Berlin (Wastewater management plan for the city of Berlin, in German), Tech. rep., Senatsverwaltung f ¨ur Stadtentwicklung Berlin, 2001. 2561
Svendsen, L. M., Kronvang, B. K., Laubel, A. R., Larsen, S. E., and Andersen, B.: Phosphorus retention in a Danish lowland river system, Verh. Internat. Verein. Limnol., 26, 956–962, 1998. 2559
30
USACE, H. E. C.: HEC-RAS River Analysis System User’s manual, Version 3.1,http://www. hec.usace.army.mil/software/hec-ras/hecras-hecras.html, 2002. 2553
HESSD
2, 2549–2579, 2005 Analysis of nutrient retention and management for a lowland river D. Kneis et al. Title Page Abstract Introduction Conclusions References Tables Figures J I J I Back CloseFull Screen / Esc
Print Version
Interactive Discussion
EGU
from sediments in shallow eutrophic systems, Water Research, 25, 737–744, 1991. 2555 Van Griensven, A. and Bauwens, W.: Concepts for river water quality processes for an
inte-grated river basin modelling, Water Science and Technology, 48, 1–8, 2003. 2551
Welch, E. B. and Cooke, G. D.: Internal phosphorus loading in shallow lakes: Importance and control, Lake and Reservoir Management, 21, 209–217, 2005. 2557
5
Windolf, J., Jeppesen, E., Jensen, J. P., and Kristensen, P.: Modelling of seasonal variation in nitrogen retention and in-lake concentration: A four-year mass balance study in 16 shallow Danish lakes, Biogeochemistry, 33, 25–44, 1996. 2557,2558
HESSD
2, 2549–2579, 2005 Analysis of nutrient retention and management for a lowland river D. Kneis et al. Title Page Abstract Introduction Conclusions References Tables Figures J I J I Back CloseFull Screen / Esc
Print Version
Interactive Discussion
EGU
Table 1. Features of continuous flow stirred tank reactors (CFSTR) and plug-flow reactors (PFR) in the TraM model.
CFSTR PFR
Equivalent in nature Polymictic lakes River/channel sections Advective transport Neglected Implemented
Dispersive transport Implemented Currently neglected Transport calculation Numerical solution of
mass balance equation
Shifting of load hydrograph time axis according to flow velocity Geometric input data Stage-Volume- and
Stage-Area-Relation
Flow area and wet perimeter as function of stage
Dynamic input data Stage and flow hydrographs, time series of load from up-stream waters and external sources, retention parameters
HESSD
2, 2549–2579, 2005 Analysis of nutrient retention and management for a lowland river D. Kneis et al. Title Page Abstract Introduction Conclusions References Tables Figures J I J I Back CloseFull Screen / Esc
Print Version
Interactive Discussion
EGU
Table 2. Monthly median values of TN retention (mg m−2d−1) for lakes of the Potsdamer Havel calculated from mass balances for the years 1996–2002. See Fig.1for lake labels C–F.
Lake Jan Feb Mar Apr May Jun Jul Aug Sep Oct Nov Dec C 107 141 322 330 230 227 224 181 184 140 168 124
D 43 124 71 -15 36 42 133 44 27 46 16 -13
E 42 100 161 137 67 35 27 20 51 75 67 44
HESSD
2, 2549–2579, 2005 Analysis of nutrient retention and management for a lowland river D. Kneis et al. Title Page Abstract Introduction Conclusions References Tables Figures J I J I Back CloseFull Screen / Esc
Print Version
Interactive Discussion
EGU
Table 3. Errors in simulated TP and TN concentrations at monitoring station Ketzin (label 1 in
Fig.1) for the period of model calibration (1995–2000) and four additional years. ME: mean
error (Bias), MAPE: mean absolute percental error, Efficiency: Nash/Sutcliffe index.
Variable Parameter 1995 1996 1997 1998 1999 2000 2001 2002 2003 2004 TP ME (mg l−1) −0.02 0.01 −0.02 −0.01 −0.02 −0.13 −0.01 0.02 0.10 0.05 MAPE (%) 30.2 21.6 18.4 28.0 14.8 29.9 18.6 27.1 41.7 24.4 Efficiency (–) 0.70 0.42 0.82 0.71 0.96 0.69 0.81 0.81 0.02 0.43 TN ME (mg l−1) 0.18 −0.15 −0.33 0.07 0.30 0.08 0.17 0.02 0.12 0.05 MAPE (%) 25.2 18.6 18.1 17.6 19.2 15.8 20.1 10.5 13.0 20.7 Efficiency (–) −0.19 0.10 0.03 −0.26 0.10 0.55 0.36 0.57 0.80 0.54
HESSD
2, 2549–2579, 2005 Analysis of nutrient retention and management for a lowland river D. Kneis et al. Title Page Abstract Introduction Conclusions References Tables Figures J I J I Back CloseFull Screen / Esc
Print Version
Interactive Discussion
EGU
Table 4. Assumed reduction of TP emissions from the Spree catchment (ESpree) and all other subcatchments (EOther) and its effect on the average TP concentration of the Havel River CHavel at monitoring station 2 (see Fig.1). The initial values for the base scenario P0 are averages over 13 years.
Scenario ESpree EOther ETotal CHavel P0 6.2 g/s 4.2 g/s 10.4 g/s 0.23 mg/l ∆ESpree ∆EOther ∆ETotal ∆CHavel
P1 0.0% −13.0% −5.2% −3.7%
HESSD
2, 2549–2579, 2005 Analysis of nutrient retention and management for a lowland river D. Kneis et al. Title Page Abstract Introduction Conclusions References Tables Figures J I J I Back CloseFull Screen / Esc
Print Version Interactive Discussion EGU River/channel sections Shallow lakes Mittlere Havel Potsdamer Havel Kladower Seestrecke Teltowkanal Sacrow-Paretzer-Kanal Nuthe Spree Obere Havel Havelkanal Emster Kanal $ $ $ $ $ $ $ $ $ $ $ $ $ $ $ $ $ $ 1 2 0 10 Km Weir A B C D E F $
$ Water quality monitoring sites
BERLIN
Fig. 1. The Havel River downstream of the city Berlin with its major inflows (in bold). Labels A–F and numbers are used throughout the text for reference purposes.
HESSD
2, 2549–2579, 2005 Analysis of nutrient retention and management for a lowland river D. Kneis et al. Title Page Abstract Introduction Conclusions References Tables Figures J I J I Back CloseFull Screen / Esc
Print Version
Interactive Discussion
EGU
Transport model TraM
Hydrodynamic model
HEC-RAS 3.1.1
Catchment models
(SWIM, ArcEGMO-Urban)
Nutrient loads from point & non-point sources
Flow and stage hydrographs for all reactors
Inflow from Spree catchment Discharge of t ribut aries Catchment data Stage at downstream model boundary
Nutrient load from Spree catchment
Fig. 2. Interaction between the transport, the hydrodynamic and the catchment model(s). Dot-ted arrows indicate the exchange of boundary conditions while solid arrows mark external input data.
HESSD
2, 2549–2579, 2005 Analysis of nutrient retention and management for a lowland river D. Kneis et al. Title Page Abstract Introduction Conclusions References Tables Figures J I J I Back CloseFull Screen / Esc
Print Version Interactive Discussion EGU -40 -20 0 20 40 60
Jan Feb Mar Ap
r
May Jun Jul Au
g Se p Oct No v De c Net P export (mg m -2 d -1 )
Templiner See Nord (C) Templiner See Sued (D) Schwielowsee (E) Werdersche Havel (F)
Fig. 3. Monthly medians of net phosphorus export (positive) and retention (negative) for 4 large lakes of the Lower Havel River over the period 1995–2000 (see Fig.1for the lakes’ locations). The 95% confidence interval is indicated by dotted lines.
HESSD
2, 2549–2579, 2005 Analysis of nutrient retention and management for a lowland river D. Kneis et al. Title Page Abstract Introduction Conclusions References Tables Figures J I J I Back CloseFull Screen / Esc
Print Version Interactive Discussion EGU 0.0 0.2 0.4 0.6 0.8 1.0 1.2 01/95 01/97 01/99 01/01 01/03 TP (mg /l) Calibrated model Conservative model Observation
Fig. 4. Observed and simulated TP concentration of the Havel River at Ketzin (label 1 in Fig.1) for the time period of model calibration (1995–2000) and four additional years.
HESSD
2, 2549–2579, 2005 Analysis of nutrient retention and management for a lowland river D. Kneis et al. Title Page Abstract Introduction Conclusions References Tables Figures J I J I Back CloseFull Screen / Esc
Print Version Interactive Discussion EGU Lakes A Lake B Lake C Lake D Lake E Lake F River from 1-2 Teltowkanal Ja n Fe b Ma r Ap r Ma y Ju n Ju l Au g Se p Oc t Nov Dec 0.001 0.001 0.007 0.012 0.014 0.019 0.019 0.016 0.008 0.003 0.002 0.000 0.013 0.017 0.025 0.039 0.036 0.026 0.021 0.012 0.008 0.014 0.016 0.018 0.010 0.015 0.019 0.035 0.031 0.028 0.024 0.015 0.009 0.013 0.016 0.018 0.005 0.005 0.005 0.009 0.011 0.012 0.016 0.013 0.009 0.008 0.006 0.005 0.005 0.008 0.011 0.013 0.011 0.008 0.007 0.004 0.005 0.006 0.008 0.008 0.004 0.007 0.015 0.019 0.021 0.013 0.011 0.008 0.008 0.009 0.009 0.009 0.010 0.012 0.013 0.019 0.020 0.025 0.033 0.026 0.024 0.023 0.006 0.004 0.015 0.011 0.012 0.013 0.013 0.015 0.020 0.022 0.021 0.017 0.017 0.017 kTN (d-1) 0 0.040 0 0.035 0 0.030 0 0.025 0 0.020 0 0.015 0 0.010 0 0.005 0 0.000
Fig. 5. Estimates of the rate constant kTN (d−1) used for approximating the retention of total nitrogen by a first order kinetics. The values were identified by model calibration in 1995–2000. Refer to Fig.1for labels.
HESSD
2, 2549–2579, 2005 Analysis of nutrient retention and management for a lowland river D. Kneis et al. Title Page Abstract Introduction Conclusions References Tables Figures J I J I Back CloseFull Screen / Esc
Print Version Interactive Discussion EGU 0 10 20 30 40 50 60 01/95 01/97 01/99 01/01 01/03 C u m u la ted TN l oad ( k t)
Calculated from observation data Conservative model run
Calibrated model
Fig. 6. Cumulated load of total nitrogen (kilotons) at the downstream end of the river network (monitoring station 2 in Fig.1) as computed from observed data and model simulations.
HESSD
2, 2549–2579, 2005 Analysis of nutrient retention and management for a lowland river D. Kneis et al. Title Page Abstract Introduction Conclusions References Tables Figures J I J I Back CloseFull Screen / Esc
Print Version Interactive Discussion EGU -30 -20 -10 0 10 20 30 40 -50 -25 0 25 50 Year Feb Jul ∆ kTN (%) ∆ C TN ( % ) -30 -20 -10 0 10 20 30 40 -50 -25 0 25 50 Year Apr Oct ∆ rTP (Jun-Oct) (%) ∆ C TP ( % )
Fig. 7. Left: Simulated change in average TN concentrations∆CTNat monitoring station 2 (see
Fig.1) resulting from the use of altered retention parameters kT Nstarting from calibrated values
(Fig.5). Right: Change in average TP concentrations∆CTPat the same monitoring station as simulated with net phosphorus retention rates rTP for June–October varied from −50 to+50% around the mean values shown in Fig.3.
HESSD
2, 2549–2579, 2005 Analysis of nutrient retention and management for a lowland river D. Kneis et al. Title Page Abstract Introduction Conclusions References Tables Figures J I J I Back CloseFull Screen / Esc
Print Version Interactive Discussion EGU 0 0.1 0.2 0.3 0.4 0.5 0.6 Ja n F eb Mar Apr M ay Jun Jul A ug Sep Oct Nov D ec T P [m g/ l] -60 -50 -40 -30 -20 -10 0 T P [% ]
Scenario P0 Scenario P1 Scenario P2
TP (P0 P1) TP (P0 P2)
Fig. 8. Monthly averages of TP concentration (columns) at the downstream boundary of the studied river
section (label 2 in Fig. 1) for the scenarios P0, P1 & P2. Lines illustrate the proportional change in average
concentrations (∆ TP) associated with the scenarios P1 & P2.
0.0 0.5 1.0 1.5 2.0 2.5 3.0 Ja n F eb Mar Apr M ay Jun Jul A ug Sep Oct Nov D ec T N [m g/ l] -12 -11 -10 -9 -8 -7 -6 T N [% ] Scenario N0 Scenario N1 TN (N0 N1)
Fig. 9. Monthly averages of TN concentration (columns) at the downstream boundary of the studied river
section (label 2 in Fig. 1) for scenario N0 & N1. The dashed line marks the proportional change in average
concentration (∆ TN) associated with scenario N1.
20
Fig. 8. Monthly averages of TP concentration (columns) at the downstream boundary of the studied river section (label 2 in Fig. 1) for the scenarios P0, P1 and P2. Lines illustrate the proportional change in average concentrations (∆ TP) associated with the scenarios P1 and P2.
HESSD
2, 2549–2579, 2005 Analysis of nutrient retention and management for a lowland river D. Kneis et al. Title Page Abstract Introduction Conclusions References Tables Figures J I J I Back CloseFull Screen / Esc
Print Version Interactive Discussion EGU 0.0 0.5 1.0 1.5 2.0 2.5 3.0
Jan Feb Mar Ap
r
May Jun Jul Au
g Se p Oct No v De c T N ( mg/l ) -12 -11 -10 -9 -8 -7 -6 ∆ T N ( % ) Scenario N0 Scenario N1 ∆TN (N0→N1)
Fig. 9. Monthly averages of TN concentration (columns) at the downstream boundary of the studied river section (label 2 in Fig.1) for scenario N0 and N1. The dashed line marks the proportional change in average concentration (∆ TN) associated with scenario N1.